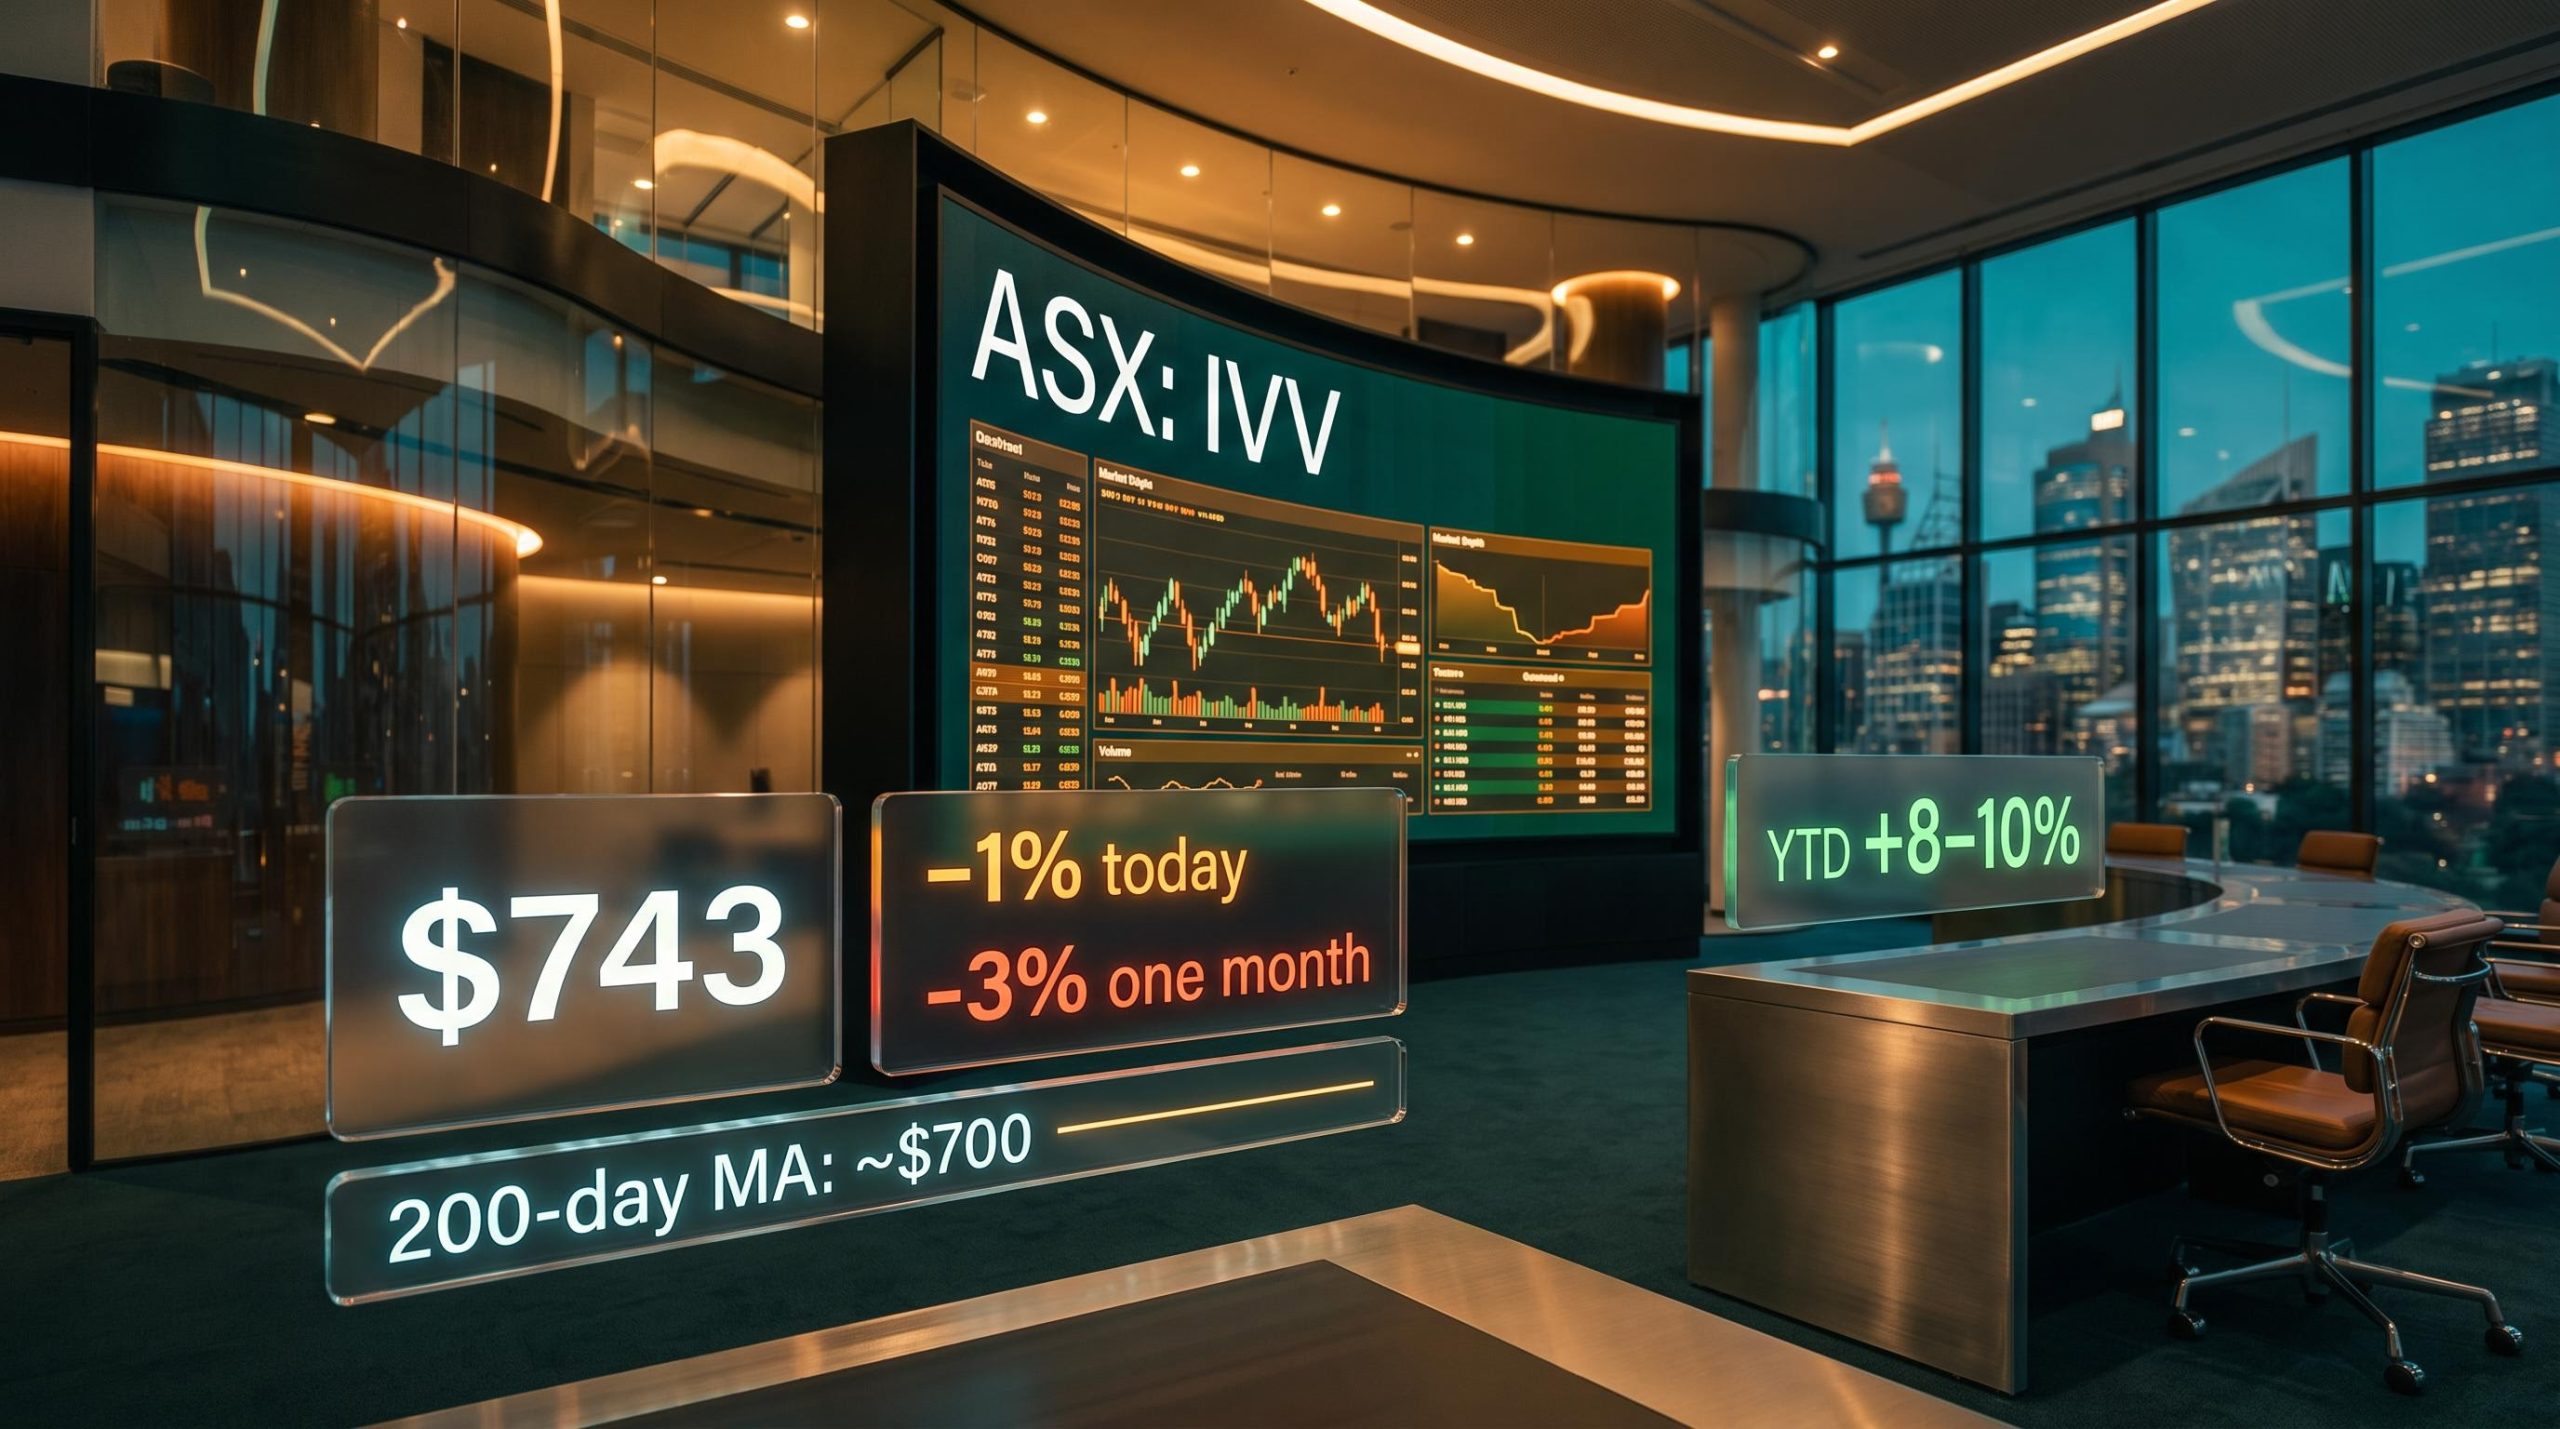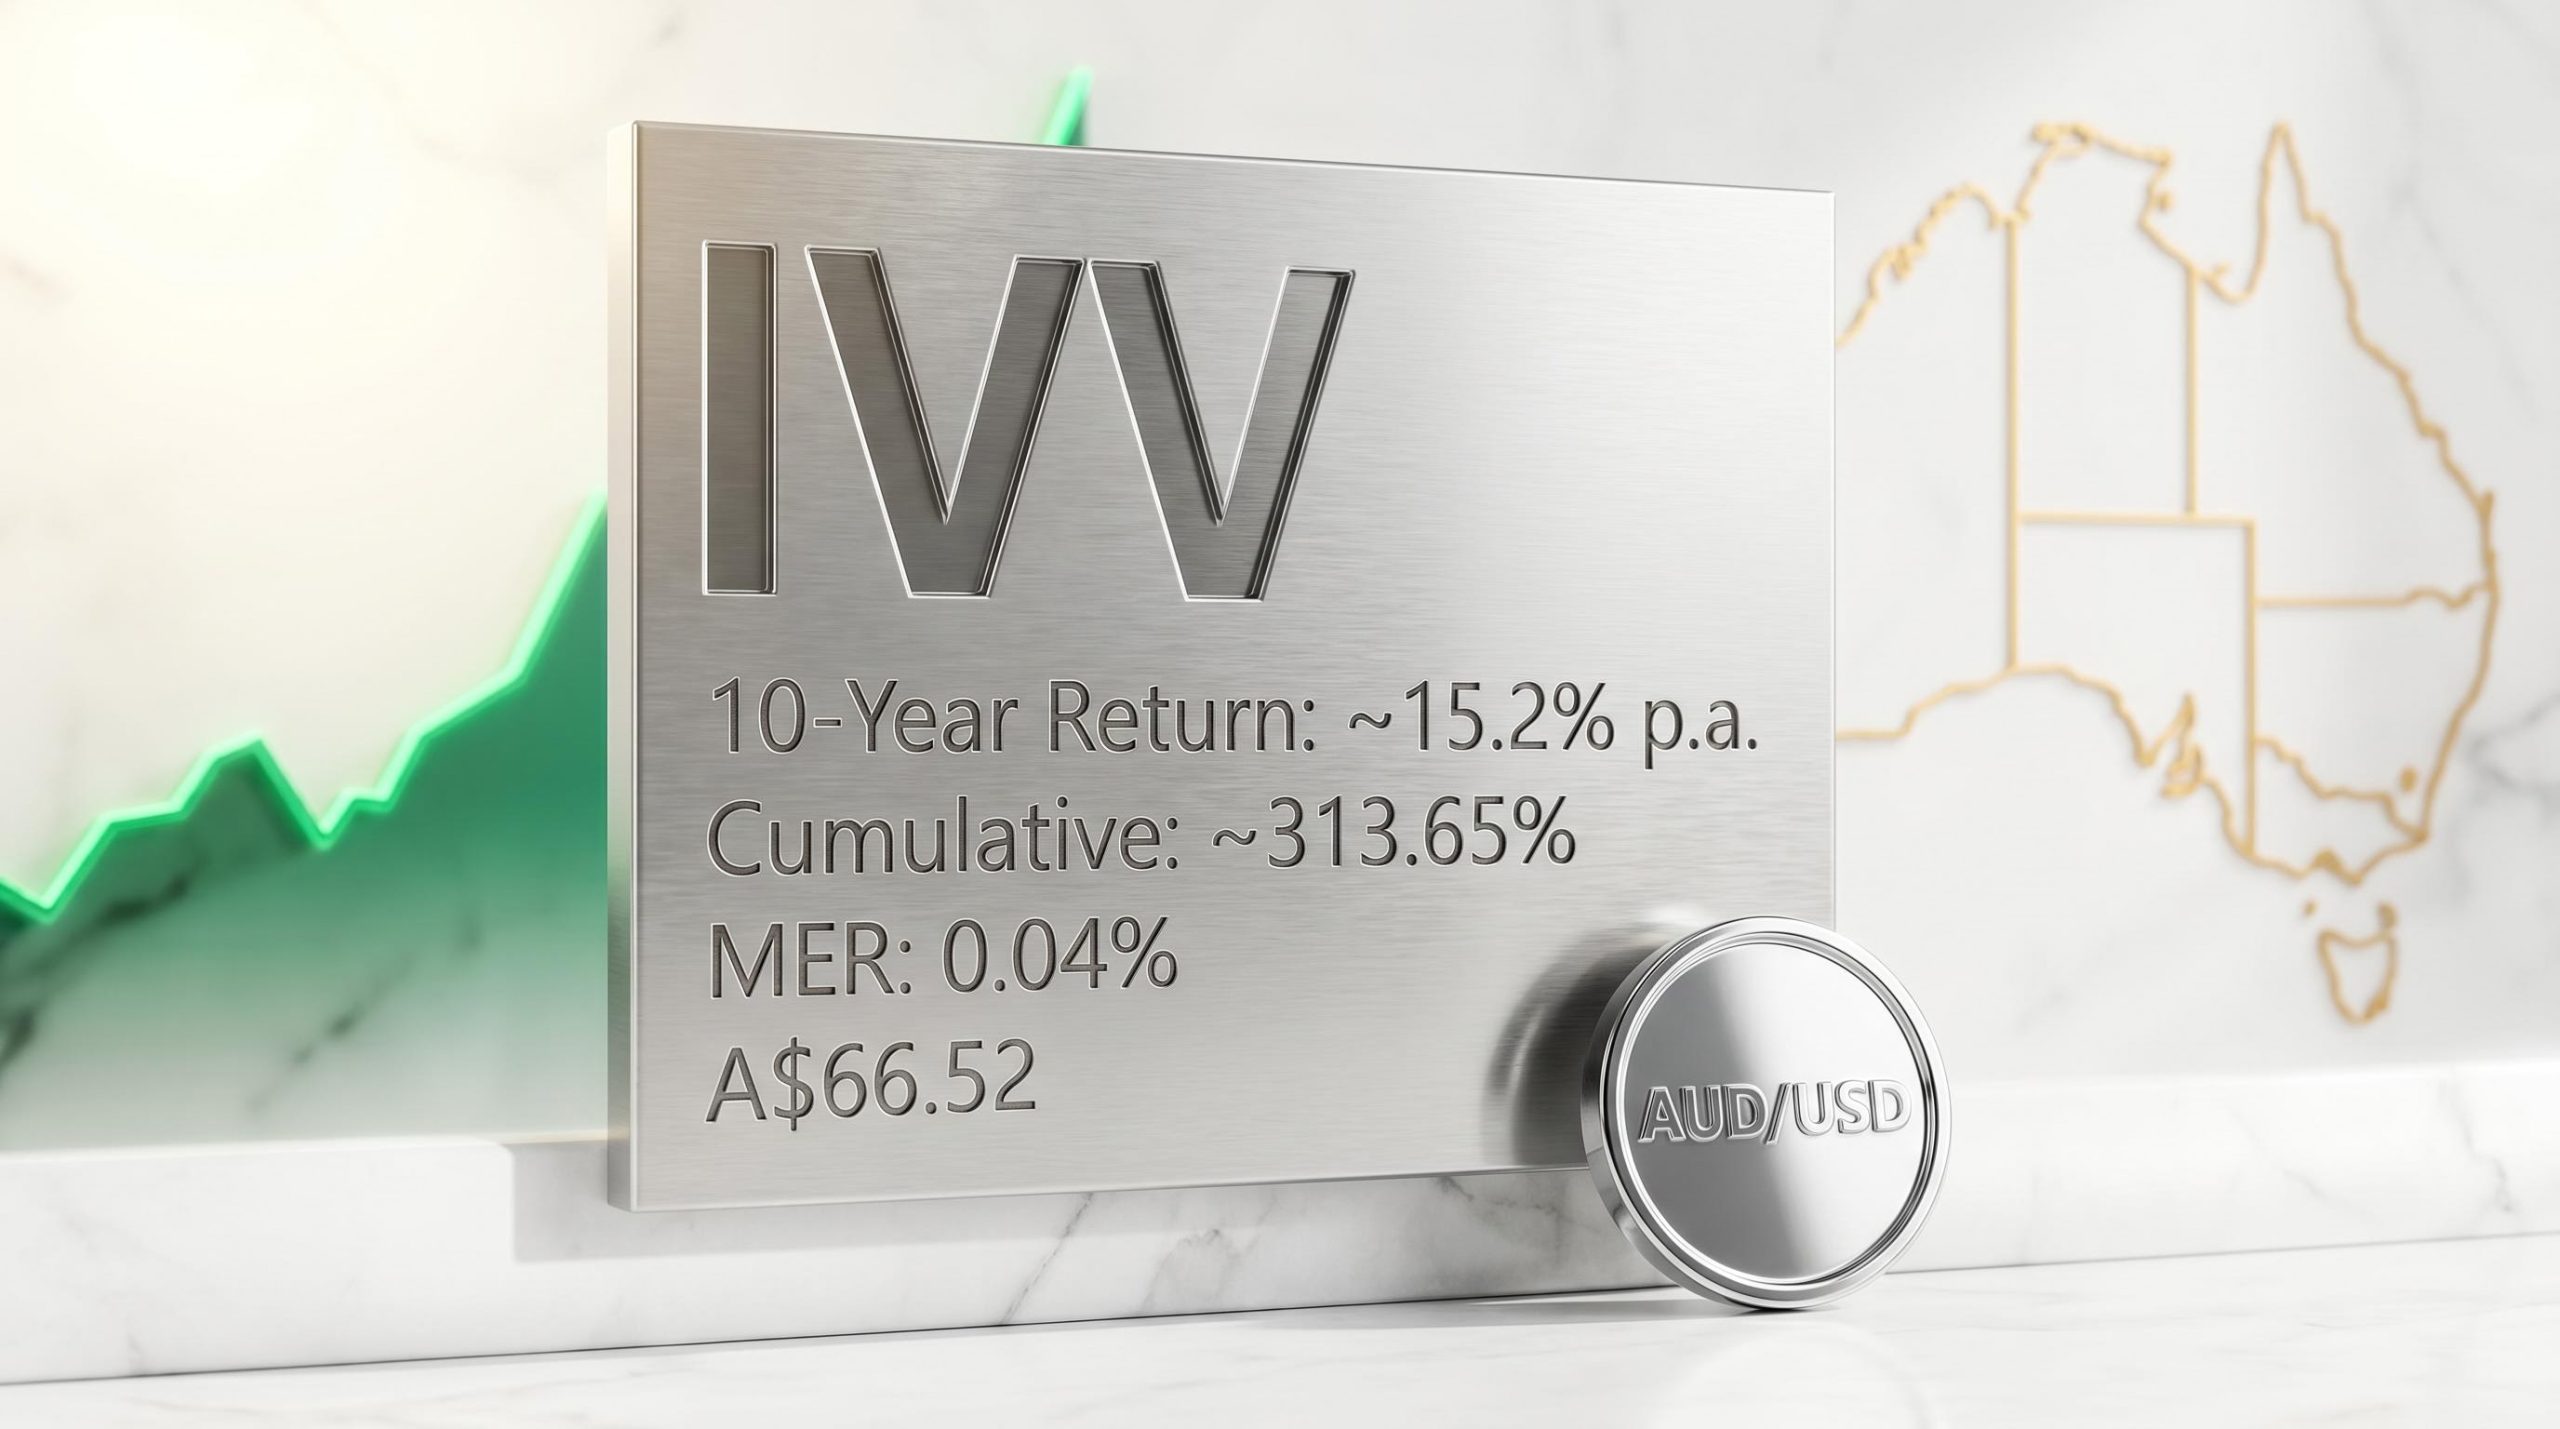
The iShares S&P 500 ETF (ASX: IVV) charges 0.04% per annum in management fees. That near-zero cost, paired with a reported 10-year annualised return of approximately 15.2% per annum in AUD terms, frames the question at the centre of this analysis: what has driven those returns, and does the underlying case for owning them still hold?
Australian investors have increasingly turned to ASX-listed US equity ETFs as a structural counterweight to the local market’s heavy concentration in banks and miners. IVV sits at the centre of that trend as one of the largest ETFs on the exchange by assets under management. With current conditions testing short-term returns, the long-term investment thesis warrants a clear-eyed examination.
This analysis works through the historical performance record, the structural characteristics that make IVV accessible for Australian investors, the currency dynamics that shape real-world returns, and how IVV compares to its closest alternatives. The goal is a substantive framework for evaluating whether this ETF belongs in a long-term portfolio.
What the last decade of S&P 500 returns actually shows
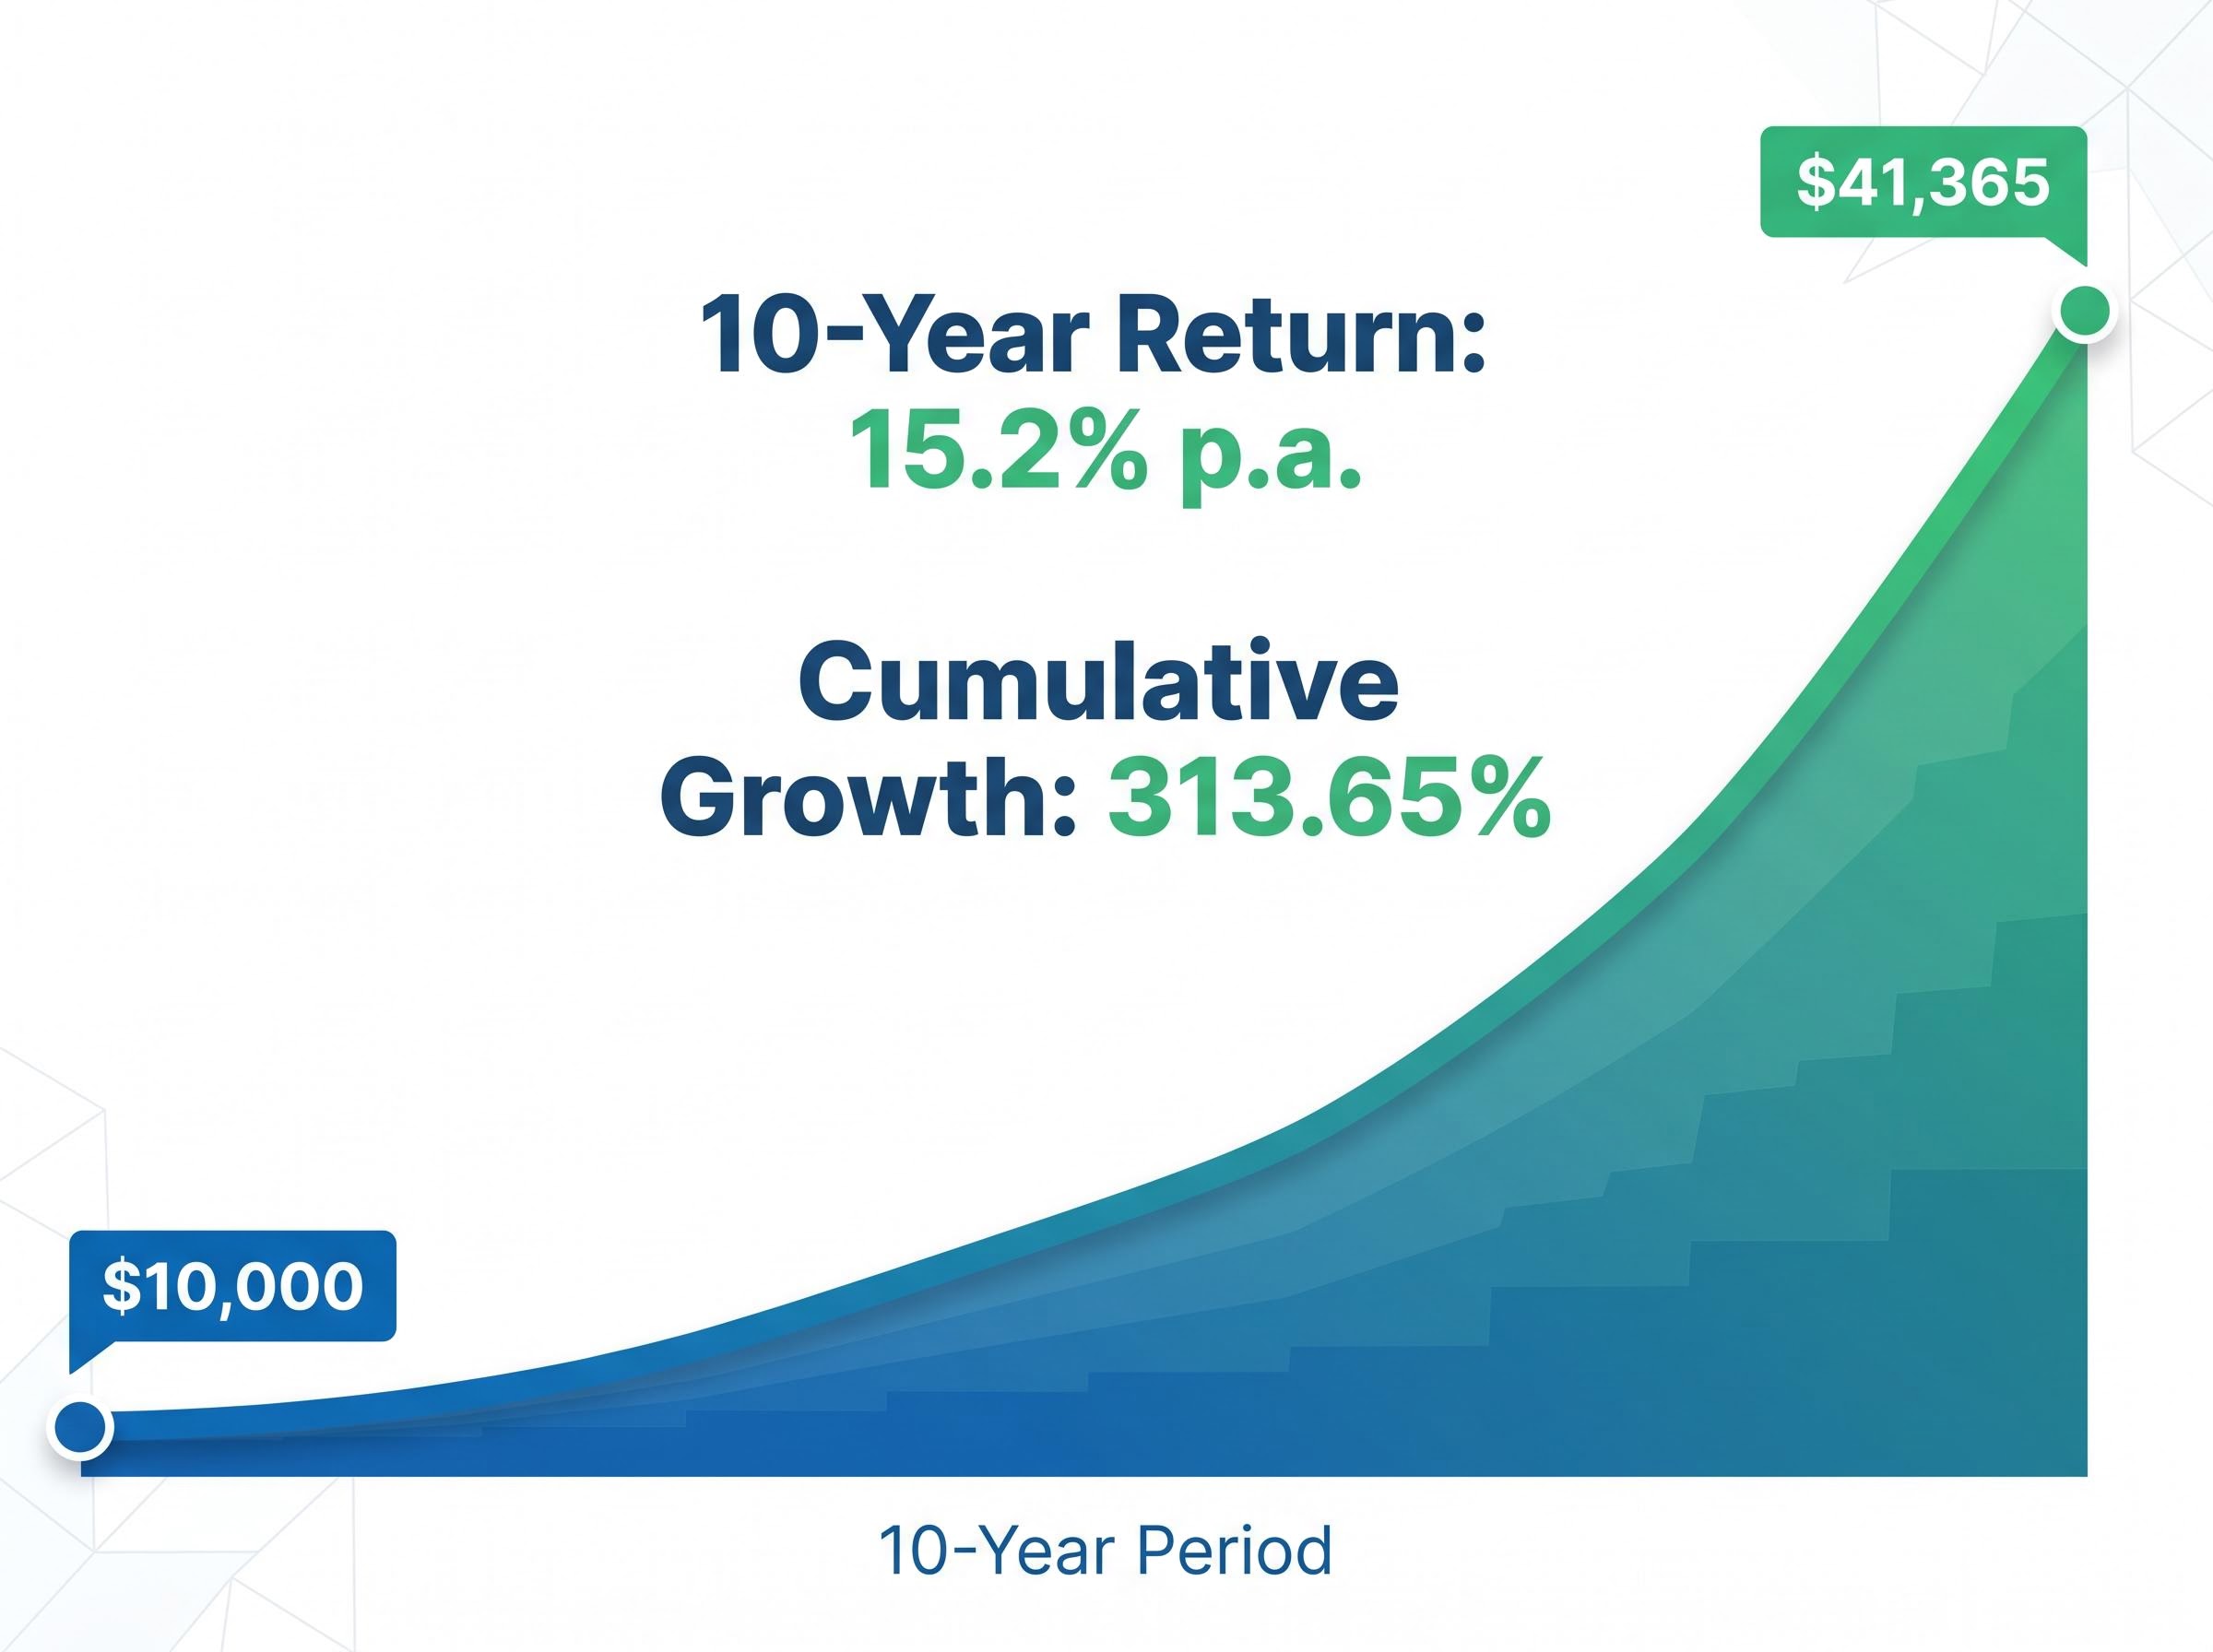
Start with the numbers. IVV has delivered an annualised return of approximately 15.2% per annum over ten years in AUD terms, translating to a cumulative return of roughly 313.65% over that period. The five-year annualised figure sits in the range of 14.15-15.7% per annum, depending on the source and calculation date.
A $10,000 investment in IVV a decade ago would have grown to approximately $41,365 in AUD terms, before any additional contributions.
Those figures fold in both the S&P 500’s USD performance and the AUD/USD exchange rate movement across the period. They reflect what an Australian investor actually received, not a theoretical USD return.
The short-term picture looks different. Year-to-date returns sit at approximately -5.82%, and the unit price of A$66.52 (as of 30 April 2026) trades within a 52-week range of A$57.09 to A$70.08. Recent volatility is real, but it is the long-run record that forms the analytical baseline for the sections that follow.
| Timeframe | Return (AUD, unhedged) | Source Attribution |
|---|---|---|
| YTD | -5.82% | BlackRock (reported) |
| 1-year | 1.85-6.88% | BlackRock / InvestSMART (range reflects different calculation dates) |
| 5-year (p.a.) | ~14.15-15.7% | InvestSMART / BlackRock (reported) |
| 10-year (p.a.) | ~15.2% | BlackRock (reported) |
| 10-year (cumulative) | ~313.65% | BlackRock (reported) |
A note on data: BlackRock’s official product page was inaccessible at time of research. These figures are as reported by third-party sources and should be treated as indicative rather than definitively confirmed.
When big ASX news breaks, our subscribers know first
Why the US market has compounded so reliably over decades
A 15.2% annualised return over ten years is not a statistical accident. It reflects three reinforcing structural advantages that have driven US equity compounding for decades:
The shift toward international ETFs among Australian retail investors reached a structural inflection point in Q1 2026, with internationally focused funds overtaking domestic products as the most purchased ETF category for the first time on record, driven by the same ASX concentration and diversification arguments that underpin the case for IVV.
- Innovation cycles: The US consistently leads in technology commercialisation, from the internet and mobile computing to the current artificial intelligence buildout, creating successive waves of corporate earnings growth.
- Productivity growth: US companies embed efficiency gains into their operating models at scale, supported by deep capital markets, flexible labour markets, and a regulatory environment that rewards reinvestment.
- Global scalability: The largest US corporations operate global platforms with multi-billion user bases and revenue streams that extend well beyond domestic borders, giving their earnings a structural growth tailwind that domestically focused markets cannot replicate.
These forces do not guarantee future returns. They do, however, explain the mechanism that has produced historical ones, and the reader can assess their durability accordingly.
Where the S&P 500’s structural advantages concentrate today
The S&P 500 holds positions across 500 companies spanning technology, healthcare, financials, consumer, and industrials sectors. The current centres of gravity for earnings and growth sit in technology, healthcare, and capital markets.
Named holdings such as Apple, Nvidia, and Microsoft illustrate the concentration of platform-scale businesses that generate revenue globally. Holdings like McDonald’s and Tesla reflect the consumer and industrial reach of the index’s constituents.
The S&P 500’s historical return record is inseparable from the mechanics of index concentration risk, where six technology firms now comprise more than 30% of the index’s total weighting and amplify both upside and downside moves for every passive holder of the index.
This breadth matters for Australian investors specifically. The ASX’s sector concentration in financials and materials limits diversification; the S&P 500’s composition offers exposure to sectors that are structurally underrepresented on the local exchange. Continued AI-driven earnings growth in large-cap technology is also cited as a current offset to near-term macro headwinds facing US equities.
How IVV works as an Australian-listed vehicle
IVV is Australia-domiciled and ASX-listed, which means it trades in AUD during Australian market hours. Unlike direct US-listed equivalents such as SPY or VOO, it does not require a W-8BEN form, removing a layer of administrative complexity for local investors.
Key structural features at a glance:
- ASX-listed and AUD-denominated
- No W-8BEN form required
- Eligible for standard Australian brokerage accounts and many self-managed super funds (SMSFs)
- Management expense ratio (MER) of 0.04% per annum (reported; not live-verified from BlackRock product page at time of research)
At a 0.04% MER, a $100,000 investment incurs approximately $40 per year in fund management costs.
That fee level matters over time. A difference of even 0.20% in annual fees compounds meaningfully over a 20-year holding period, eroding returns that would otherwise stay in the investor’s account.
The fund’s size, reported at approximately A$11.67-12.54 billion in assets under management (with a noted discrepancy between sources), signals strong liquidity and institutional confidence. IVV is described as one of the largest ASX-listed ETFs, though its exact ranking could not be independently confirmed as of April 2026.
On tax treatment: distributions are generally treated as ordinary income for Australian tax purposes. Capital gains tax applies on disposal, with the 50% CGT discount available for assets held more than 12 months. No franking credits attach to distributions, as the underlying holdings are US companies. No US withholding tax complications arise at the investor level. Investors should seek independent tax advice for their specific circumstances.
The ATO guidance on ETF tax treatment confirms that distributions from foreign ETFs such as IVV are assessable as ordinary income, that the 50% CGT discount applies to units held for more than 12 months, and that no US withholding tax complications flow through to Australian investors at the individual level.
The currency layer Australian investors cannot ignore
IVV is unhedged. That means AUD/USD movements directly amplify or erode the returns Australian investors experience.
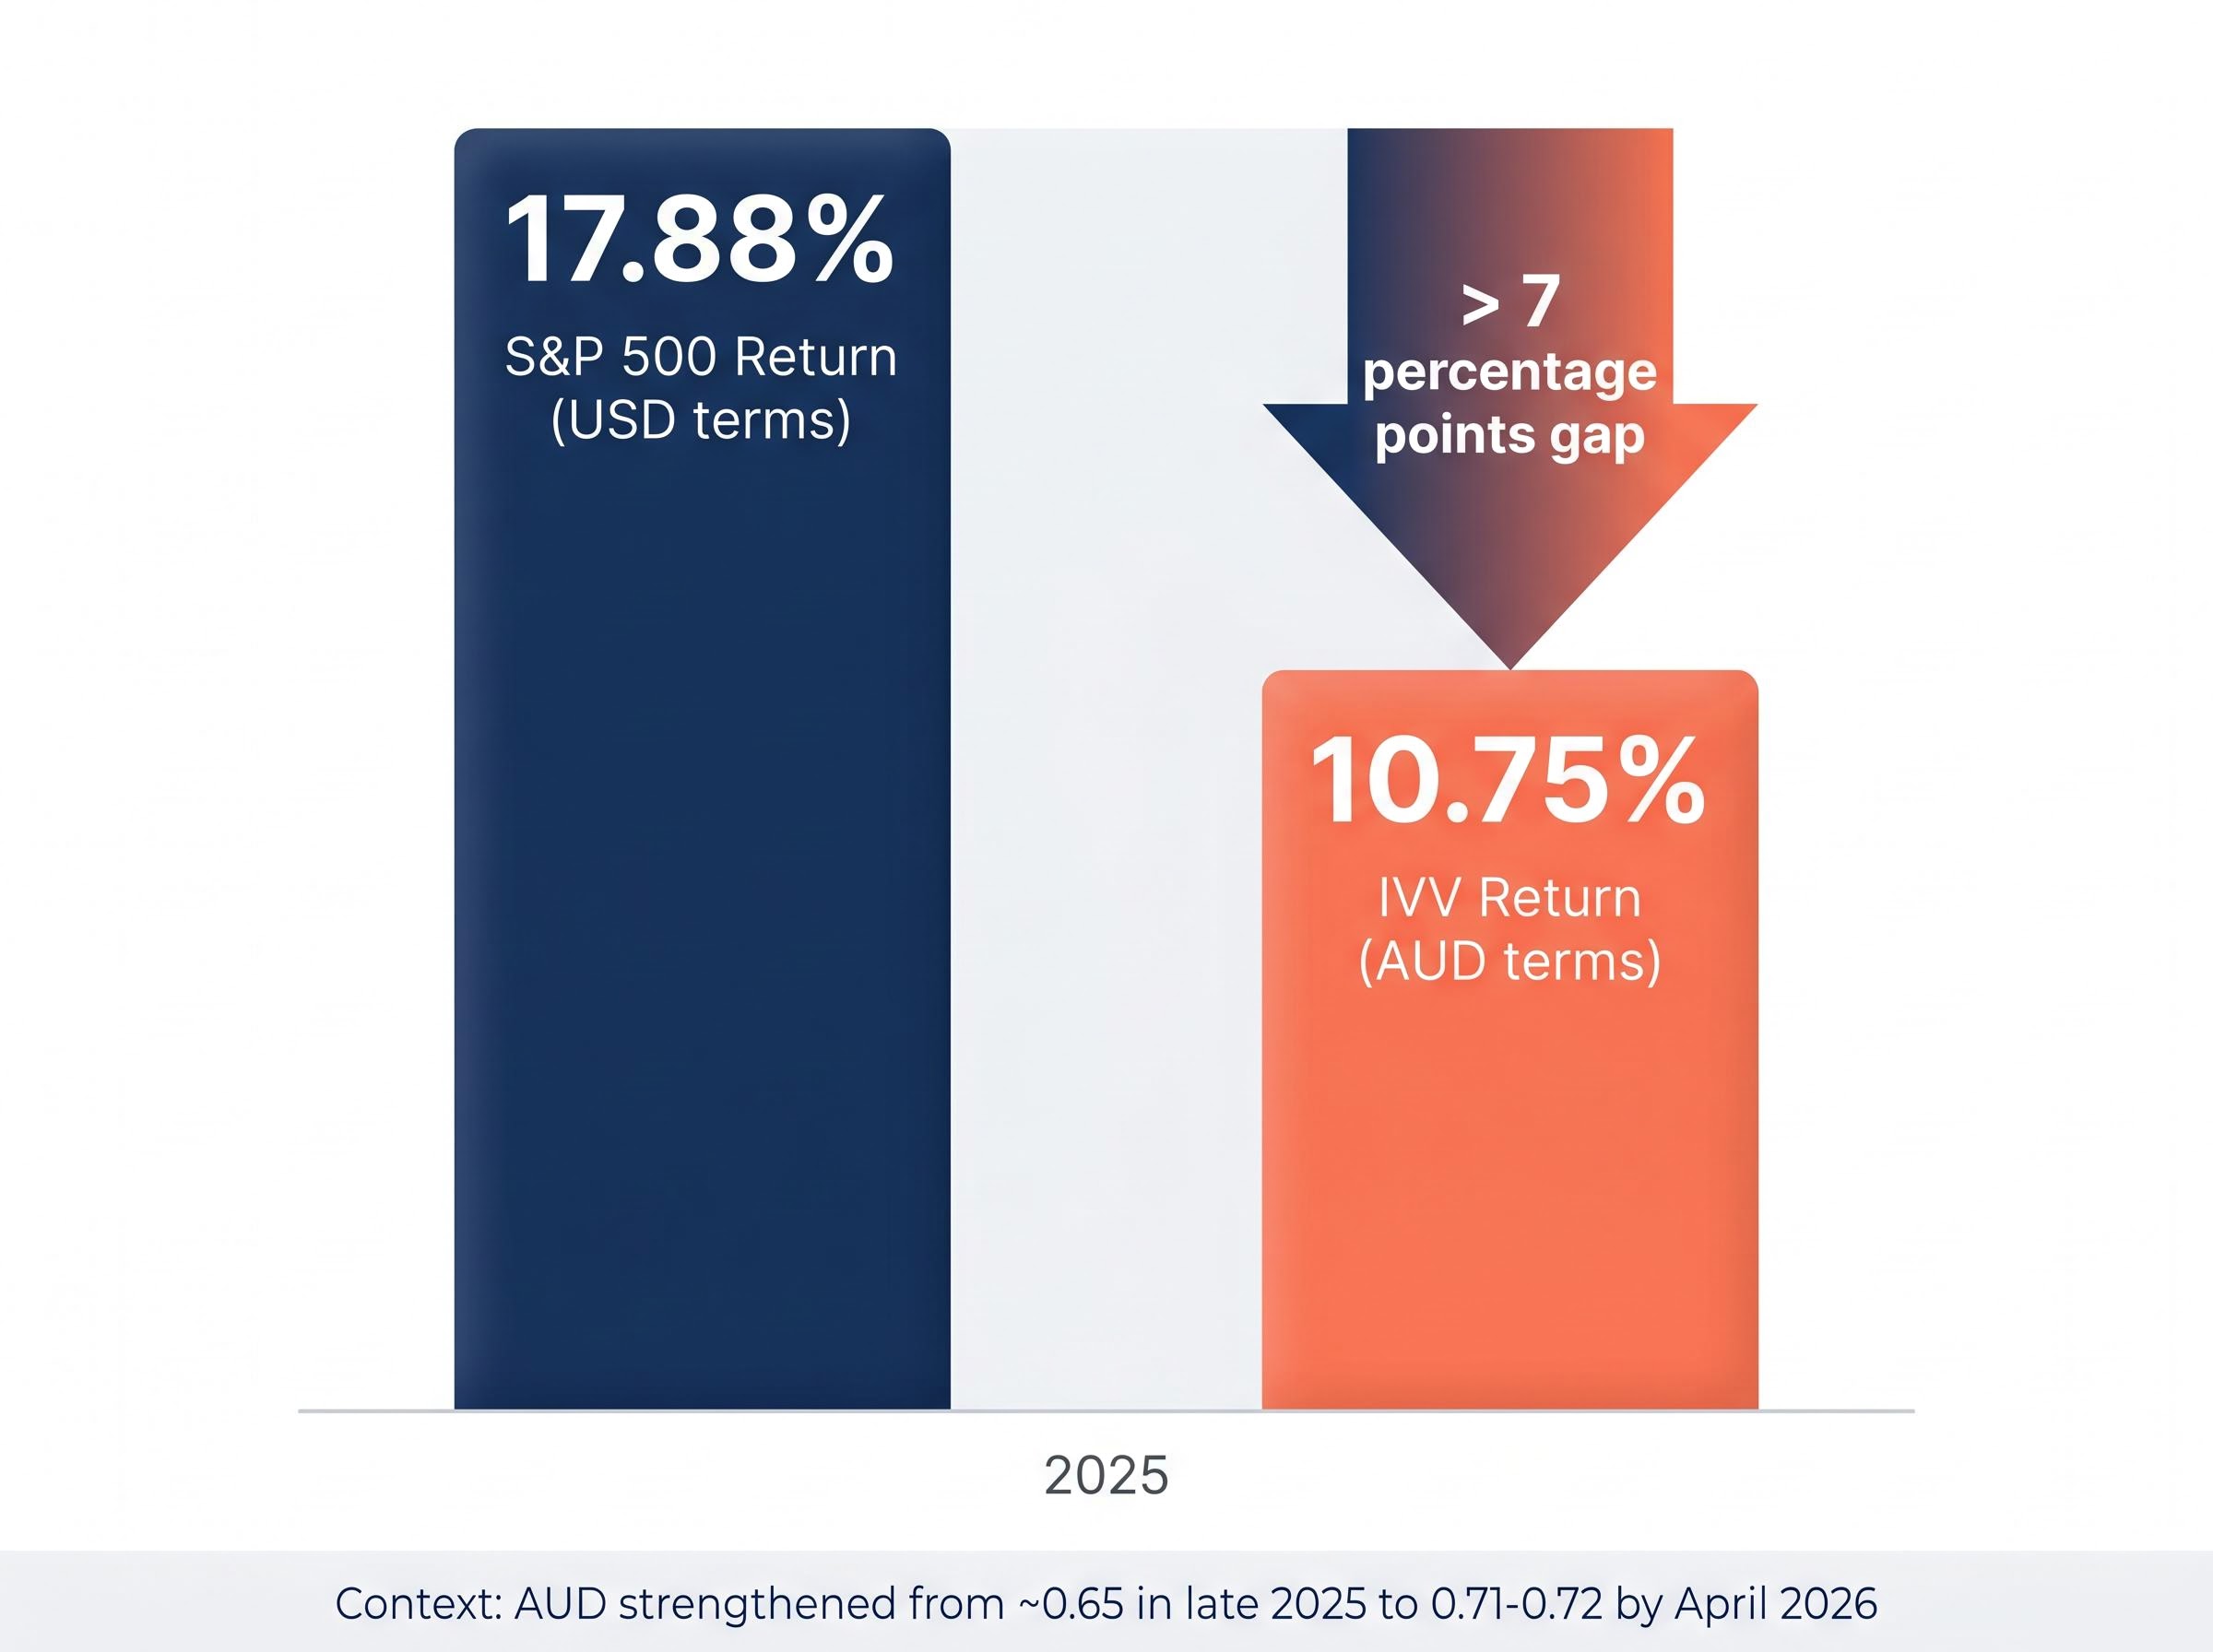
In the current environment, that dynamic is working against unhedged holders. The AUD appreciated from approximately 0.65 in late 2025 to approximately 0.71-0.72 by April 2026, representing a meaningful strengthening of the local currency.
The mechanics work through two channels:
- Conversion at a less favourable exchange rate: When the AUD strengthens, USD-denominated gains are worth fewer Australian dollars at conversion. A strong US market return can be partially offset by the time it reaches an Australian investor’s account.
- Compounding against a weakening USD: Federal Reserve rate cut expectations have contributed to USD weakness, which compounds the AUD strength effect over time.
RBA monetary policy decisions, including the rate cut delivered in February 2026 and the accompanying shift in the interest rate outlook, contributed to the conditions underpinning AUD strength through the first quarter of 2026, which directly compressed unhedged returns for Australian holders of US equity ETFs over that period.
In 2025, the S&P 500 returned approximately 17.88% in USD terms versus approximately 10.75% in AUD terms for IVV holders, a gap of more than 7 percentage points attributable primarily to currency movement. These figures are directionally illustrative; they were not independently verified against an authoritative source.
Flow data tells a consistent story. In March 2026, IVV recorded approximately $461 million in outflows, while the hedged equivalent IHVV recorded approximately $232 million in inflows, according to reporting by Motley Fool (not independently verified). RBA rate-setting decisions are cited as a contributor to AUD strength, though the specific policy actions could not be confirmed via primary sources.
Currency dynamics are the most commonly underestimated variable in international ETF returns. A rising AUD is not a fault in IVV’s design; it is a structural feature that works in both directions. When the AUD weakens, unhedged holders receive a tailwind. The investor’s task is to decide which direction they expect over their holding period.
IVV versus its closest ASX-listed rivals
The choice between ASX-listed US equity ETFs comes down to three variables: currency exposure, index scope, and cost. The table below compares IVV against its two most relevant alternatives.
| Feature | IVV (iShares S&P 500) | IHVV (iShares S&P 500 Hedged) | VTS (Vanguard US Total Market) |
|---|---|---|---|
| Index tracked | S&P 500 Net TR (AUD) | S&P 500 (AUD hedged) | Total US market |
| Currency exposure | Unhedged AUD | Hedged to AUD | Unhedged AUD |
| MER | 0.04% (reported) | Not confirmed | Not confirmed |
| Domicile | Australia | Australia | Australia |
| W-8BEN required | No | No | No |
The single most important consideration for each comparison:
- IVV vs IHVV: This is a view on AUD/USD direction. IVV outperforms when the AUD weakens; IHVV outperforms (or is protected) when the AUD strengthens. The March 2026 flow data, if accurate, suggests investors are rotating within the US equity category rather than exiting it.
- IVV vs VTS: VTS provides exposure to the total US equity market, including mid-cap and small-cap stocks, versus IVV’s large-cap S&P 500 focus. For investors with a specific large-cap thesis, IVV is the more targeted instrument.
No direct ASX equivalents to SPY or VOO exist for Australian investors. IVV remains the most liquid ASX-listed S&P 500 ETF.
Evaluating IVV for a long-term Australian portfolio
The preceding sections point toward a clear investor profile. IVV is a structurally sound long-term holding for investors who:
- Have a time horizon of 10 years or more
- Are comfortable with unhedged currency risk (or actively prefer it as a diversification benefit)
- Seek sector diversification away from the ASX’s concentration in financials and materials
- Prefer passive, low-cost exposure to US large-cap equities
The ASX diversification rationale deserves emphasis. The Australian equity market is heavily weighted toward banks and miners. IVV provides direct exposure to technology, healthcare, capital markets, and consumer sectors that are structurally underrepresented locally. That diversification argument holds regardless of short-term currency or market conditions.
What would change the investment calculus
Three conditions would prompt a reassessment: sustained AUD appreciation eroding returns over multiple years, a structural shift in US corporate earnings power that undermines the compounding thesis, or a change in the investor’s own time horizon or risk tolerance. None of these are present in a way that overrides the long-term case today, but each warrants ongoing monitoring.
Current headwinds are real. AUD appreciation, a weakening USD, tariff uncertainty, and geopolitical tensions (including the Iran conflict) are all weighing on near-term returns. The 10-year annualised return of approximately 15.2% per annum in AUD was achieved through multiple periods of comparable volatility. The investor most likely to benefit from IVV is one whose horizon is long enough that these conditions are a temporary feature of the journey.
For investors wanting a structured framework for positioning around IVV during periods of drawdown, our comprehensive walkthrough of volatile market portfolio construction examines a three-layer approach covering cash, income-generating bonds, and diversified equities, with specific analysis of how dollar-cost averaging and tax-loss harvesting can convert volatility into a structural accumulation advantage.
US recession probability estimates from Goldman Sachs, J.P. Morgan, and Moody’s Analytics range from 30% to 48.6% for the next 12 months, a divergence between institutional risk assessment and current index levels that long-term IVV holders should factor into their return expectations for the near-term window.
This article is for informational purposes only and should not be considered financial advice. Investors should conduct their own research and consult with financial professionals before making investment decisions. Past performance does not guarantee future results.
The long-run case for passive US equity exposure remains intact
The historical performance record of the S&P 500 in AUD terms reflects durable structural advantages, not statistical noise. A decade of approximately 15.2% annualised returns in IVV traces directly to the innovation cycles, productivity growth, and global scalability discussed in this analysis.
Short-term pressures from AUD strength and macro uncertainty are genuine, but short-term volatility has been a recurring feature of every decade of US equity investing. The case for passive US large-cap exposure rests on the persistence of the structural forces, not on the absence of headwinds.
Investors considering IVV should verify current performance and pricing data via BlackRock’s product page and their own brokerage platform, and consult a financial adviser before making investment decisions.