How to Value ASX Bank Stocks Using NIM, ROE and CET1
6 mins ago

A fully franked $0.35 dividend from Bank of Queensland (BOQ) is not actually worth $0.35 to an Australian resident investor. Once imputation credits are included, that same payment is worth closer to $0.50, and that single adjustment can shift a Dividend Discount Model fair value estimate by more than 40%. The DDM is one of the oldest equity valuation tools in use, but most textbook versions are built for markets without dividend imputation systems. For Australian investors appraising ASX bank stocks, applying the model without franking credit adjustments systematically understates intrinsic value, creating a gap between what the formula produces and what the income stream is actually worth to a domestic investor. This guide walks through the DDM formula step by step, shows exactly how to gross up franked dividends using the Australian Tax Office’s own formula, applies both methods to BOQ’s current dividend data, and explains why the sensitivity matrix produces such a wide range of outcomes, so the reader can run the same analysis on any fully franked ASX dividend stock.
The DDM’s core logic is intuitive. A stock is worth the present value of every dividend it will ever pay. The Gordon Growth Model distils that idea into a single formula:
Gordon Growth Model: P = D1 / (r – g)
P = estimated intrinsic value per share D1 = expected dividend per share one year from now r = required rate of return (discount rate) g = expected long-term dividend growth rate
The elegance is real, but so are the friction points, particularly for bank stocks. Three structural features of the banking sector complicate any straightforward DDM application:
Not all ASX sectors are equally well suited to DDM application; the ASX sectors suited to DDM are those with regulatory constraints or mandated distribution requirements, principally banks, REITs, utilities, and infrastructure companies, whose predictable payout histories produce the stable dividend trajectories the formula depends on.
BOQ illustrates the challenge in sharp terms. Its trailing twelve-month return on equity sits at 1.66%, compared with a major bank sector average of 10.7% for the first half of 2026. When a firm earns below its cost of equity, standard DDM logic inverts: higher assumed growth actually destroys estimated value rather than adding it. BOQ’s CET1 of 11.18% provides capital headroom, but that buffer does not resolve the earnings gap.
The DDM remains a useful starting point and stress-test tool. It is not, however, a precise answer generator for banks earning well below their cost of equity.
Australian companies pay corporate tax before distributing profits to shareholders. Franking credits represent that pre-paid tax. When a company attaches franking credits to a dividend, eligible investors can offset those credits against their own tax liability, or receive the excess as a cash refund from the ATO.
The practical effect is that the cash dividend understates the economic value of the payment to a domestic investor. To capture the full value, the dividend must be “grossed up.”
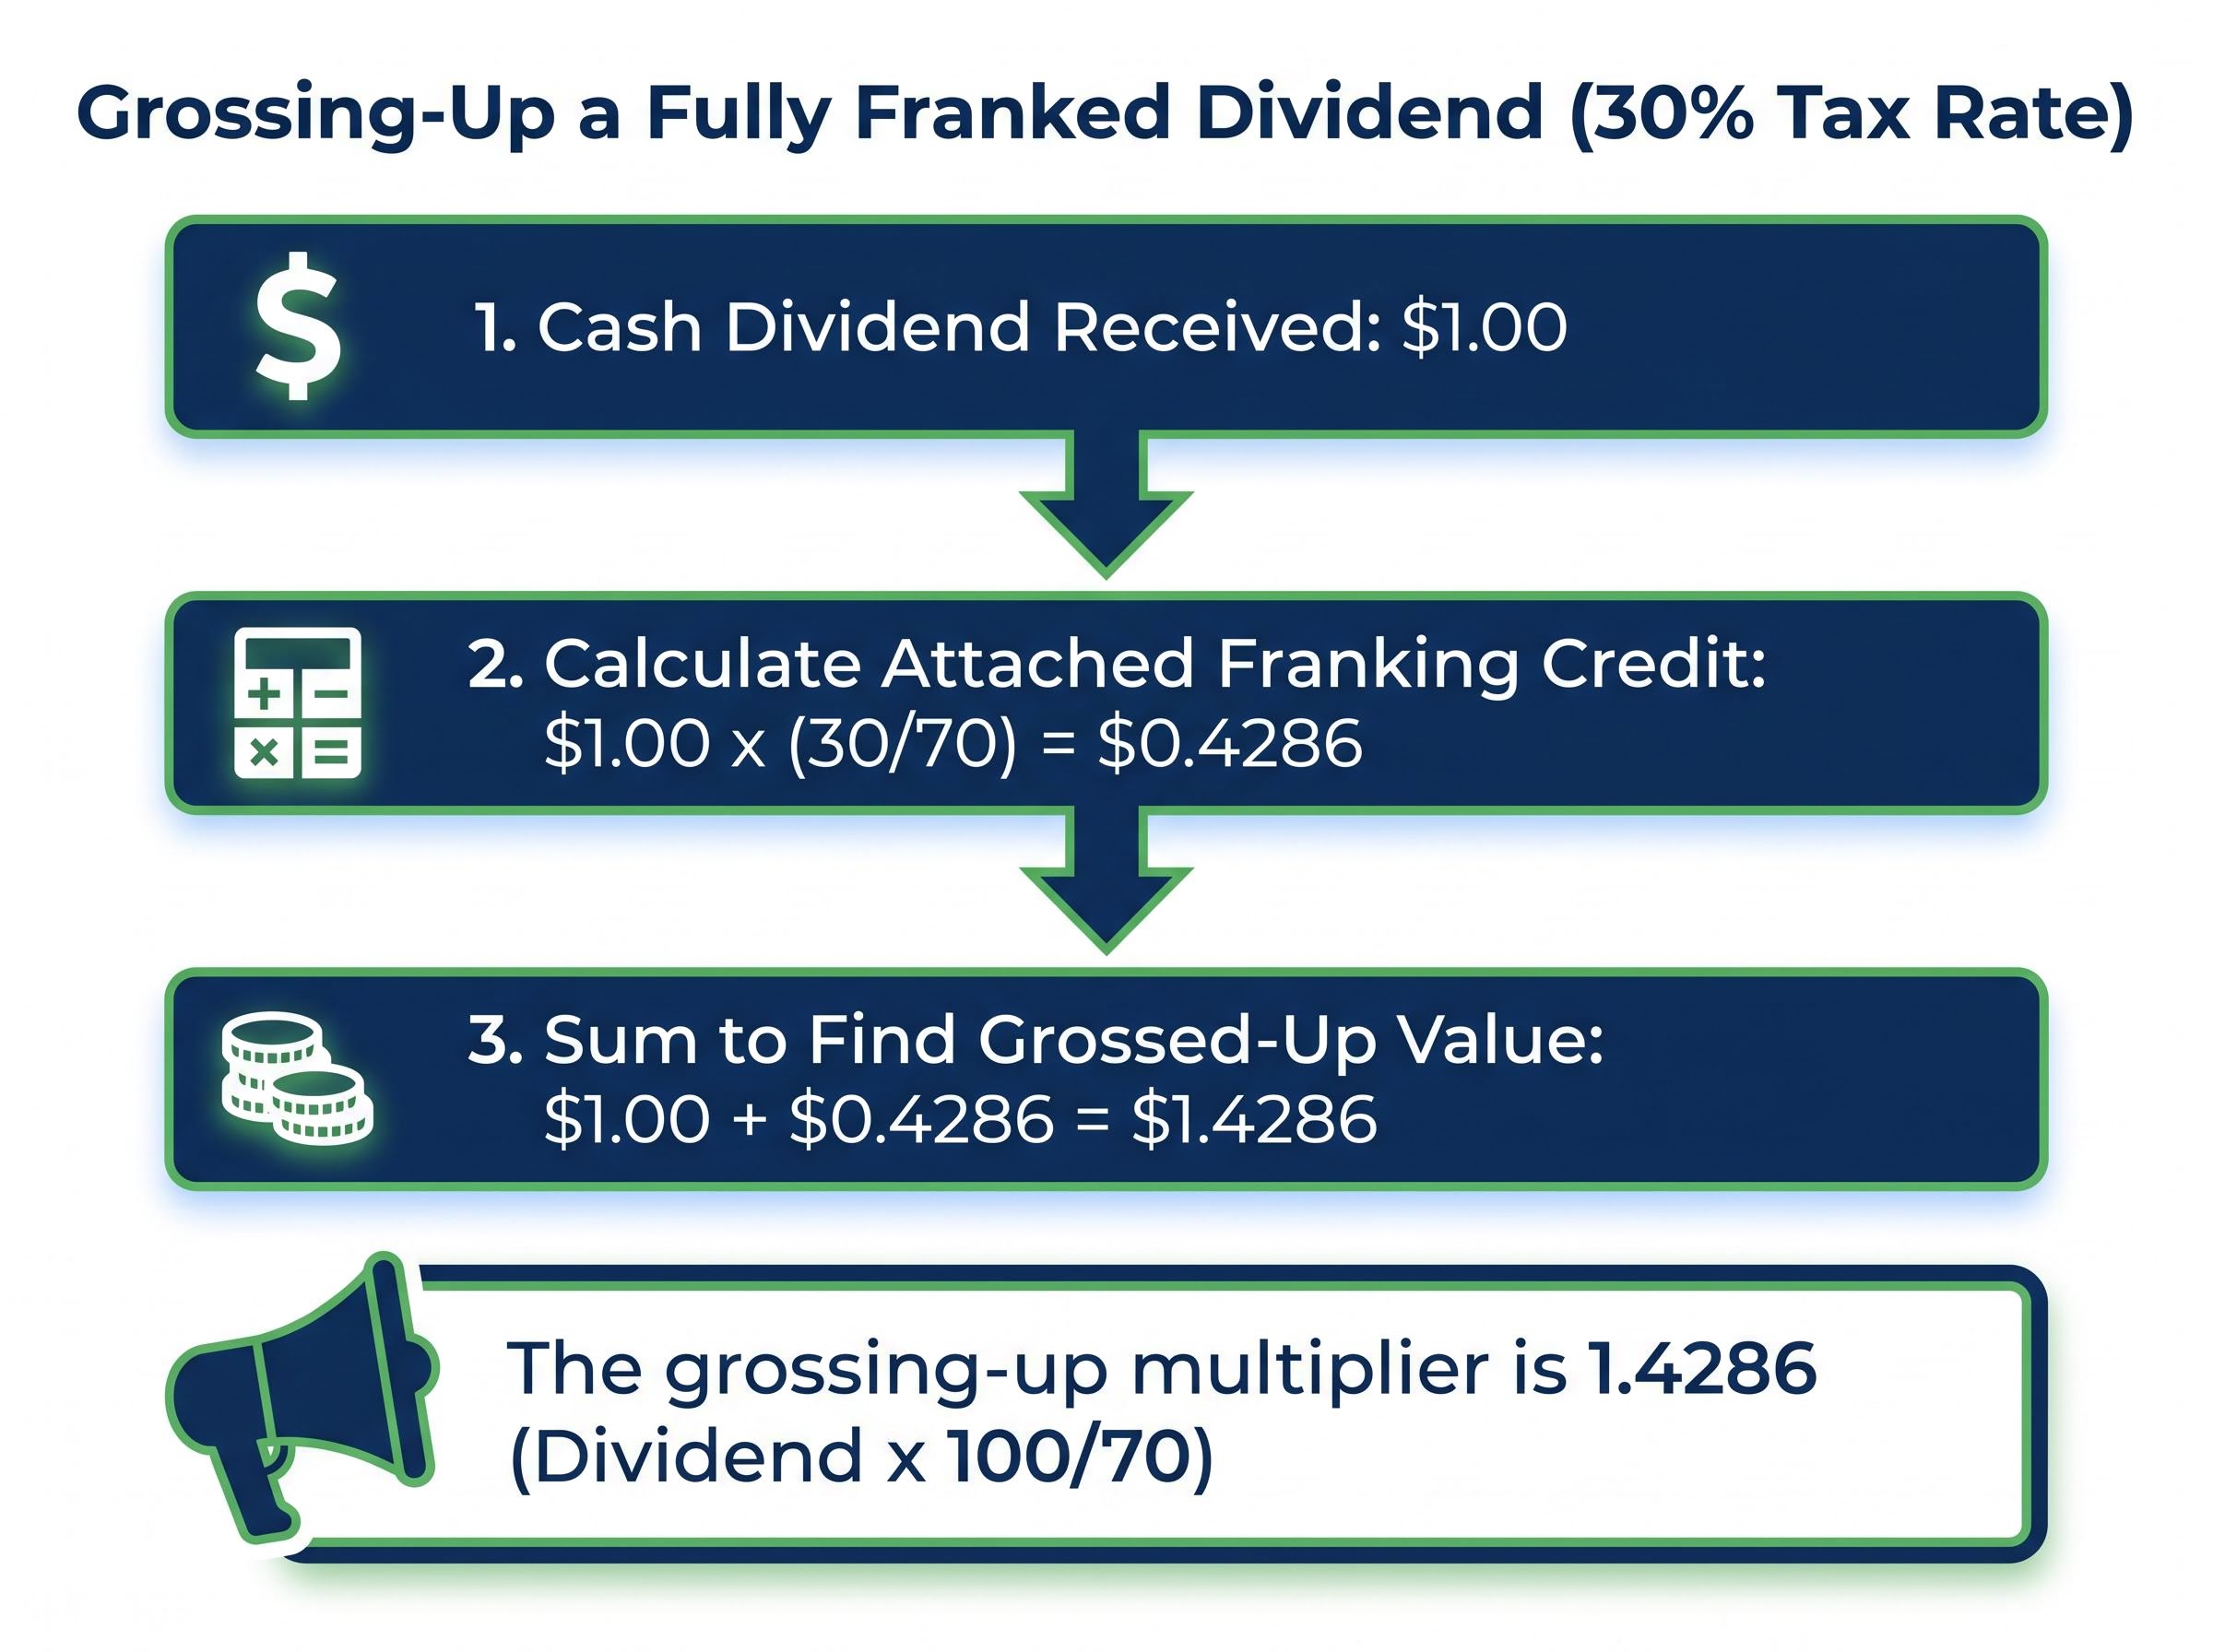
Franking Credit = Dividend x (30 / 70)
The grossing-up calculation at the current 30% corporate tax rate (confirmed for larger entities including banks as of May 2026, per Section 202-60(2) of the Income Tax Assessment Act 1997) follows three steps:
The grossing-up multiplier is therefore 1.4286 (Dividend x 100/70).
The value of those credits is not uniform across all investors, however.
The franking credit calculation follows the 30/70 formula described above, but the practical implications differ materially across investor types: a $1,000 fully franked dividend is worth $1,428.57 to an SMSF in pension phase once the ATO refunds the attached credit, while the same dividend delivers a smaller net benefit to an investor with a higher marginal tax rate.
| Investor type | Can use the franking credit? | Effective outcome |
|---|---|---|
| SMSF in pension phase | Yes, full refund | Zero tax on investment income; receives 100% of franking credit as cash refund |
| Individual below 30% marginal tax rate | Yes, partial refund | Franking credit exceeds tax liability; excess refunded by ATO |
| Foreign investor | No | Cannot use franking credits; cash dividend is the only relevant income stream |
This distinction matters for DDM construction. The “correct” discount rate depends on whose perspective the model adopts, a point that becomes directly relevant when selecting inputs later in this guide.
The same stock, valued three different ways, produces three materially different results. The divergence between those outputs is itself the argument for understanding input choices.
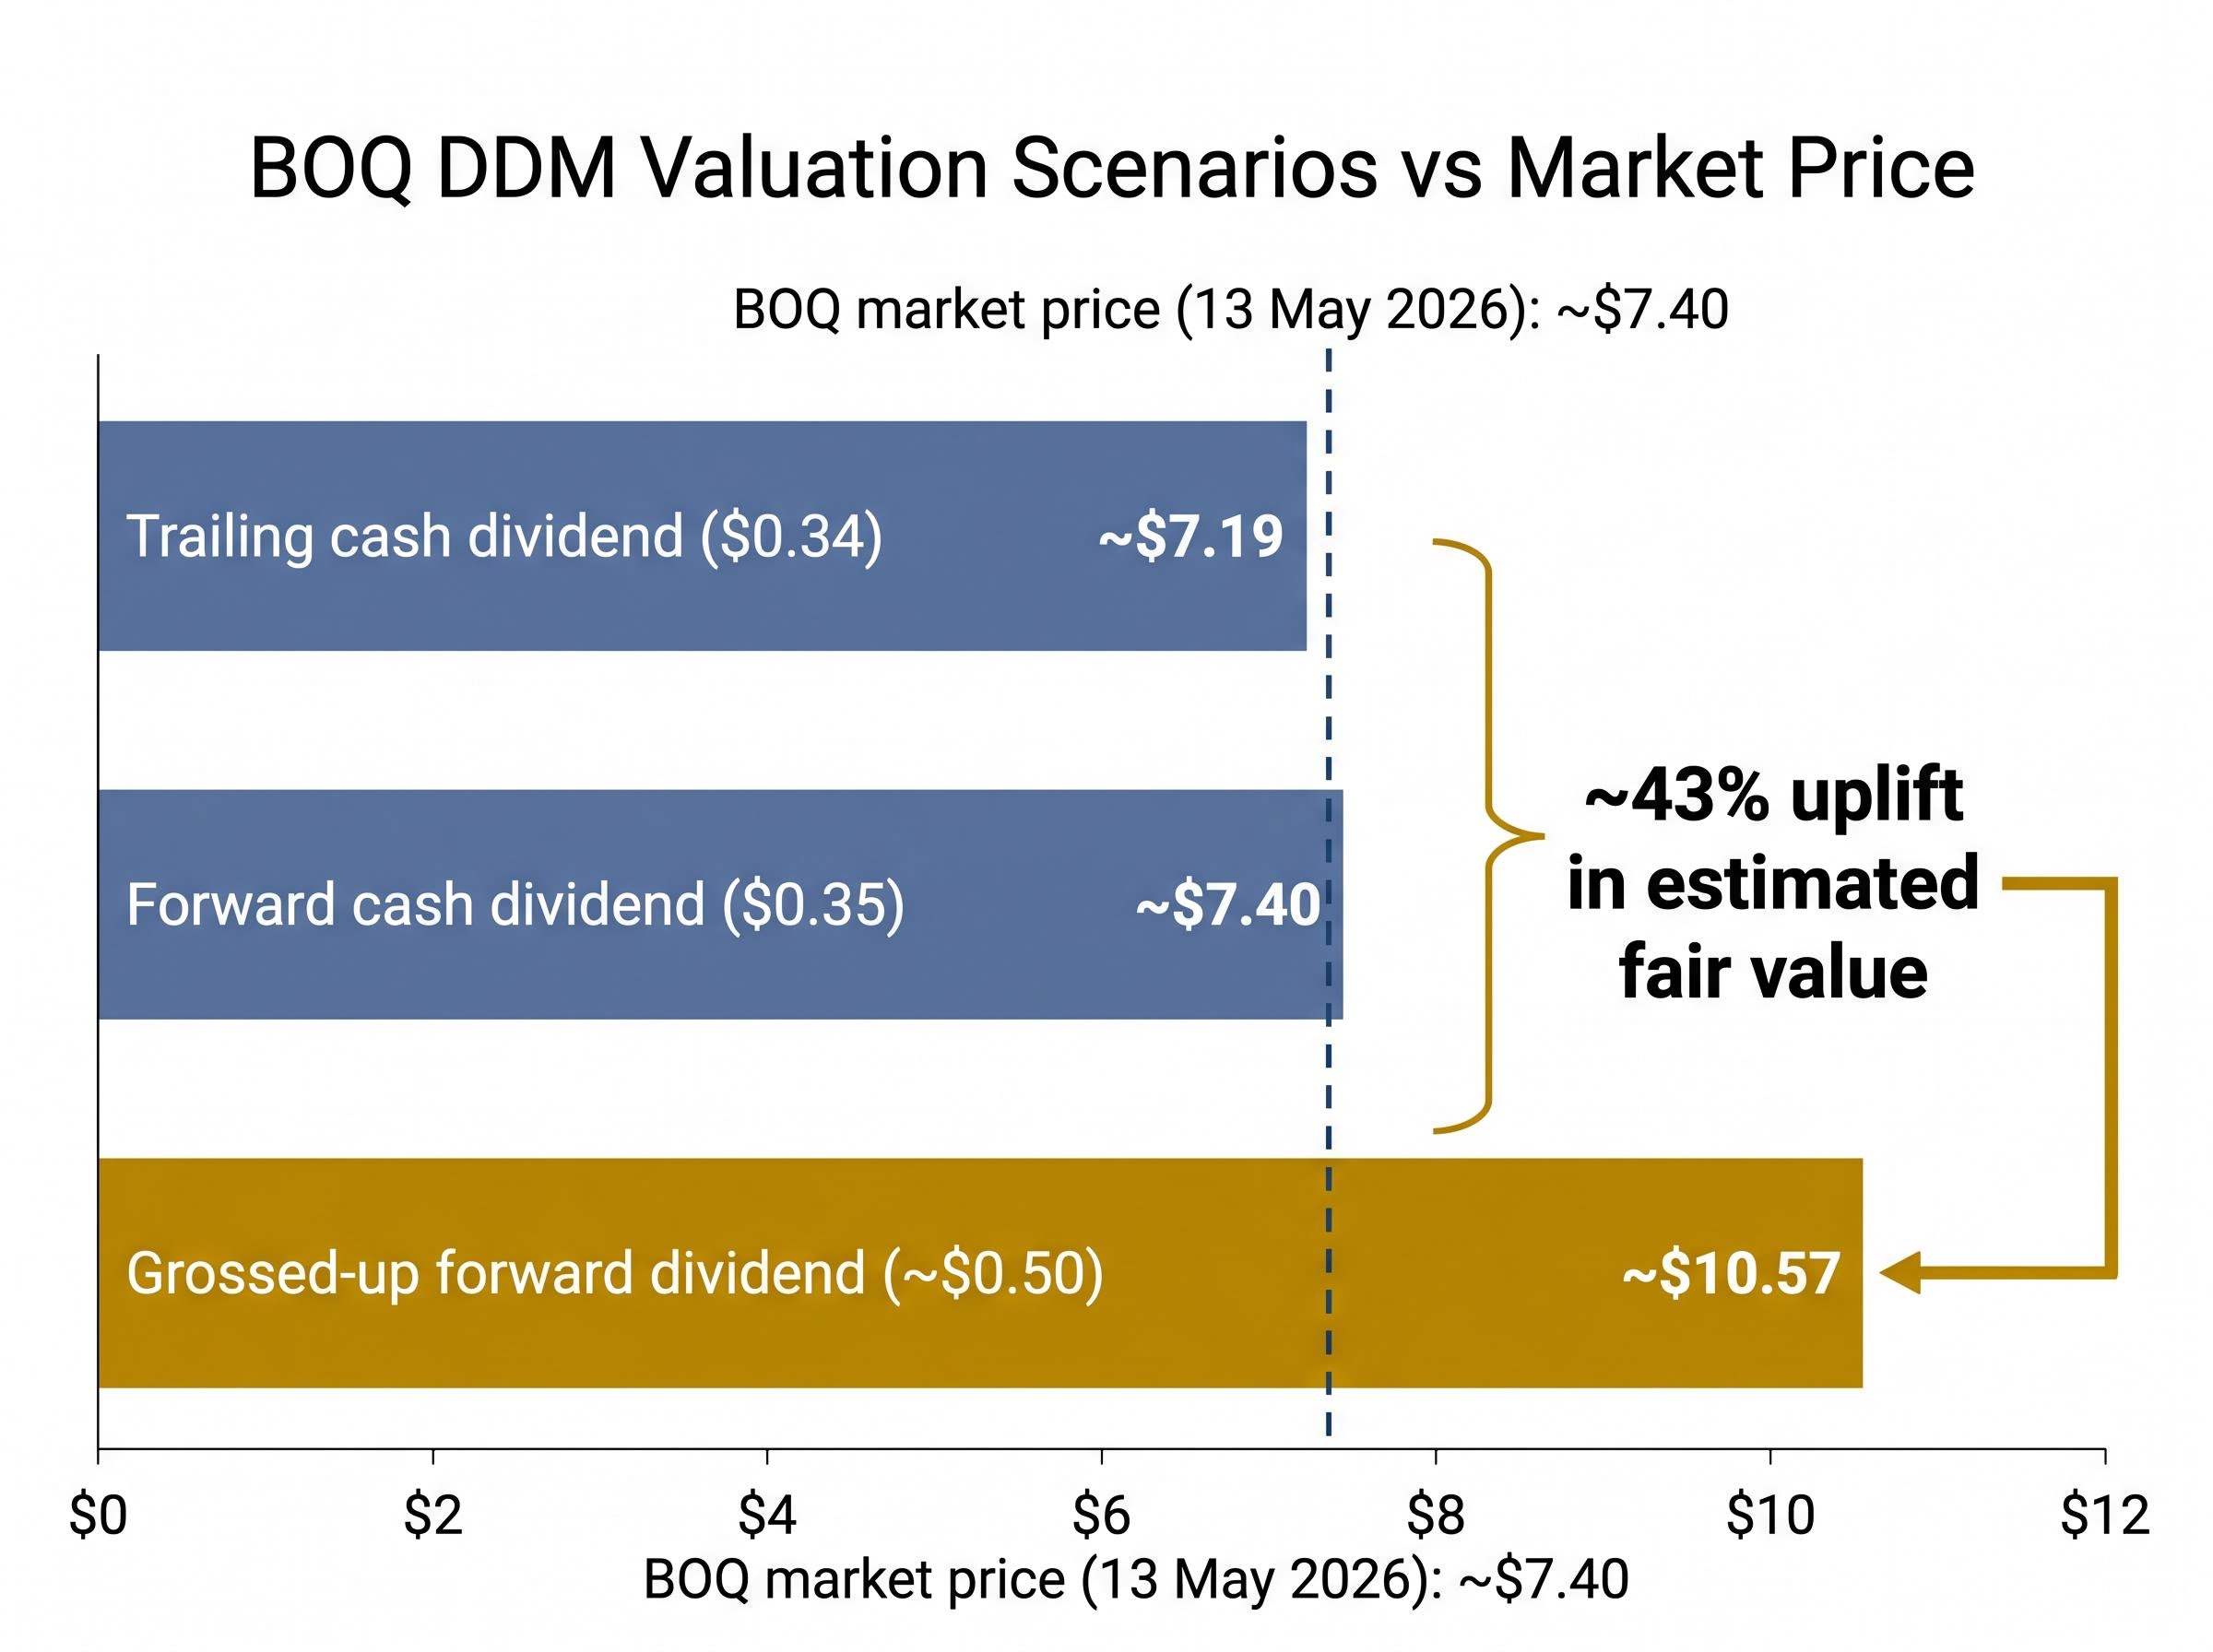
Method 1: Trailing cash dividend. Using BOQ’s trailing annual dividend of $0.34 per share, with growth assumptions of 2% to 4% and required return assumptions of 6% to 11%, the DDM sensitivity matrix produces an average output of approximately $7.19.
Method 2: Forward cash dividend. Using a forward dividend estimate of $0.35 per share under the same assumption ranges, the DDM output rises to approximately $7.40.
Method 3: Grossed-up forward dividend. Applying the franking credit grossing-up formula to the forward dividend: $0.35 x 1.4286 = approximately $0.50. Using this grossed-up figure as the dividend input, the DDM output rises to approximately $10.57.
Grossed-up equivalent of a $0.35 fully franked dividend: approximately $0.50
BOQ’s market price as of 13 May 2026 is approximately $7.40.
| Valuation method | Dividend input | DDM output | Comparison to $7.40 market price |
|---|---|---|---|
| Trailing cash dividend | $0.34 | ~$7.19 | Below market price |
| Forward cash dividend | $0.35 | ~$7.40 | Approximately at market price |
| Grossed-up forward dividend | ~$0.50 | ~$10.57 | ~43% above market price |
The franking credit adjustment is not a minor tweak. A 43% uplift in estimated fair value is a material difference that can determine whether a stock screens as undervalued or fairly valued. None of these outputs constitutes a buy signal or price target; each is a scenario-bound estimate whose validity depends entirely on the assumptions behind it.
A DDM sensitivity matrix is a grid that systematically varies the growth rate (g) across columns and the required return (r) down rows. The result is a map of estimated intrinsic values across a range of plausible assumptions.
Using the grossed-up forward dividend of approximately $0.50 as the base input, with growth rates of 2%, 3%, and 4%, and required returns from 7% to 11%, the matrix produces the following:
| Required return (r) | g = 2% | g = 3% | g = 4% |
|---|---|---|---|
| 7% | $10.00 | $12.50 | $16.67 |
| 8% | $8.33 | $10.00 | $12.50 |
| 9% | $7.14 | $8.33 | $10.00 |
| 10% | $6.25 | $7.14 | $8.33 |
| 11% | $5.56 | $6.25 | $7.14 |
The range spans from $5.56 to $16.67. That spread is not a flaw in the model. It is the insight.
The macro assumptions behind bank valuations, including variable-rate mortgage exposure, employment conditions, and property price trajectories, can shift DDM discount rate inputs by several percentage points without any arithmetic error, producing the wide valuation spreads visible in sensitivity matrices across the sector.
The denominator of the Gordon Growth Model (r – g) is where the sensitivity lives. At r = 7% and g = 3%, the denominator is 4%. Shift g to 5%, and the denominator halves to 2%, doubling the estimated value from a two-percentage-point change in a single input.
BOQ’s earnings profile amplifies this sensitivity. With an ROE of 1.66% against a cost of equity likely exceeding 8%, the bank earns well below the rate investors require. In this environment, higher growth assumptions do not improve the fundamental picture; they imply the bank is retaining capital to grow a business that destroys value on each incremental dollar deployed.
The current rate environment puts a practical floor on defensible discount rate inputs. With the Australian 10-year bond yield at 5.06% and the RBA cash rate at 4.35% (following the 5 May 2026 increase), a required return assumption below 6% for an ASX bank stock would be difficult to justify. This floor narrows the plausible range of the matrix and concentrates the most defensible outputs in its middle-to-lower rows.
The formula is mechanical. The judgment sits entirely in the inputs. Constructing a defensible required return starts with the risk-free rate and adds an equity risk premium.
The 10-year Australian government bond yield of 5.06% (as of 13 May 2026) serves as the risk-free rate baseline. In 2021, this figure was closer to 1.5%; the difference lifts the floor on any DDM discount rate by more than three percentage points relative to models built in that era.
Before setting a discount rate, four questions require answers:
The growth rate assumption requires equal care. Sustainable dividend growth cannot exceed a firm’s ROE multiplied by its retention ratio. At BOQ’s current ROE of 1.66%, this ceiling is very tight. A 4% growth assumption sits at the aggressive end for BOQ in its current earnings environment; 2% is more consistent with observable fundamentals.
Three signals suggest a growth rate assumption may be too aggressive for a given bank stock:
Input selection is a deliberate analytical choice about perspective, not a search for the “right” number. The sensitivity matrix exists precisely because reasonable investors will disagree on these inputs.
The three BOQ valuations, approximately $7.19 (trailing), $7.40 (forward), and $10.57 (grossed-up forward), against a market price of approximately $7.40, demonstrate that the model is a sensitivity lens, not a price oracle.
“A DDM output is not a price target. It is the price that would be fair if your assumptions are correct.”
| Valuation approach | Key input | Estimated intrinsic value |
|---|---|---|
| Trailing cash dividend DDM | $0.34 annual dividend | ~$7.19 |
| Forward cash dividend DDM | $0.35 forward estimate | ~$7.40 |
| Grossed-up forward dividend DDM | ~$0.50 (franking-adjusted) | ~$10.57 |
DDM should be cross-referenced with other valuation approaches. Price-to-book is commonly used alongside DDM for bank stocks. Factors outside the model’s scope also affect whether the assumptions underlying DDM inputs are likely to be realised: BOQ’s below-sector net interest margin of 1.56% (versus a sector average of 1.78%), its workplace culture score of 2.6 out of 5 (versus a sector benchmark of 3.1), and franchise model execution risk all sit beyond what the formula captures.
BOQ’s CET1 ratio of 11.18% provides capital headroom supporting near-term dividend continuity. Low ROE of 1.66%, however, limits the bank’s capacity to grow dividends materially without eroding that capital buffer, placing a practical constraint on the upper end of the sensitivity matrix.
The BOQ case study demonstrates the method. The following sequence makes it portable to any fully franked ASX dividend stock.
For companies taxed at 25%, the grossing-up multiplier changes to 1.3333 (Dividend x 100/75).
Current risk-free rate data can be found on the RBA website and the Australian Office of Financial Management. Forward dividend estimates are available through company investor relations pages and ASX announcements.
For investors wanting to apply the same DDM and PE ratio framework to a different regional bank, our dedicated guide to valuing ASX bank stocks uses Bendigo and Adelaide Bank as a live case study, walking through the grossed-up dividend calculation, PE-based cross-check, and the structural discounts that broker consensus targets tend to embed for smaller institutions.
The franking-adjusted DDM suggests BOQ may be trading near or below a plausible intrinsic value range under moderate assumptions. The wide sensitivity matrix spread, from $5.56 to $16.67 on grossed-up inputs alone, means this conclusion is highly input-dependent rather than robust.
The grossed-up DDM methodology is a legitimate and specifically Australian advantage for resident investors, particularly SMSFs in pension phase. It should be one input among several rather than a standalone buy signal.
The rate environment shapes every DDM built in 2026. With the 10-year bond yield at 5.06% and the RBA cash rate at 4.35%, the discount rate floor for bank stocks is materially higher than in the recent low-rate era. Investors who built DDM models in 2021 with lower required returns need to revisit those assumptions. BOQ’s ROE of 1.66% remains the single most important constraint on optimistic growth assumptions in the model.
Three conditions should prompt a revisit of any BOQ DDM inputs:
This article is for informational purposes only and should not be considered financial advice. Investors should conduct their own research and consult with financial professionals before making investment decisions. Past performance does not guarantee future results. Financial projections are subject to market conditions and various risk factors.
The Dividend Discount Model (DDM) estimates a stock's intrinsic value as the present value of all future dividends it will pay. In Australia, the model requires adjustment for franking credits attached to fully franked dividends, because those credits represent pre-paid corporate tax that eligible domestic investors can offset against their own tax liability, making the true income stream worth more than the cash dividend alone.
To gross up a fully franked dividend at the 30% corporate tax rate, multiply the cash dividend by 1.4286 (or divide by 0.70). For example, a $0.35 fully franked dividend grosses up to approximately $0.50, which is the figure used as the dividend input in a franking-adjusted DDM.
The wide range arises because the Gordon Growth Model divides the dividend by the difference between the required return (r) and the growth rate (g); small changes to either input cause large swings in the output. For instance, shifting the growth assumption by two percentage points can halve or double the denominator, producing valuations that vary by thousands of dollars per share across the matrix.
The RBA cash rate of 4.35% and the 10-year Australian government bond yield of 5.06% set the risk-free rate floor from which required return assumptions are built. Investors who constructed DDM models during the low-rate era of 2021 (when the bond yield was near 1.5%) need to revisit their discount rate inputs, as the higher rate environment materially raises the minimum defensible required return for bank stocks.
Self-managed superannuation funds (SMSFs) in pension phase receive the greatest benefit, as they pay zero tax on investment income and receive the full franking credit as a cash refund from the ATO, making the grossed-up dividend the relevant income stream for their DDM. Foreign investors, by contrast, cannot use franking credits and should base their DDM solely on the cash dividend.