
EOS Shares Jump 4% as MARSS Wins €102M Counter-Drone Deal
1 hr ago
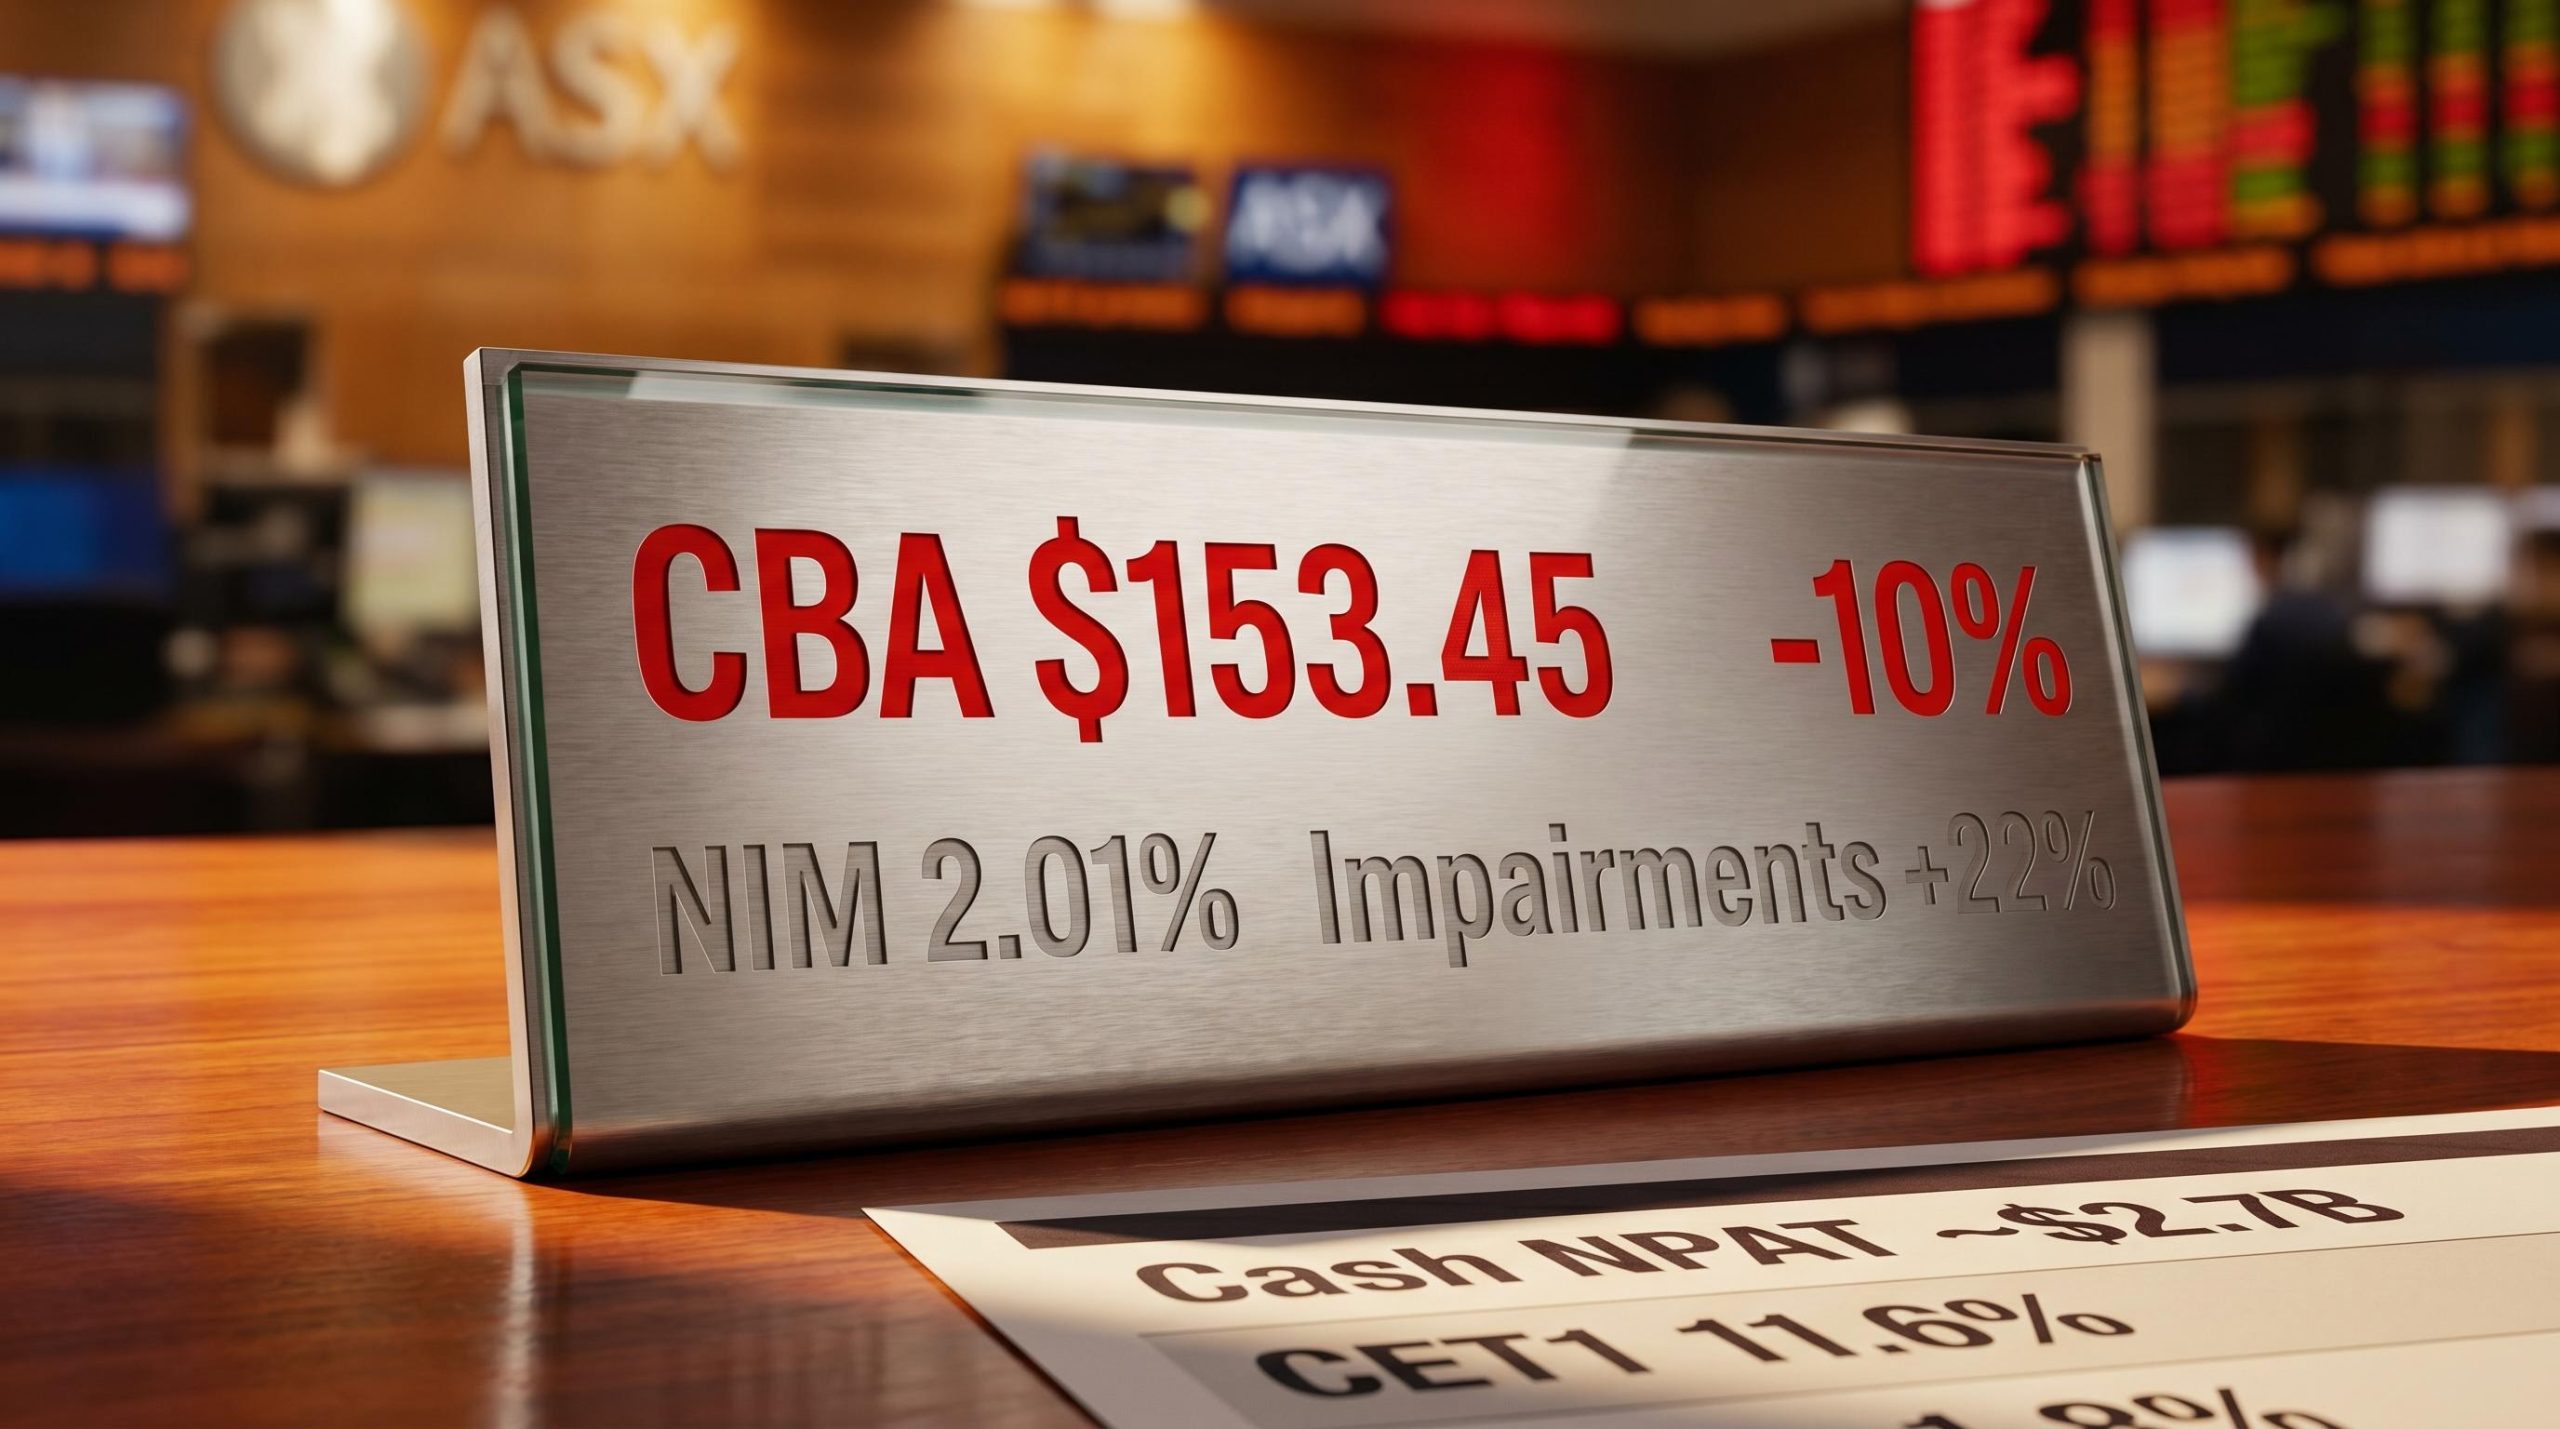
At 8:28 AM AEST on 13 May 2026, Commonwealth Bank of Australia released a quarterly trading update showing cash net profit after tax up 4% year on year. The headline looked reassuring. By 2:30 PM, CBA shares had fallen to a session low of $153.45, wiping roughly 10% off the stock in a single session and catching many observers off guard.
The speed of the repricing sat uncomfortably alongside the profit growth number. But a closer reading of the Q3 FY26 figures explains the disconnect: a net interest margin miss, a 22% quarterly jump in loan impairments, and rising mortgage arrears all arrived the morning after a Federal Budget carrying its own implications for bank margins. Each element was individually manageable. Together, they compounded into a sharp repricing of Australia’s largest bank by market capitalisation.
What follows separates the noise from the signal, walking through what the Q3 numbers actually show, why markets reacted as they did, and what the underlying financials suggest about CBA’s position heading into the second half of FY26.
The headline metrics, taken on their own, looked reasonable:
Revenue was flat for the quarter, with volume growth in lending and deposits offsetting the impact of two fewer calendar days in the period. Management described the underlying net interest margin (NIM) as broadly stable when excluding one-off positive factors.
Then came the reported NIM figure.
Net interest margin of 2.01% came in below H1 FY26’s 2.04% and below analyst expectations, making it the single most market-sensitive line in the update.
The gap between a 4% profit increase and a 3-basis-point NIM miss is precisely where investor disappointment originated. For a bank trading at a premium multiple, margin compression of that magnitude carries outsized significance, a point examined in detail in the NIM section below.
The $316 million loan impairment expense, up 22% quarter on quarter, was the most significant qualitative signal in the update beyond the NIM miss. It was not the absolute figure that alarmed markets so much as the trajectory and the provisioning stance that accompanied it.
Credit impairment charges have become the defining disclosure risk across the major banks in 2026, with NAB’s $706 million pre-results charge in April demonstrating how a single provisioning announcement can trigger a multi-percent single-day decline before the full results are even published.
Management increased the forward-looking component of collective provisions by $200 million, citing revised macroeconomic forecasts and greater weighting on downside scenarios. The stated drivers included elevated energy prices, interest rates, and supply chain disruptions placing pressure on both households and businesses.
The arrears data reinforced the direction of travel.
| Metric | Q3 FY26 | Prior period | Direction |
|---|---|---|---|
| Mortgage arrears | 1.12% | 0.98% (H1 FY26) | Up 14 basis points |
| Personal loan arrears | Rose 30 basis points | H1 FY26 level | Up |
| Loan impairment expense | $316 million | Prior quarter | Up 22% |
| Collective provision increase | $200 million | N/A | New forward-looking overlay |
Mortgage arrears at 1.12% now sit above the sector average of approximately 1.0%, and consumer and corporate troublesome exposures both increased during the quarter.
APRA’s quarterly ADI statistics, which placed sector non-performing loans at 0.99% as of December 2025, provide the benchmark against which CBA’s reported mortgage arrears of 1.12% in Q3 FY26 can be assessed, confirming that CBA’s arrears rate now sits above the sector average.
CBA’s management characterised underlying portfolio credit quality as intact, noting that actual losses remained low relative to the provision build. The bank framed the $200 million overlay as a prudent response to uncertain conditions rather than evidence of emerging stress.
There is a tension in that message. A bank does not add $200 million in forward-looking provisions because conditions are comfortable. The overlay signals that CBA’s own internal models, when tilted toward downside scenarios, produce a meaningfully worse credit outcome than the base case. Whether that caution proves prescient or conservative will only become clear over the next two quarters.
Net interest margin is the difference between the interest rate a bank earns on its loans and the rate it pays on deposits and wholesale funding, expressed as a percentage of average earning assets. It is, in practical terms, the spread a bank captures on every dollar it lends.
The calculation works in three steps:
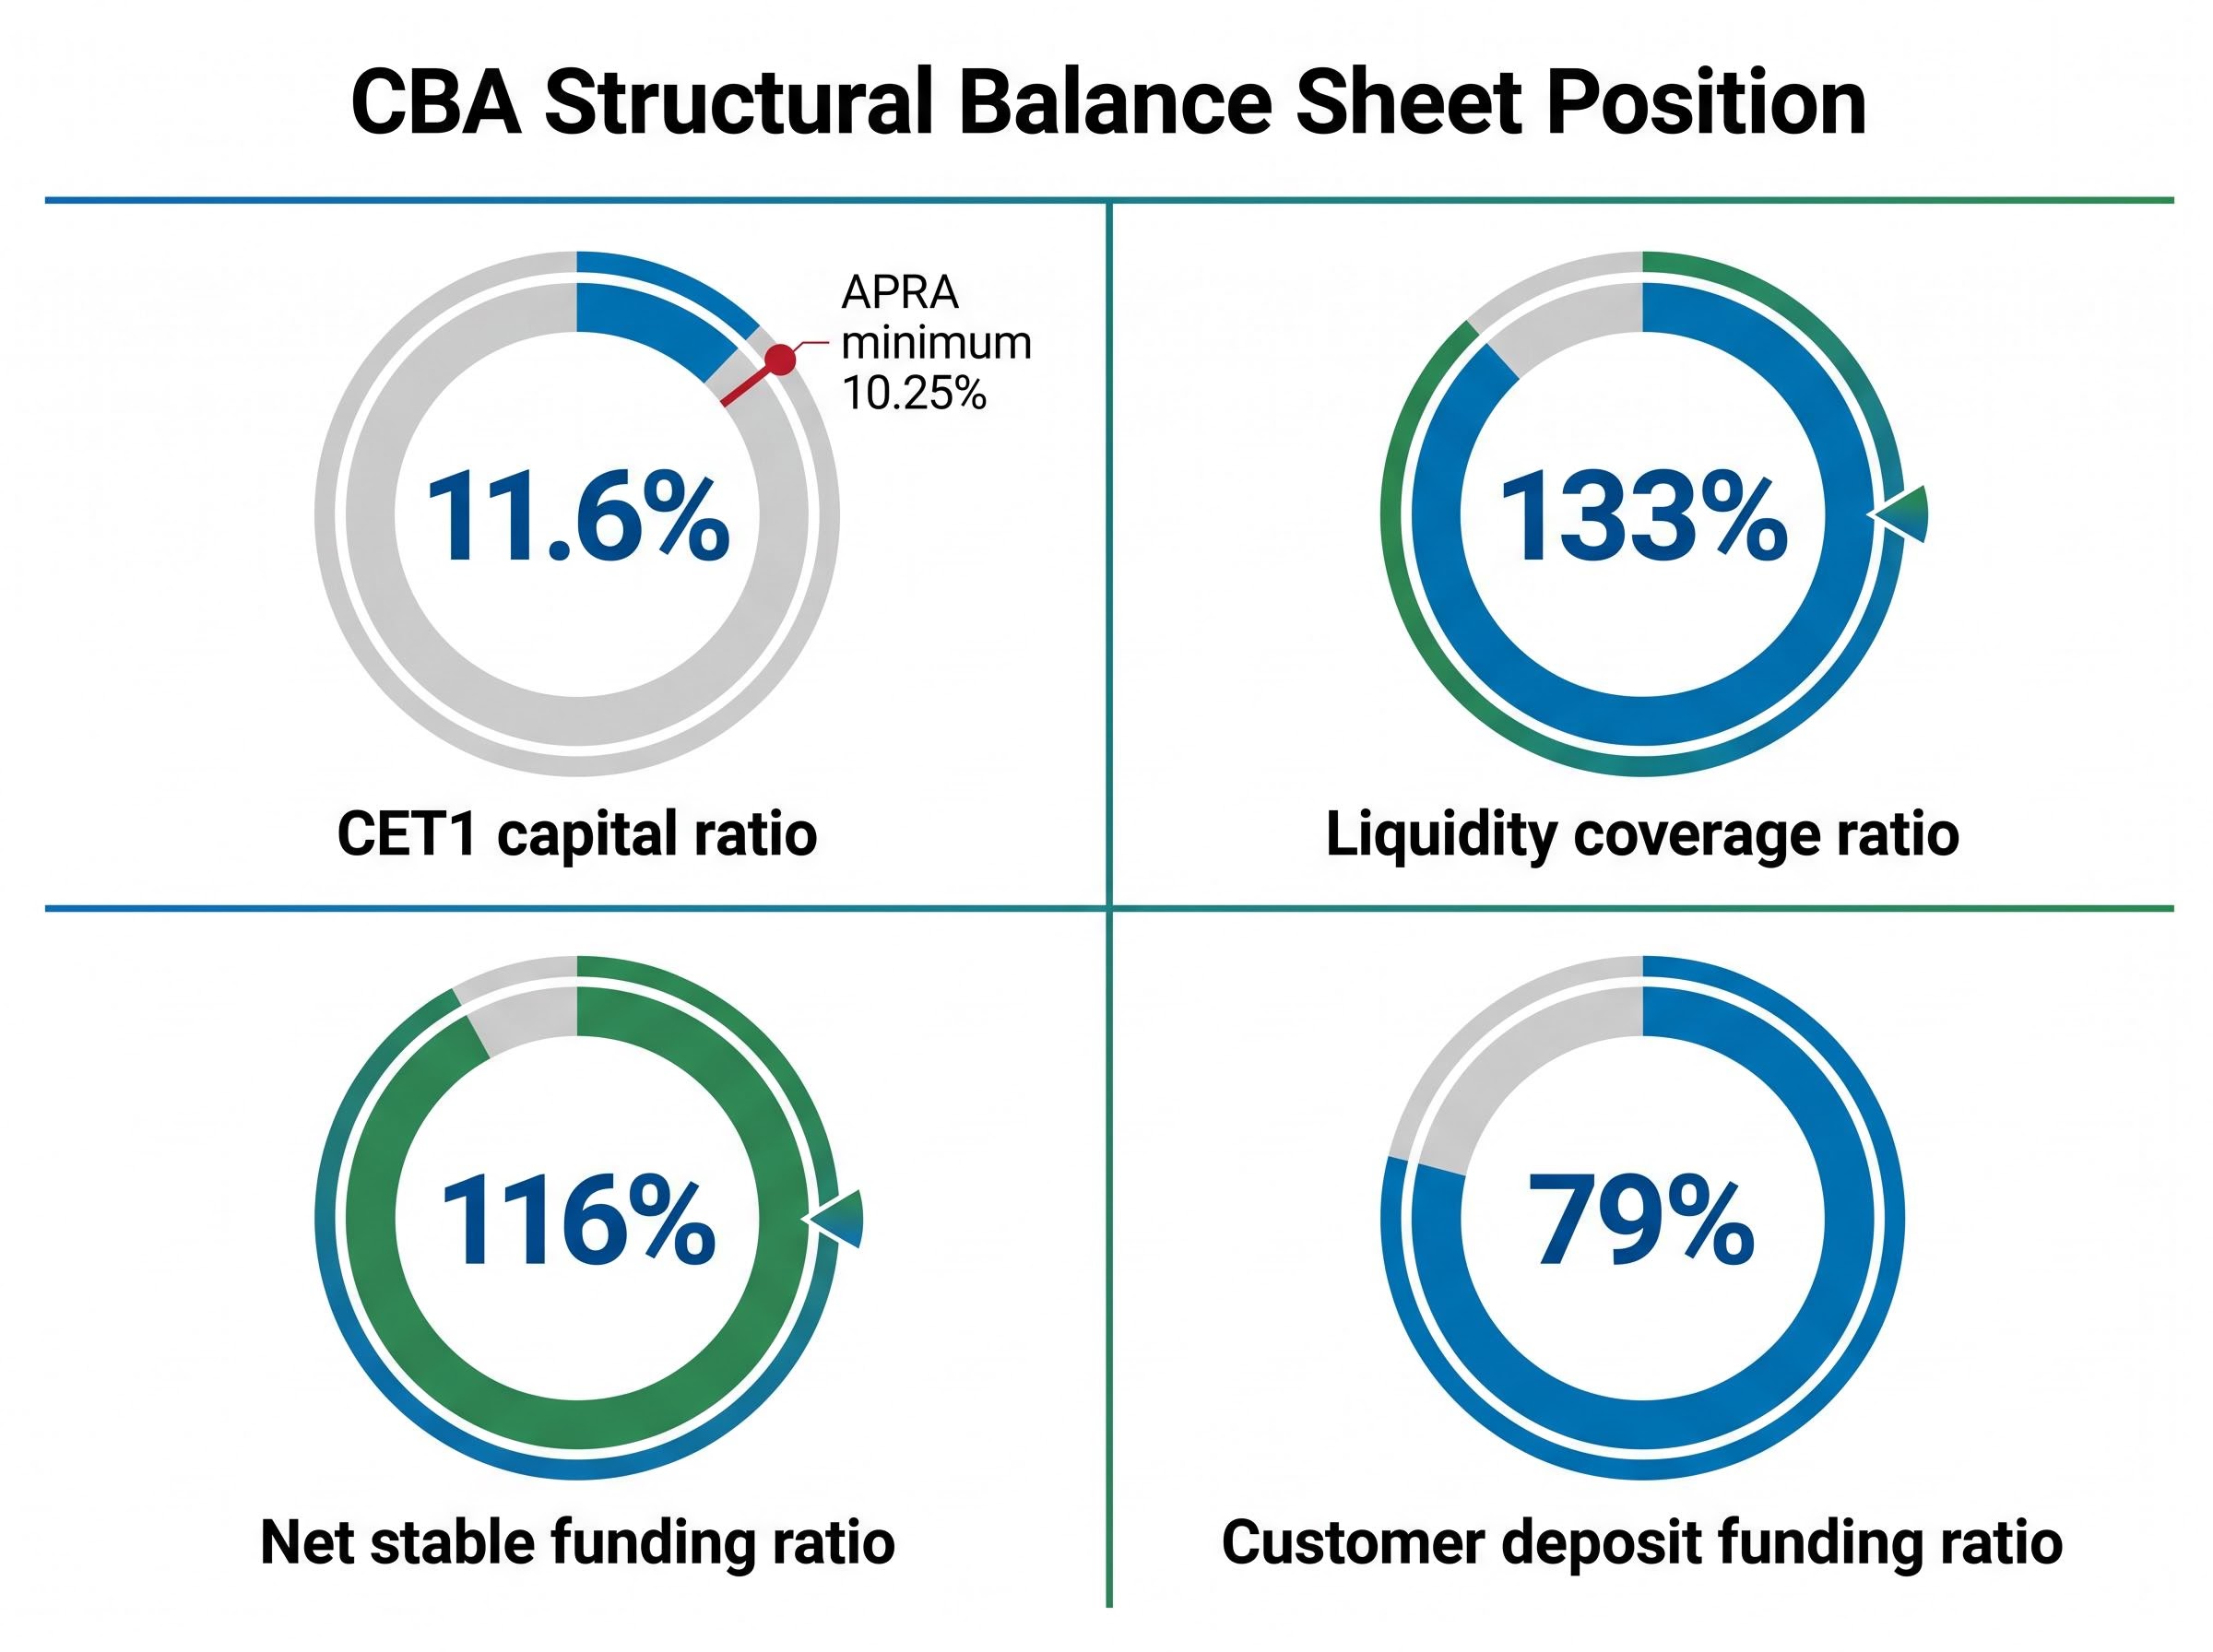
Competitive pressure in Australian mortgage and business lending, elevated wholesale funding costs, and two RBA rate hikes since early 2026 have made NIM management structurally harder for all major banks. The RBA cash rate stands at 4.35% following a 0.25 percentage point increase effective 6 May 2026, and headline CPI remains sticky at 4.6% year on year (March 2026 data). CBA’s customer deposit funding ratio of 79% at quarter end provides some insulation from wholesale markets, but deposit competition has intensified.
The RBA’s May 2026 cash rate decision, which held the target at 4.35% while citing persistent inflation and ongoing uncertainty in the global outlook, established the monetary policy backdrop that made NIM recovery structurally difficult for Australian banks heading into the second half of FY26.
Each basis point of NIM movement across CBA’s approximately $600 billion loan book translates to roughly $60 million in annualised pre-tax earnings.
A 3-basis-point miss against expectations therefore represents approximately $180 million in annualised earnings at risk. For a stock priced for near-perfect execution, that arithmetic is sufficient to trigger a material repricing.
The Federal Budget, announced at 7:30 PM AEST on 12 May 2026, landed less than thirteen hours before CBA’s trading update. The timing meant markets were already recalibrating margin expectations before the NIM miss was confirmed.
The Budget measures most relevant to CBA included:
While broadly positive for housing activity, analysts interpreted the mortgage relief measures as adding approximately 2 basis points of NIM pressure for major banks. JPMorgan noted the Budget “adds to impairment conservatism,” estimating a combined earnings drag of 5-7% when incorporating Budget effects alongside the provisioning increase.
The RBA’s 0.25 percentage point rate increase, effective 6 May 2026, arrived just one week before CBA’s results. Higher rates support lending margins in theory, but in practice the competitive dynamics of deposit repricing and wholesale funding costs have eroded that benefit for Australian banks throughout the tightening cycle.
The rate increase was the third consecutive tightening move from a starting point of 3.85% in January 2026, with eight of nine Board members voting for the hike and forward guidance language that preserved full optionality on whether a fourth increase follows at the July 2026 meeting.
Sticky inflation at 4.6% limits near-term expectations for an RBA pivot, which in turn constrains relief on funding costs. Unemployment at 4.3% (March 2026) and dwelling approvals running at an annualised pace of approximately 102,000 (down 2.1% month on month in the March quarter) paint a picture of an economy where household pressure is building gradually rather than arriving as a shock. For CBA, that translates to continued provisioning pressure with limited near-term catalysts for margin recovery.
The clearest evidence that 13 May was a CBA-specific event, not a sector-wide panic, sits in the peer comparison.
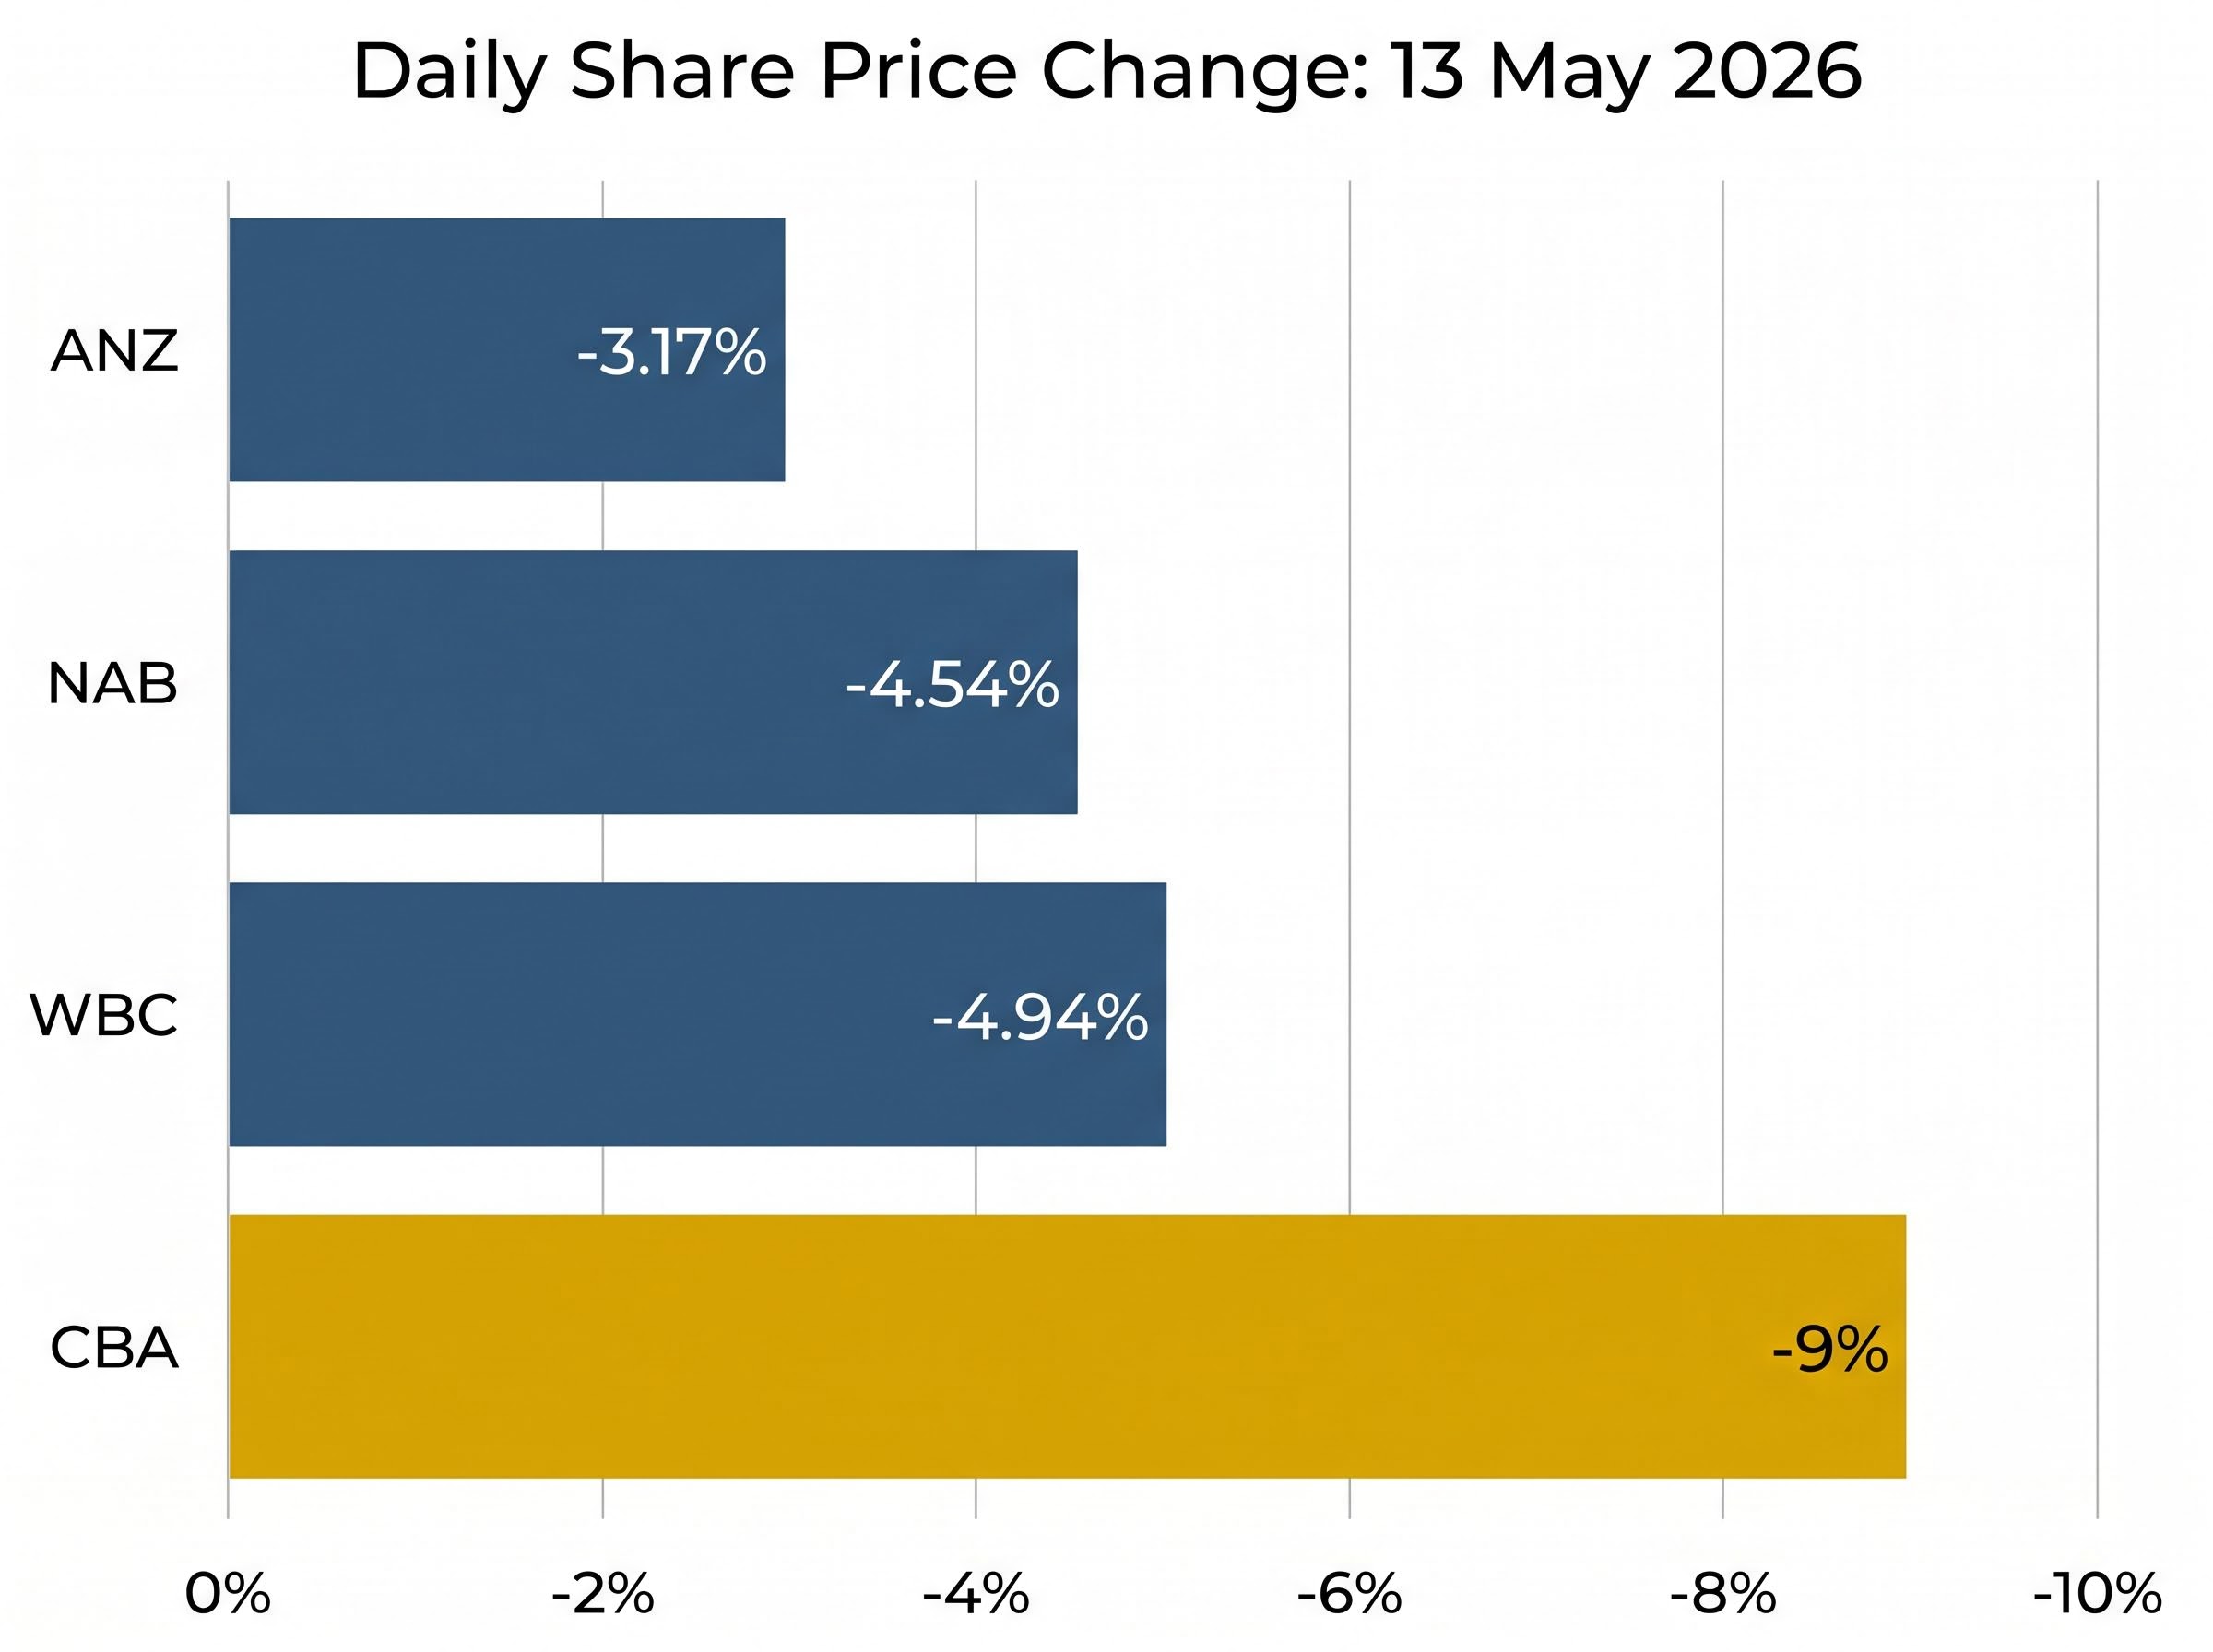
| Bank | Closing price (approx.) | Daily change | Analyst stance |
|---|---|---|---|
| CBA | ~$154 | -8% to -10% | JPMorgan: Neutral ($165); UBS: Sell ($150); Macquarie: Sell ($117) |
| ANZ | ~$35.01-$35.14 | -3.17% | Mild sector pressure |
| NAB | ~$37.42 | -4.54% | Mild sector pressure |
| WBC | ~$35.77 | -4.94% | Mild sector pressure |
CBA carries approximately 25% weighting in the ASX financials index, making its decline the dominant driver of the sector’s overall fall. But the differential is what matters: ANZ, NAB, and Westpac each fell 3-5%, reflecting broader sector softness. CBA fell roughly double to triple that range.
JPMorgan downgraded CBA to Neutral from Overweight, cutting its price target to $165 from $178, characterising the sell-off as “justified but oversold.” UBS maintained its Sell rating at $150. Macquarie held its Sell at $117.
The divergence between price and analyst consensus is sharper than a single session’s repricing suggests: consensus sell ratings across all 14 covering analysts, with an average 12-month price target implying approximately 20% further downside from post-sell-off levels, indicate that markets had been pricing in assumptions that the Q3 update has begun to unwind.
Bell Potter’s Henry Jennings argued the approximately 10% drop “embeds too much negativity” and recommended buying on weakness.
When a stock falls two to three times as much as its direct sector peers on the same day, the market is making a specific judgment about that company’s outlook. That distinction matters for investors deciding whether to hold, trim, or add.
After four sections building a case for warranted concern, it is worth examining what the single-day price move does not change: CBA’s structural balance sheet position.
CBA distributed $3.9 billion in dividends during the quarter, reaching more than 800,000 direct shareholders and over 14 million Australians via superannuation. The interim dividend of $2.15 per share reflects a payout ratio of approximately 70%, and the stock offers an estimated dividend yield of approximately 3.2% at post-sell-off prices.
CBA’s premium price-to-earnings multiple relative to ANZ, NAB, and Westpac means the market prices in near-flawless execution. Any shortfall on NIM or credit quality triggers amplified repricing precisely because expectations are set higher.
CBA’s valuation premium relative to ANZ, NAB, and Westpac reflects a market judgement that its higher return on equity and superior NIM justify a 27-29x earnings multiple; the Q3 update is the first material test of whether that premium can be sustained as margins compress and provisions rise.
Over the prior year to May 2026, CBA shares had risen approximately 15% from around $141, while the ASX 200 gained approximately 20% over the same period. Even before the 13 May sell-off, CBA was underperforming the broader index on a relative basis. At approximately $154, the stock still carries a valuation premium that demands continued margin delivery; the Q3 update suggested that delivery has become harder.
The bear case and the bull case both find support in the data.
Bear case:
Bull case:
Analyst price targets on 13 May 2026 ranged from $117 (Macquarie, Sell) to $165 (JPMorgan, Neutral), reflecting genuine disagreement about the severity of the impairment cycle.
Magellan indicated it was trimming its CBA position. Hyperion’s Tim Samway characterised the move as “CBA-specific,” noting peers remained resilient. The divergence between a $117 bear target and a $165 neutral target captures the uncertainty investors must sit with until more data arrives. Two dates will begin to resolve it: the RBA’s next scheduled review on 3 June 2026 and CBA’s full-year FY26 results, which will show whether Q3 impairments represent a trend or a one-quarter spike.
The sell-off was not irrational. A 3-basis-point NIM miss and a 22% impairment spike, arriving the morning after a margin-compressive Budget, justified a repricing of a stock trading at a premium multiple. But NIM compression and rising provisioning do not, on their own, signal structural deterioration in CBA’s franchise. The bank’s CET1 ratio, liquidity buffers, and 79% deposit funding base remain among the strongest in Australian banking.
For long-term holders, three forward-looking data points will determine whether the market’s bearish reading holds:
At approximately $154, CBA offers an estimated 3.2% dividend yield and a five-year compound annual growth rate of approximately 8%. The 13 May sell-off is best understood as a valuation reset triggered by a genuine but so-far moderate deterioration in two key metrics, not as a signal that the bank’s fundamental earnings power is impaired. The data over the next two quarters will determine which reading proves correct.
This article is for informational purposes only and should not be considered financial advice. Investors should conduct their own research and consult with financial professionals before making investment decisions. Past performance does not guarantee future results. Financial projections are subject to market conditions and various risk factors.
Net interest margin is the spread between the interest rate a bank earns on its loans and the rate it pays on deposits and funding, expressed as a percentage of earning assets. For CBA, each basis point of NIM movement across its roughly $600 billion loan book translates to approximately $60 million in annualised pre-tax earnings, so even a small miss can trigger a sharp share price reaction.
CBA fell roughly 8-10% on 13 May 2026 while peers ANZ, NAB, and Westpac each fell 3-5%, reflecting that the sell-off was CBA-specific rather than a sector-wide panic. CBA trades at a premium earnings multiple that prices in near-perfect execution, so its NIM miss and 22% impairment spike triggered an amplified repricing compared to peers with lower valuation expectations.
CBA reported a loan impairment expense of $316 million in Q3 FY26, up 22% quarter on quarter, and added a $200 million forward-looking provision overlay citing revised macroeconomic forecasts. Mortgage arrears rose to 1.12%, up 14 basis points from H1 FY26 and above the sector average of approximately 1.0%.
At approximately $154 following the 13 May 2026 sell-off, CBA offers an estimated dividend yield of approximately 3.2%, based on an interim dividend of $2.15 per share and a payout ratio of approximately 70%.
Three key data points will shape the CBA outlook: the RBA's next scheduled cash rate review on 3 June 2026, which could ease or intensify funding cost pressure; the full-year FY26 credit impairment total, which will clarify whether Q3's $316 million figure was a one-quarter spike or a new run rate; and the Q1 FY27 net interest margin, which will show whether margin compression has stabilised or is accelerating.