Just six technology companies now command a combined market capitalisation exceeding $12 trillion. This extraordinary scale means that high index concentration is no longer a theoretical risk for passive investors. It is the defining feature of modern equity markets. Heading into the late April 2026 earnings window, this top-heavy structure is colliding with shifting macroeconomic factors and elevated geopolitical risks.
These major corporate disclosures arrive at a precarious moment for global markets. Investors are increasingly questioning whether the structural design of popular retirement vehicles actually provides the safety they advertise. When a handful of technology giants dictate the direction of entire market sectors, traditional risk assessment models begin to break down.
This article unpacks the underlying mechanics of how a few mega-cap stocks can functionally hijack broader benchmark volatility. By examining capitalisation rules, infrastructure spending, and derivative pricing, investors can better understand the systemic risks embedded in their passive portfolios.
How Capitalisation Weighting Amplifies Single-Stock Movements
Passive investing relies on a fundamental mathematical rule that inadvertently creates systemic vulnerabilities. In market-capitalisation weighted benchmarks like the S&P 500 and the Nasdaq 100, a company’s influence is strictly determined by its total market value. When a handful of corporations achieve unprecedented valuations, they absorb a disproportionate share of every passive dollar deployed into the market.
A foundational Federal Reserve working paper demonstrates how this structural migration toward index tracking alters baseline liquidity profiles and potentially amplifies volatility during market shocks.
This structural reality prevents investors from viewing broad index funds as truly diversified portfolios. As of late April 2026, the top six technology firms account for approximately 30.41% of the total S&P 500 weighting. This massive consolidation severely limits the influence of the remaining 494 companies in the benchmark.
An investor purchasing a standard index fund is effectively making a highly concentrated bet on a specific technological ecosystem. The diversification benefits of holding hundreds of different companies are mathematically overridden by the sheer mass of the market leaders.
| Company | S&P 500 Weighting | Estimated Market Cap |
|---|---|---|
| Microsoft | 7.06% | According to market data, ~$3.0T |
| Apple | 6.72% | ~$3.2T |
| NVIDIA | 6.34% | ~$3.5T |
| Alphabet | 4.19% | According to market data, ~$2.0T |
| Amazon | 3.70% | According to market data, ~$1.9T |
| Meta Platforms | 2.40% | According to market data, ~$1.3T |
This imbalance has tangible consequences for overall market performance. During the first quarter of 2026, the broader S&P 500 experienced a decline of 4.3% to 4.6%. The underlying strength of these core technology stocks prevented a much steeper correction.
These mega-caps effectively anchored the overall benchmark while the majority of constituent companies suffered far deeper losses. Understanding these foundational mechanics is critical for diagnosing portfolio risk in the current market environment. The collective weight of these specific equities means that any significant disruption to their business models immediately becomes a systemic issue for the broader market.
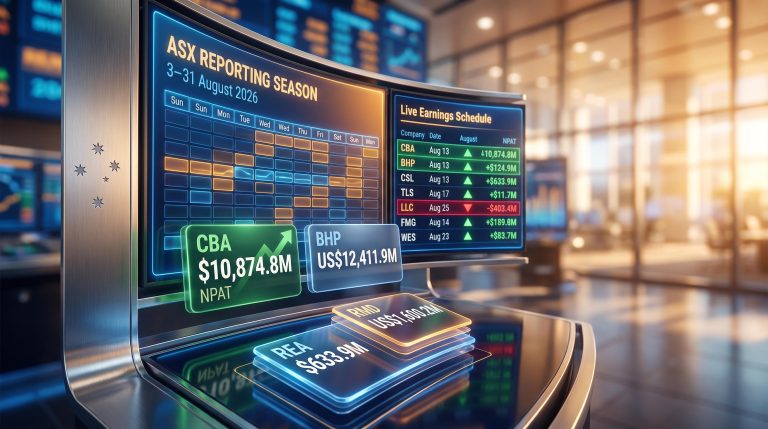
When big ASX news breaks, our subscribers know first
The Infrastructure Spending Boom as a Systemic Catalyst
The mathematical vulnerability of cap-weighted indices is currently being tested by an unprecedented wave of corporate spending. An ongoing artificial intelligence capital expenditure boom is serving as the central catalyst for current technology valuations. These companies are building out massive digital infrastructure networks to support generative algorithms and advanced cloud computing capabilities.
However, financial analysts are expressing growing skepticism regarding the timeline for actual return on investment from these ambitious projects. The scale of the spending is historic, yet the immediate revenue generation remains highly speculative.
Past performance does not guarantee future results, and these financial projections are subject to market conditions and various risk factors.
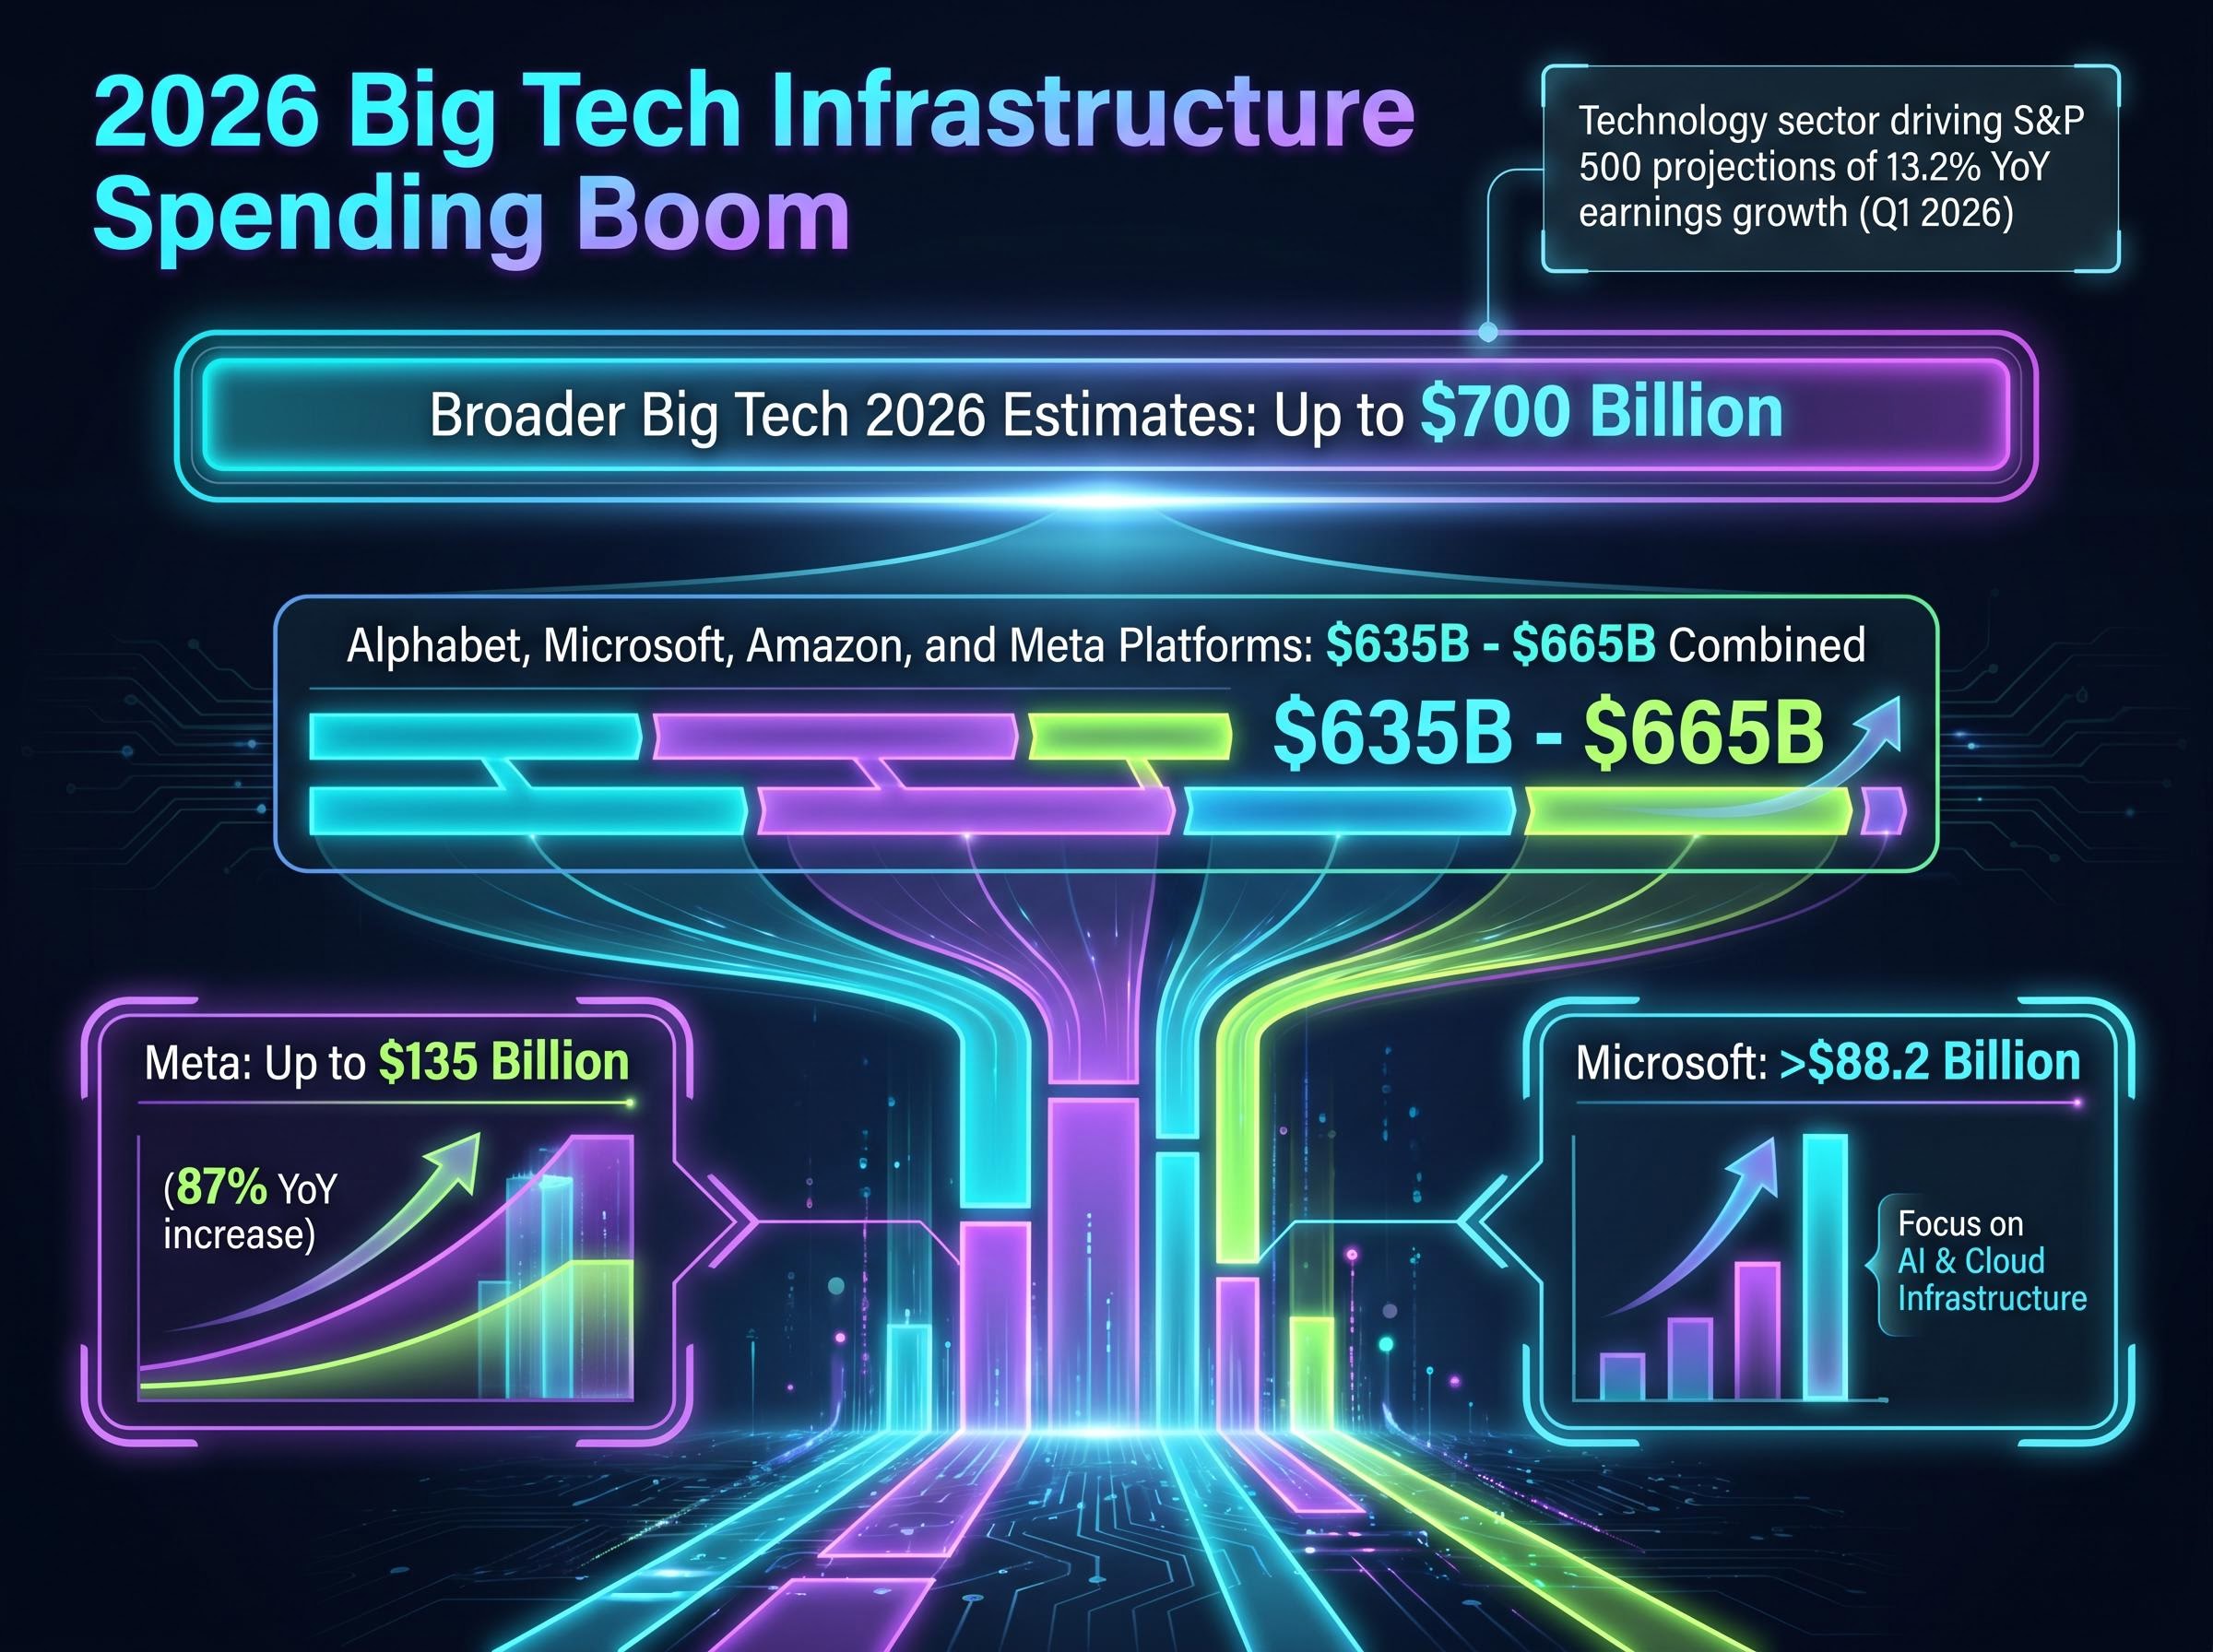
The specific spending estimates for fiscal 2026 highlight the sheer magnitude of this infrastructure build-out:
Alphabet, Microsoft, Amazon, and Meta Platforms are projected to spend a combined $635 billion to $665 billion on digital infrastructure. Broader Big Tech capital expenditure estimates reach up to $700 billion for the calendar year. Meta is projecting spending of up to $135 billion, representing an enormous 87% year-over-year increase. Microsoft is projected to exceed $88.2 billion in direct capital allocations.
These historic investment levels are artificially inflating broader benchmark earnings projections. The technology sector is almost single-handedly driving overall S&P 500 projections of 13.2% year-over-year earnings growth for the first quarter of 2026. This overwhelming sectoral growth effectively masks underlying fundamental weakness in traditional industrial, consumer, and financial sectors.
This massive wave of AI capital expenditure directly benefits hardware manufacturers, creating a dynamic where the cloud services growth timeline dictates near-term semiconductor valuations.
This shift from structural theory to immediate financial reality reveals exactly what could trigger a massive market correction. If these enormous infrastructure bets fail to materialise into sustainable revenue streams, the resulting valuation collapse would drag down the entire index. The concentration of capital expenditure among just a few entities makes the broader equity market exceptionally vulnerable to a single thematic failure.
Decoding Implied Volatility and the Options Market Cascade
The vulnerability of these major technology firms is most visible in the derivative markets, where professional traders hedge their exposure. Options contracts price in anticipated share price fluctuations immediately surrounding corporate earnings disclosures. By analysing these derivative premiums, investors can observe exactly how a tremor in one mega-cap stock translates into an earthquake for the broader market.
Heading into the April 30 reporting period, forward implied volatility sits in a highly elevated state. The macro-negative environment of late April 2026 has forced market makers to price in significant uncertainty across the technology sector.
This cautious derivatives pricing aligns with historical stock market reactions to sustained commodity spikes, where elevated fuel costs reliably pressure corporate earnings and prompt defensive posturing from institutional funds.
Wealth Strategist Outlook “Retail investors are largely unprepared for the mechanical shockwaves that occur when heavily weighted constituents miss earnings targets in a high-volatility environment.”
Single-stock options are currently predicting aggressive swings for individual technology giants. Microsoft is priced for a 6.8% swing upon its earnings release. Alphabet is priced for a 5.81% fluctuation, while Apple is braced for a 4.24% move.
Historical data provides important context for why these current volatility premiums are drawing institutional attention. According to market data, previous twelve-quarter averages show standard 6% moves for Amazon and 8.4% moves for Meta. The current options pricing reflects deep institutional anxiety that these historically reliable companies might finally disappoint the market.
The Translation from Single-Stock to Index Volatility
This concentration of single-stock risk creates a direct causal link to broader index-level volatility metrics. The mathematical relationship between the implied moves of the top six heavily weighted stocks fundamentally dictates the pricing of S&P 500 index options. Because these companies represent nearly a third of the index, a severe move in just two of them requires the entire benchmark to rapidly reprice.
Consequently, the S&P 500 forward implied volatility has risen sharply from a baseline of 15% to 22% heading into this critical reporting window. Simultaneous earnings releases amplify these short-term market fluctuations through comparative industry analysis.
When multiple mega-cap companies report within days of each other, institutional investors rapidly recalibrate their broader economic risk models. The S&P 500 consequently experiences massive intraday swings even when 490 of its constituent companies have relatively quiet trading sessions.
Collateral Damage Across the Semiconductor Supply Chain
The concentration risk embedded in top-heavy benchmark indices rapidly infects entirely different hardware sectors downstream. A symbiotic relationship exists between hyperscaler infrastructure budgets and semiconductor manufacturer valuations. The major cloud providers are the primary financial lifeline for manufacturers of advanced processing units and specialised networking equipment.
This heavy reliance creates a severe contagion effect across the broader technology ecosystem. A reduction in projected technology spending by a major software giant immediately triggers valuation downturns across the related hardware supply chain.
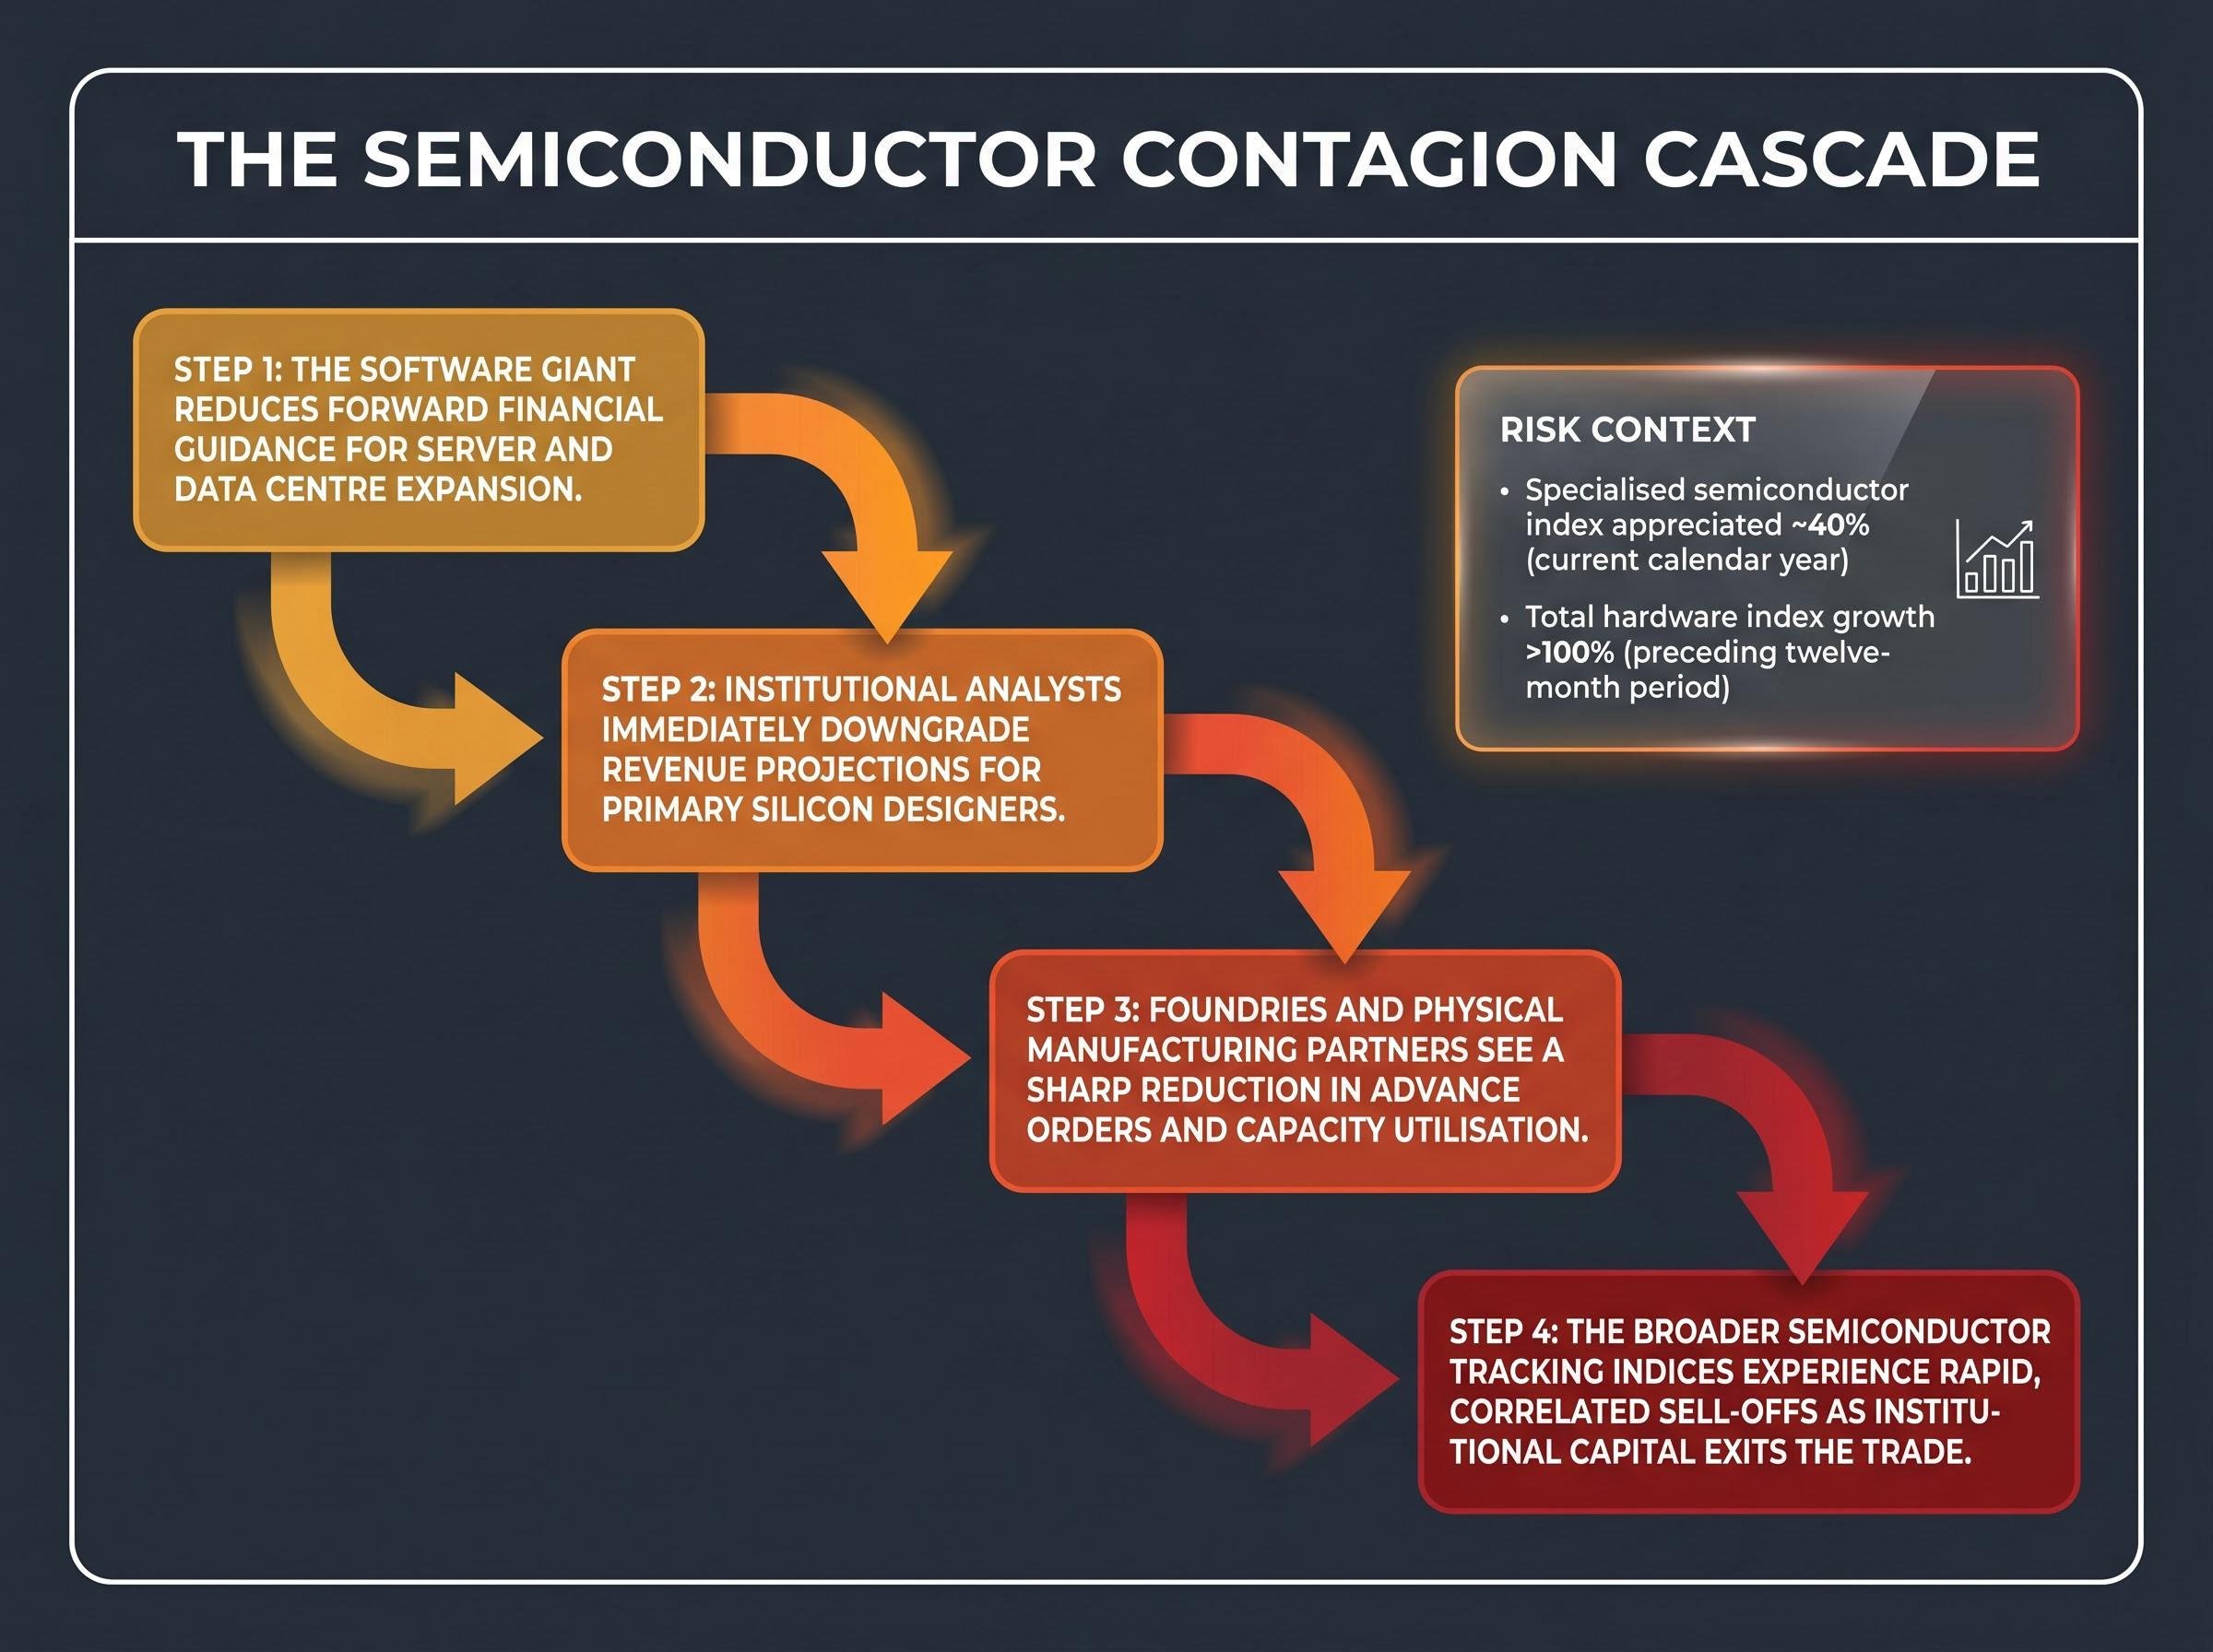
Recent extreme appreciation in specialised hardware indices perfectly illustrates this massive downside vulnerability. According to market data, the specialised semiconductor tracking index appreciated approximately 40% in the current calendar year alone.
According to market data, this aggressive upward trajectory pushed total hardware index growth to exceed 100% over the preceding twelve-month period. According to market data, most recently, a 50-stock semiconductor portfolio saw 27.2% appreciation between late March and late April 2026.
When a hyperscaler announces a reduction in capital expenditure, a specific and immediate sequence of events occurs:
- The software giant reduces forward financial guidance for server and data centre expansion.
- Institutional analysts immediately downgrade revenue projections for primary silicon designers.
- Foundries and physical manufacturing partners see a sharp reduction in advance orders and capacity utilisation.
- The broader semiconductor tracking indices experience rapid, correlated sell-offs as institutional capital exits the trade.
Avoiding direct investment in major software giants does not protect portfolios from the fallout of top-heavy infrastructure spending. The secondary and tertiary market impacts ensure that a contraction at the very top of the index creates widespread collateral damage throughout the underlying hardware ecosystem.
Navigating the New Era of Top-Heavy Equity Benchmarks
Modern capitalisation-weighted indices no longer offer the broad diversification they historically represented to the retail market. The sheer mathematical dominance of six core technology companies has transformed traditional passive investment vehicles into highly concentrated sector bets. Investors must acknowledge that allocating capital to the S&P 500 is now fundamentally an allocation to global digital infrastructure expansion.
The massive capital expenditures required for these advanced technological initiatives have permanently altered the risk profile of passive benchmark investing. In the coming quarters, market participants must look past surface-level index gains and closely monitor revenue validation from these specific infrastructure projects. Furthermore, watching the shifting pricing of derivative markets will be necessary for anticipating sudden market corrections.
A failure by these mega-cap firms to deliver sustainable return on investment will inevitably reverberate through the semiconductor supply chain and shatter benchmark stability.
For readers wanting to examine the macroeconomic pressures complicating this top-heavy index structure, our full explainer on S&P 500 warning signals breaks down how closed shipping straits and rising commodity prices are clashing with peak equity valuations.
This article is for informational purposes only and should not be considered financial advice. Investors should conduct their own research and consult with financial professionals before making investment decisions.