
EOS Shares Jump 4% as MARSS Wins €102M Counter-Drone Deal
1 hr ago

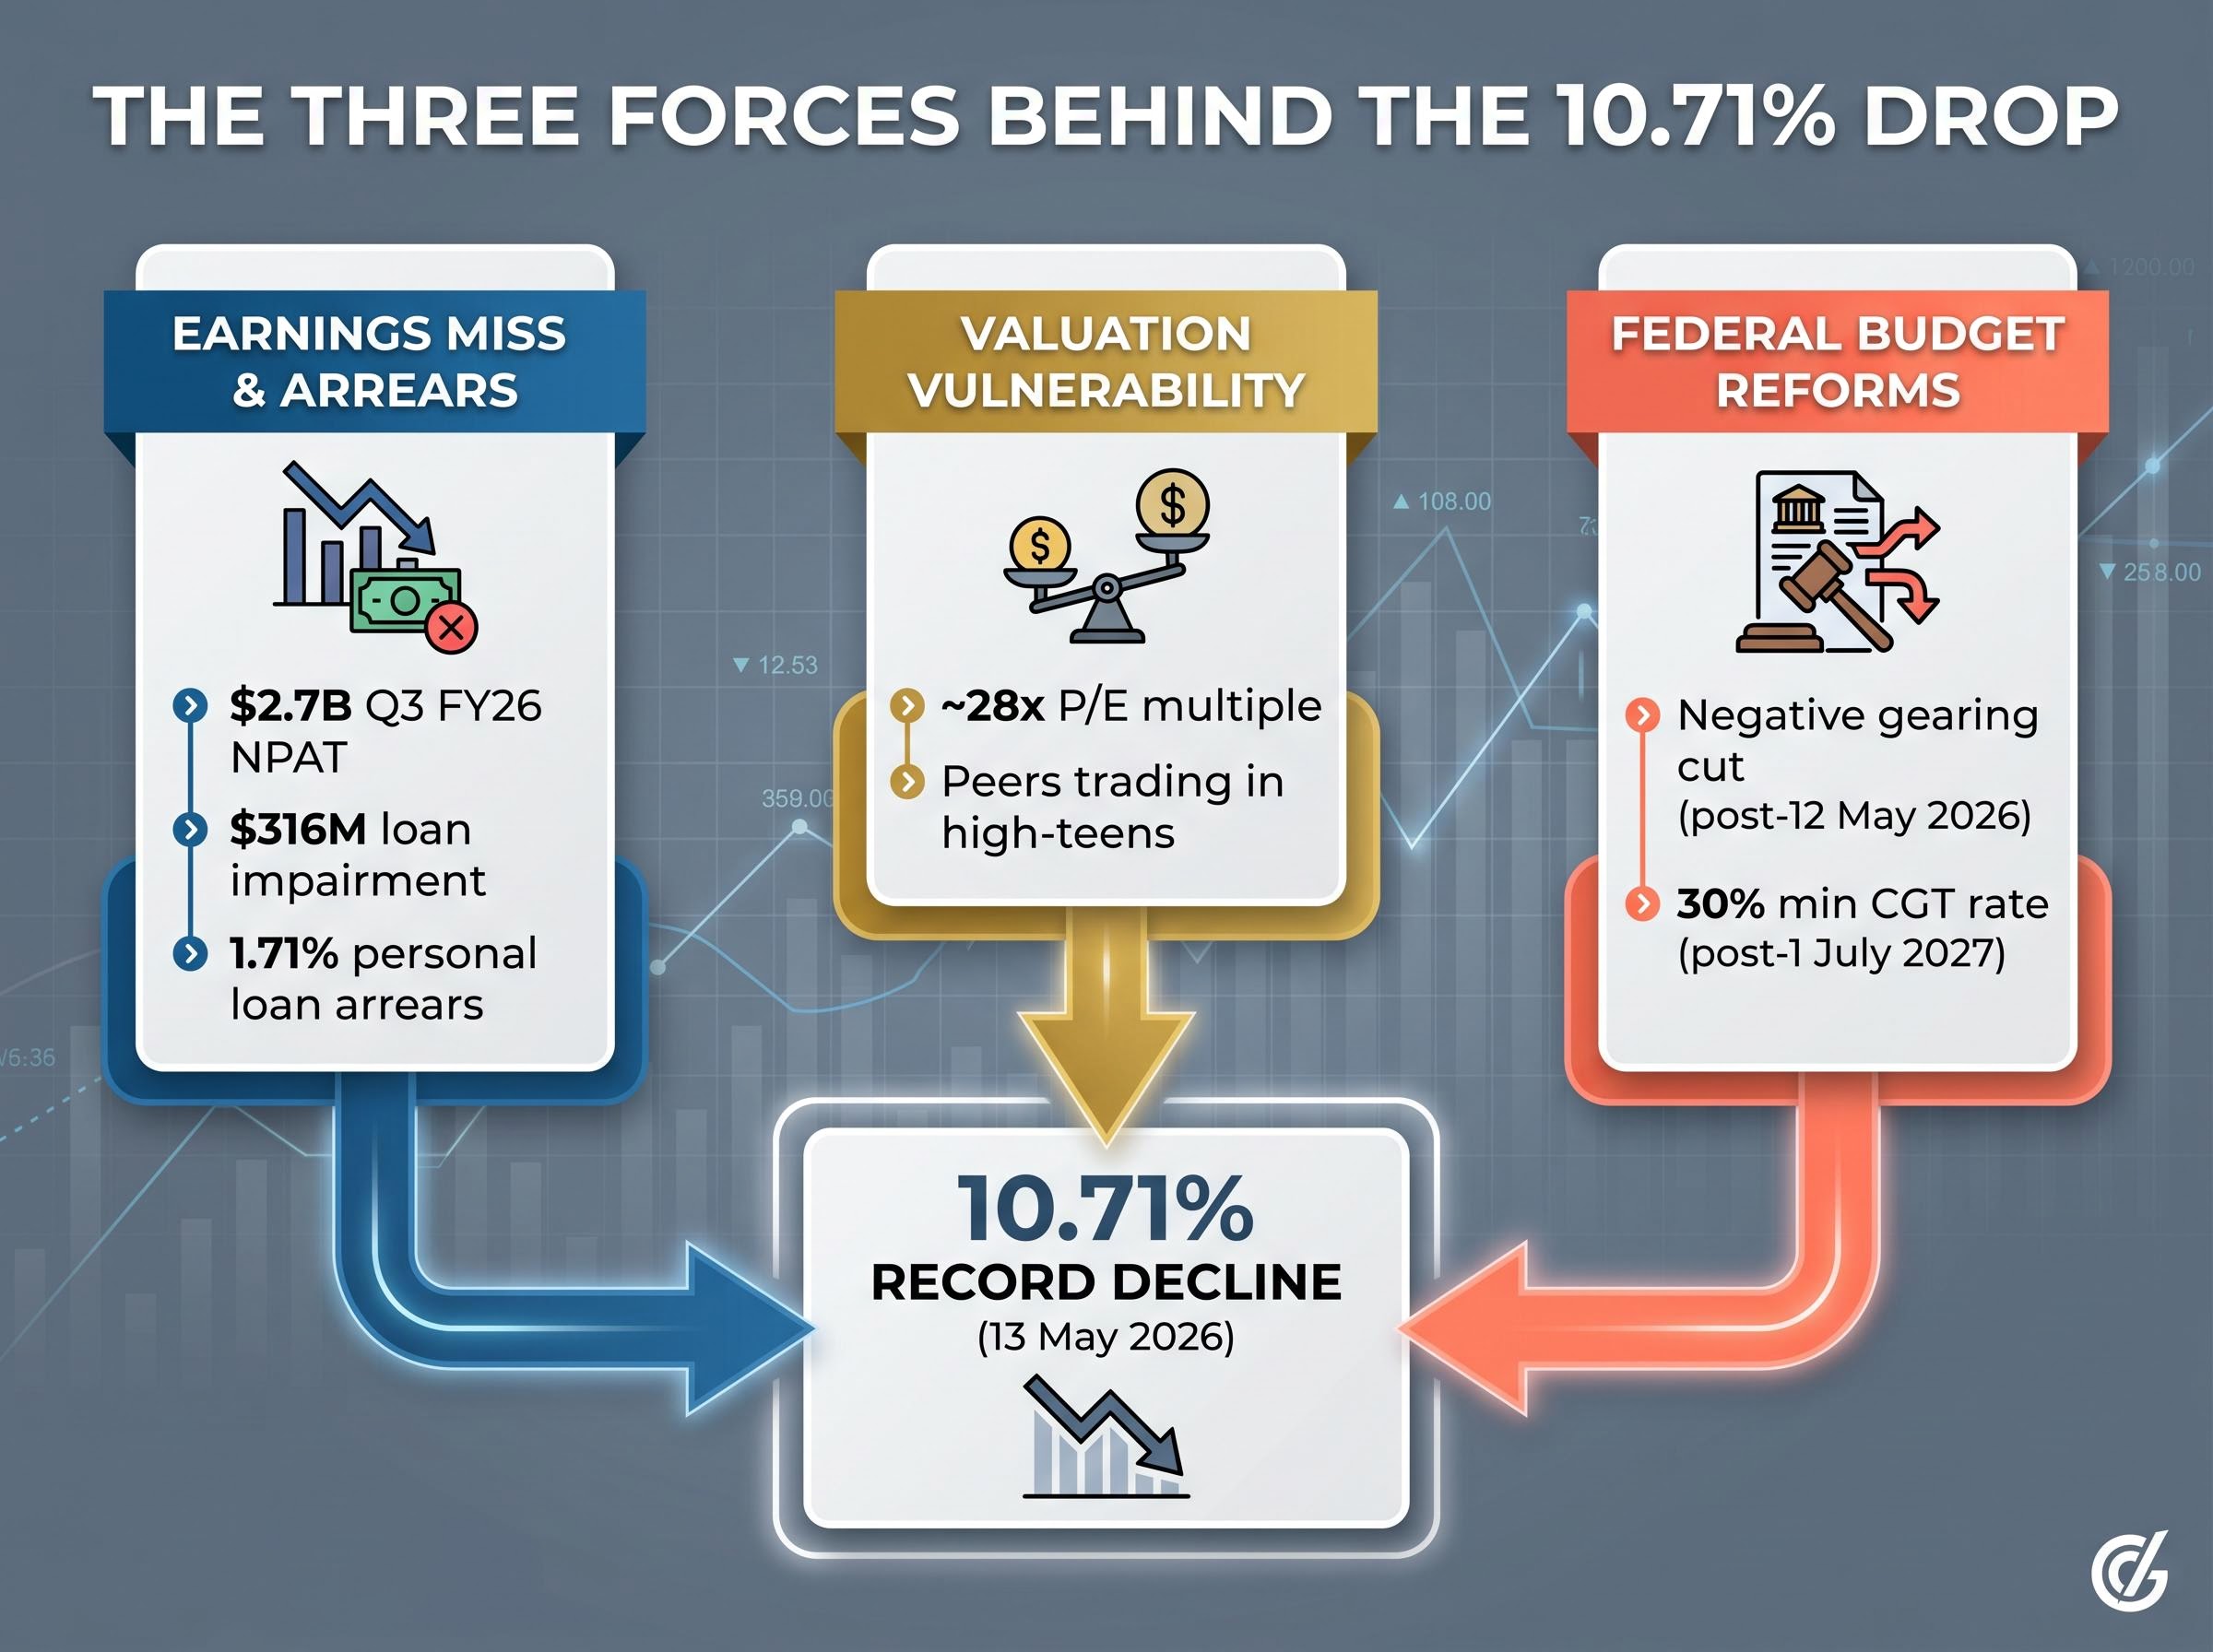
Commonwealth Bank of Australia shares closed more than 10% lower on 13 May 2026, a decline that eclipsed every single-day loss the bank has recorded since its ASX debut in 1991. Not during the Global Financial Crisis. Not during the COVID-19 pandemic rout. The selloff was not the product of a single shock but a convergence of three forces landing simultaneously: a quarterly earnings result that fell short of forecasts, a structural policy change from the Federal Budget that threatens the bank’s most profitable lending segment, and a pre-existing valuation that had left no buffer for disappointment. This analysis breaks down each driver, places the magnitude of the move in historical context using CBA’s full record of major single-day losses, and examines what that history suggests about medium-term outcomes after comparable selloffs.
CBA closed at approximately $153.19, representing a decline of approximately 10.71%. That figure exceeds the prior record single-day loss of 10.01%, set on 16 March 2020 during the initial COVID-19 market collapse. It also surpasses every other session in the bank’s 34-year listed history.
The full record makes the context sharper.
CBA’s 10.71% decline on 13 May 2026 exceeds the prior record of 10.01% on 16 March 2020, a session triggered by a once-in-a-century pandemic.
| Rank | Date | Decline (%) | Trigger Category |
|---|---|---|---|
| 1 | 13 May 2026 | 10.71% | Company-Specific / Policy |
| 2 | 16 March 2020 | 10.01% | Global Crisis (COVID-19) |
| 3 | 23 March 2020 | 9.43% | Global Crisis (COVID-19) |
| 4 | 18 December 2008 | 9.09% | Global Crisis (GFC) |
| 5 | 9 December 2008 | 8.54% | Global Crisis (GFC) |
| 6 | 17 November 2021 | 8.07% | Company-Specific |
| 7 | 12 March 2020 | 7.87% | Global Crisis (COVID-19) |
| 8 | 10 March 2000 | 6.88% | Global Crisis (Dot-com) |
| 9 | 25 July 2008 | 6.77% | Global Crisis (GFC) |
| 10 | 10 October 2008 | 6.72% | Global Crisis (GFC) |
Every prior top-ten entry except one was triggered by a global crisis. The sole exception, 17 November 2021 at 8.07%, was still materially smaller than today’s move. A domestically driven event has now produced a decline of globally crisis-scale magnitude, and the rest of this analysis examines why.
CBA’s unaudited cash net profit after tax (NPAT) came in at approximately $2.7 billion for Q3 FY2026. The headline figure was 2% below Citi’s forecast, 1% below the first-half FY2026 quarterly average, and 4% higher year-on-year. Individually, none of those numbers constituted a severe miss.
Collectively, though, the result validated a pattern that had been forming across the sector all month. ANZ (reported 3 May) showed disappointing revenue momentum. NAB (4 May) missed on revenues due to weaker deposit balances. Westpac (6 May) delivered solid loan volumes but flagged net interest margin (NIM) pressure. CBA’s result was the fourth consecutive Big Four quarterly report to underwhelm, and the first to arrive with a premium valuation still attached.
The credit quality data carried the sharpest edge. Loan impairment expense reached $316 million, including a $200 million addition to forward-looking collective provisions for macroeconomic uncertainty.
The arrears breakdown told a more specific story:
Operating income was essentially flat, with lending and deposit volume growth offset by two fewer calendar days in the quarter. The result was uninspiring before the arrears data; after it, the case for holding CBA at its elevated multiple weakened further.
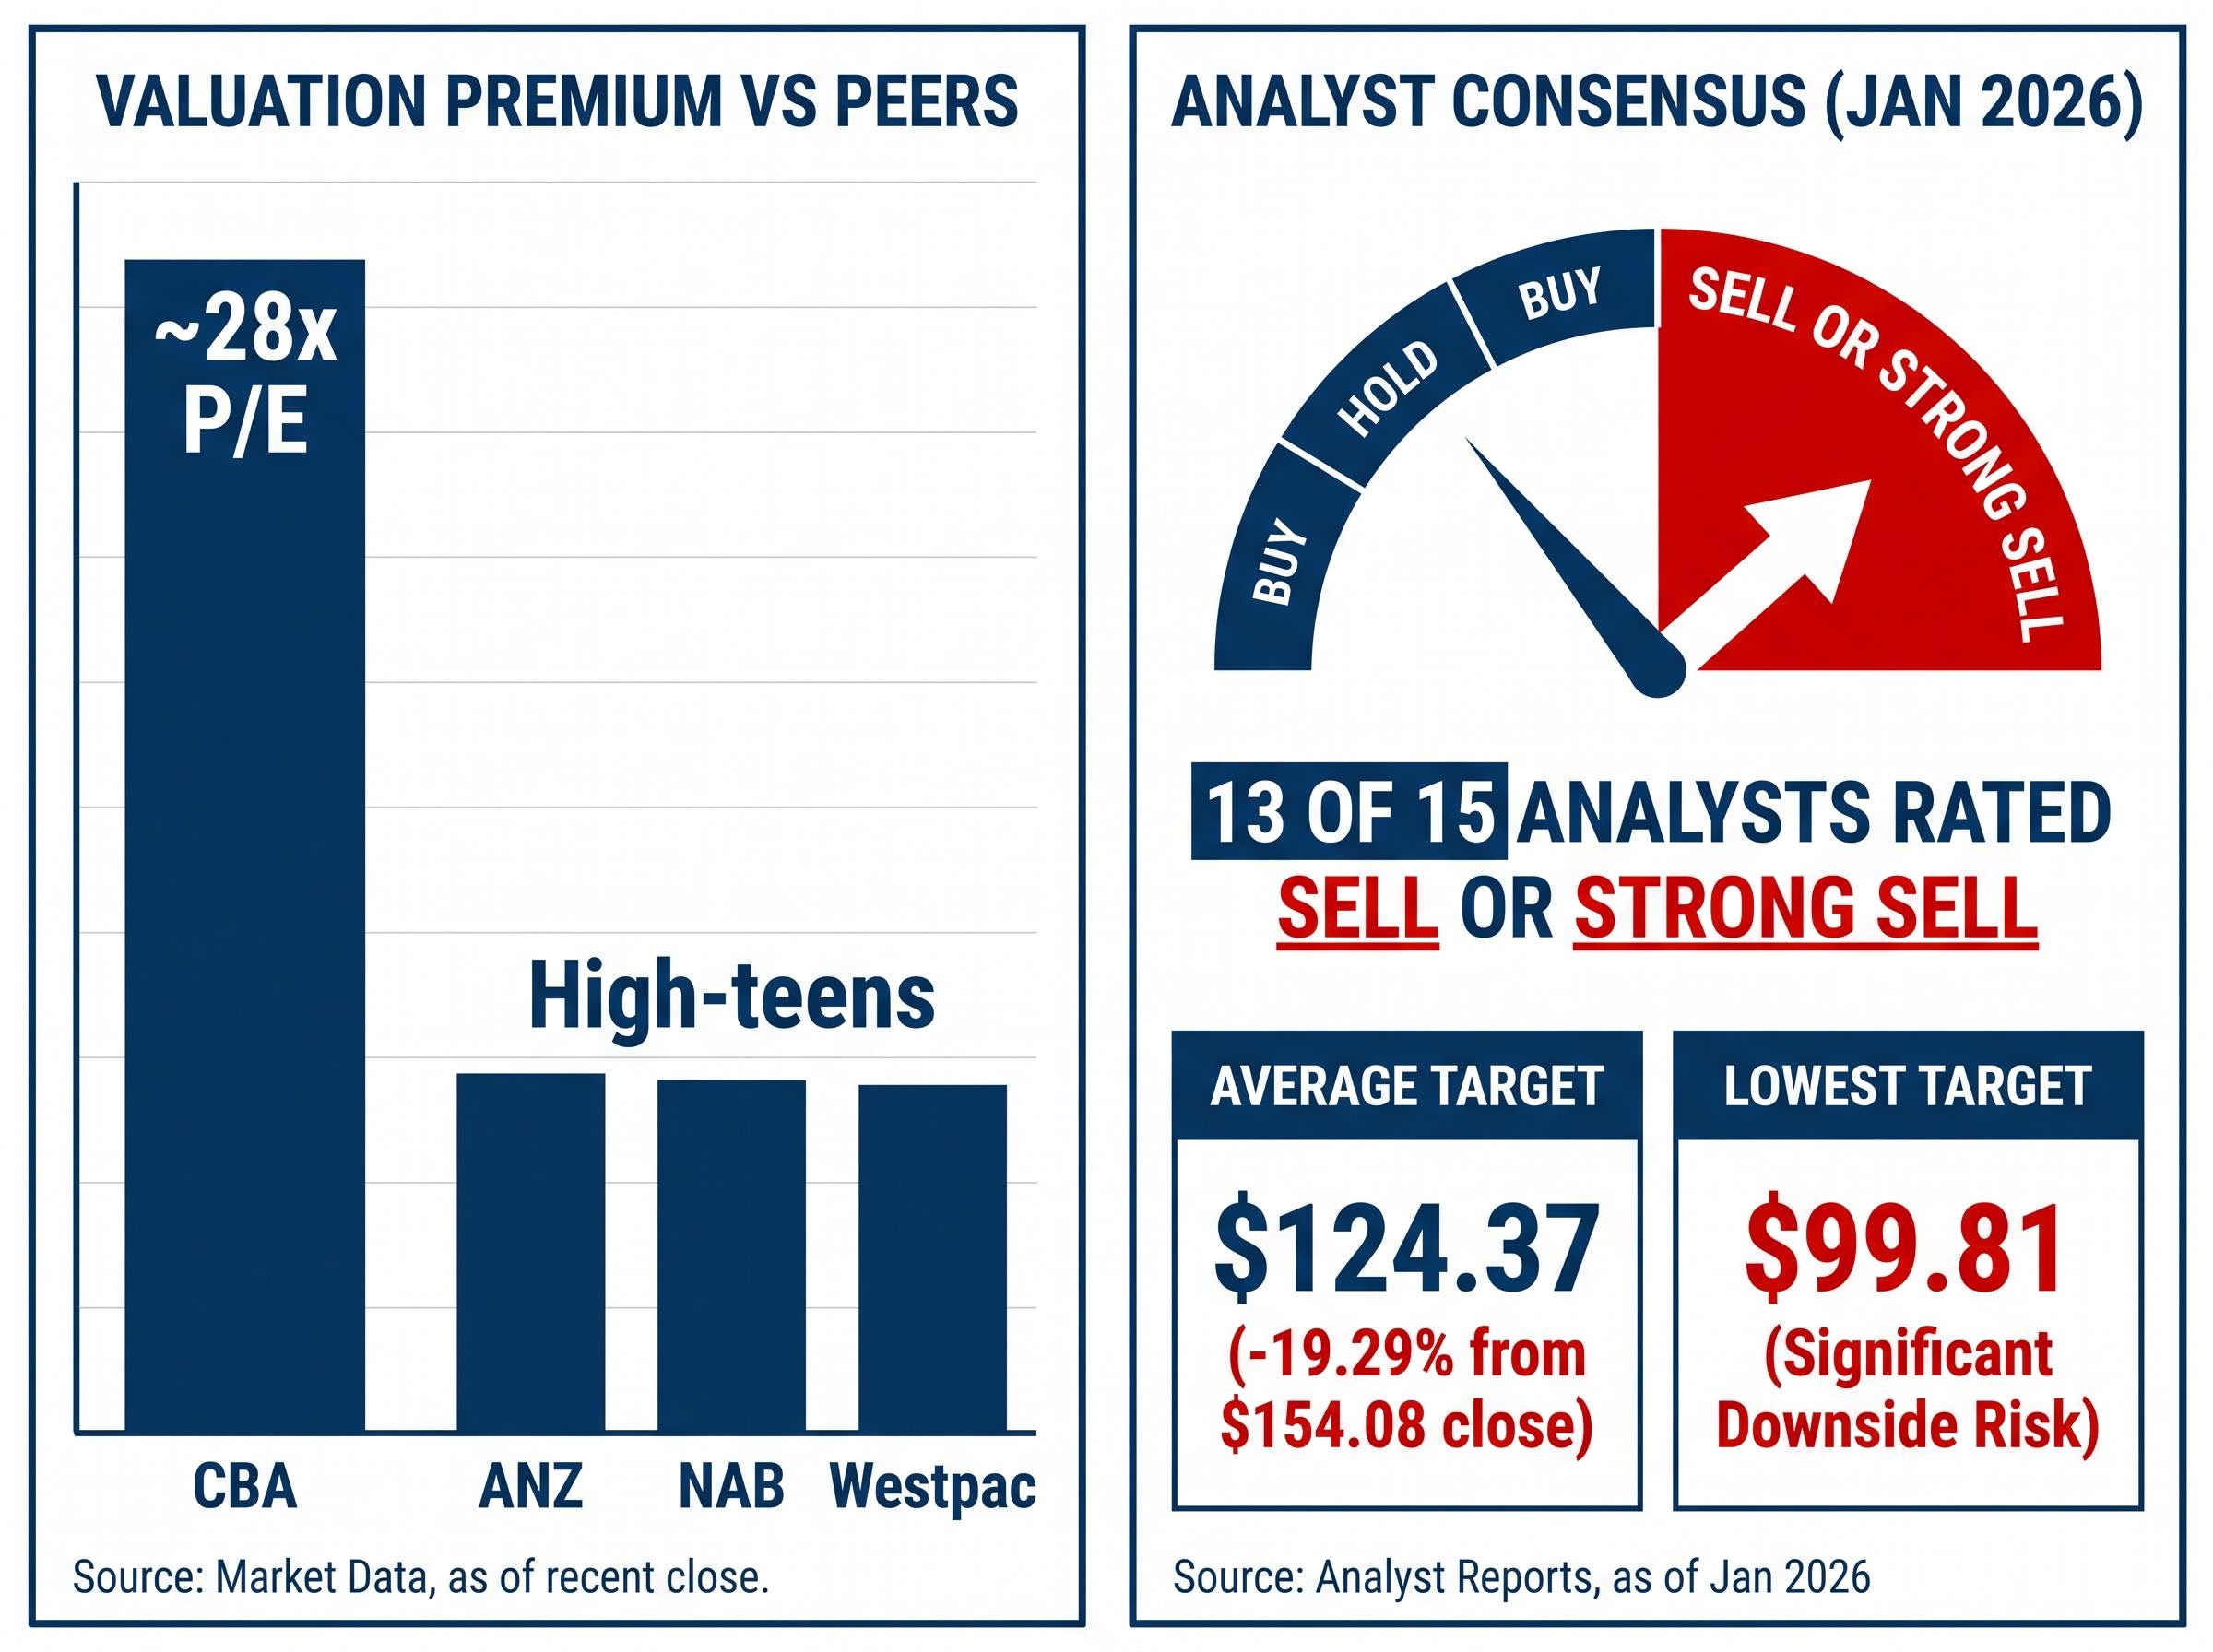
CBA entered May trading at approximately 28 times earnings. Its Big Four peers, ANZ, NAB, and Westpac, traded in the high-teens. That gap was not new, but its consequences become clear under stress.
A price-to-earnings (P/E) ratio measures how much investors pay for each dollar of a company’s profit. At 28 times, CBA shareholders were paying roughly 60% more per dollar of earnings than holders of its closest peers. That premium is sustainable only as long as earnings growth justifies it. The moment growth disappoints, the stock does not simply decline by the magnitude of the miss; it re-rates toward peer multiples, compressing years of premium expansion into a single session.
| Bank | P/E Multiple (approx.) | Dividend Yield (approx.) |
|---|---|---|
| CBA | ~28x | ~3% |
| ANZ | High-teens | Higher than CBA |
| NAB | High-teens | Higher than CBA |
| Westpac | High-teens | Higher than CBA |
As of January 2026, 13 of 15 analysts rated CBA as Sell or Strong Sell, with an average 12-month price target of $124.37, implying 19.29% downside from the 13 January close of $154.08. The lowest target sat at $99.81.
The November 2021 precedent is instructive. CBA was trading at approximately 18 times earnings when peers sat in the low-teens. That session produced an 8.07% decline, then the worst company-specific single-day loss in CBA’s history. Today’s multiple was 10 turns higher. The arithmetic of a re-rating at 28 times made a 10% fall not an overreaction but a mathematically proportionate adjustment.
The earnings miss alone would have produced a significant decline. The Federal Budget reforms transformed it into a record one.
Two distinct policy changes landed on the same day:
CBA holds the largest investor mortgage portfolio among Australian banks. Investor loans are typically interest-only, carry wider spreads than owner-occupier mortgages, exhibit historically superior asset quality, and generate stronger return on equity. They are, in short, the highest-margin segment of CBA’s lending book.
Jarden analyst Matthew Wilson projected the changes could reduce housing credit growth by up to 25%.
The grandfathering provision creates an outcome that appears counterintuitive. By protecting existing investors’ tax concessions while removing them for new purchasers, the reform gives current holders a strong incentive to retain their properties rather than sell. A property investor who sells an established dwelling and attempts to purchase another loses the negative gearing benefit permanently.
This suppresses property market turnover. Fewer sales mean fewer new mortgages originated, fewer refinancing events, and a shrinking pipeline of the high-margin investor loans that CBA relies on disproportionately. The headwind compounds over time rather than resolving quickly, because each year that passes adds another cohort of potential sellers who choose to hold instead.
Unlike the earnings miss, which is a cyclical quarterly fluctuation, or the valuation premium, which was already known, the budget reform represents a structural change to CBA’s revenue model that analysts had not yet priced into their models.
The historical record of CBA’s worst sessions offers a framework for thinking about what comes next, though it resists a clean conclusion.
The January 2026 analyst consensus placed CBA’s average 12-month price target at $124.37, implying 19.29% downside from the $154.08 close. The lowest target of $99.81 implied 35.22% downside.
The distinction that matters is the nature of the catalyst. Global crisis declines tend to recover as the shock fades and fundamentals reassert themselves. The recovery catalyst is the absence of continued crisis. A structurally driven decline, where the headwind is a permanent policy change rather than a passing shock, does not carry the same reversion mechanism. The budget reform does not expire.
Three forces, each individually manageable, compounded on 13 May to produce something none of them could have generated alone. The earnings miss confirmed a softening trend visible across all four major banks. The valuation re-rating was the mathematical consequence of paying 28 times earnings for a bank facing that trend. The budget reform added a structural revenue headwind with no obvious expiry date.
A broader dynamic may have amplified the move. Mining majors reached all-time price highs on the same session, according to Kerry Sun at Market Index, raising the question of whether capital was actively rotating out of bank stocks rather than simply reacting to CBA-specific news. CBA entered the session as the world’s most expensively valued banking stock.
The following signals would materially alter the investment thesis in either direction:
This article is for informational purposes only and should not be considered financial advice. Investors should conduct their own research and consult with financial professionals before making investment decisions.
Past performance does not guarantee future results. Financial projections are subject to market conditions and various risk factors.
The convergence of an earnings miss, a structural valuation vulnerability, and a federal budget reform produced a move of crisis magnitude without a global crisis catalyst. That combination has no precedent in CBA’s 34-year listed history.
Almost every comparable decline in the historical record was eventually a buying opportunity, because the shock that caused it was temporary. The analytical question that separates today from those prior sessions is whether the fundamental case for CBA’s premium valuation has survived the budget reform intact. The negative gearing changes do not reverse. The lock-in effect compounds. The highest-margin segment of the bank’s lending book faces a structural headwind that did not exist before 12 May 2026.
The answer will not arrive in a single session. It will arrive in the data that follows: in the arrears figures, the lending volumes, and the analyst revisions that determine whether the market’s most expensive bank can justify remaining so.
—
Three forces converged simultaneously: a quarterly cash profit of approximately $2.7 billion that missed analyst forecasts, a stretched valuation of around 28 times earnings that left no buffer for disappointment, and Federal Budget reforms that eliminated negative gearing for new residential investment property purchases, threatening CBA's highest-margin lending segment.
Negative gearing is a tax concession that allows property investors to offset rental losses against their other income. Its removal for new purchases after 12 May 2026 is expected to reduce housing credit growth by up to 25%, directly hurting CBA because it holds the largest investor mortgage portfolio among Australian banks, and investor loans are the highest-margin segment of its lending book.
The 10.71% fall is the largest single-day loss in CBA's 34-year listed history, surpassing the prior record of 10.01% set on 16 March 2020 during the COVID-19 market collapse, and exceeding every decline recorded during the Global Financial Crisis.
CBA reported unaudited cash net profit after tax of approximately $2.7 billion for Q3 FY2026, which was 2% below Citi's forecast and 1% below the first-half quarterly average. Personal loan arrears above 90 days reached 1.71%, the highest level since before the pandemic, and the bank added $200 million to collective provisions for macroeconomic uncertainty.
Key signals to monitor include updated analyst price target revisions from the sell-side, any CBA management guidance on the budget reform's impact on investor lending volumes, whether the 1.71% personal loan arrears figure deteriorates further in subsequent quarters, and whether capital continues rotating from bank stocks into mining and resources.