The S&P 500 has clawed back all of its March losses and is flirting with record highs again. To many retail investors, that looks like the all-clear. It is not.
As of late April 2026, the index sits near 7,041 despite an ongoing Iran conflict, a largely blocked Strait of Hormuz, Brent crude above $100 per barrel, and recession probability estimates from major institutions running as high as 48.6%. The market’s recovery has outpaced the resolution of any of the conditions that caused the original selloff.
What follows is an argument that the rebound masks genuine structural vulnerabilities. This analysis explains the specific mechanisms through which energy prices translate into economic contraction, examines the institutional probability estimates the index level appears to be ignoring, and gives readers a grounded framework for understanding what a recession would actually mean for equity portfolios at current levels.
The S&P 500 is back near record highs, but nothing that caused the selloff has been fixed
The S&P 500 closed at 6,343.72 on 30 March 2026. By 16 April 2026, it had climbed to 7,041.28, a recovery of approximately 11%. The rebound was swift, decisive, and almost entirely disconnected from the conditions that triggered the drawdown in the first place.
Those conditions remain unresolved:
- The Strait of Hormuz remains largely blocked as of 28-29 April 2026. Iran’s offer to reopen the strait is conditional on the United States lifting its own blockade, meaning no resolution is imminent.
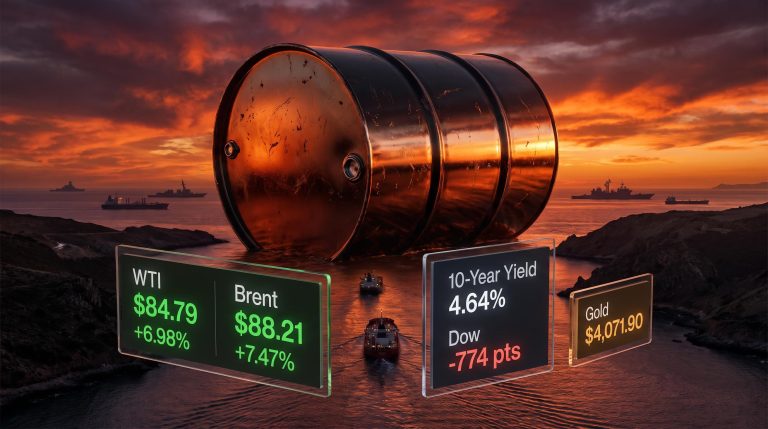
- Brent crude, which began 2026 near $65 per barrel, has surpassed $100 per barrel. The underlying supply disruptions have shifted from logistical challenges to actual production cuts.
- Regional tanker loading infrastructure sustained damage during six weeks of exchanges, and storage capacity limitations mean supply normalisation cannot follow quickly even if diplomacy succeeds.
Brent crude has risen from approximately $65 per barrel in January 2026 to above $100 per barrel, a move of more than 50% in under four months.
The index recovered. The problems did not. Retail investors who see only the price level risk confusing market sentiment with economic reality, and those two things have diverged materially.
When big ASX news breaks, our subscribers know first
The recession probability numbers that the index level is not reflecting
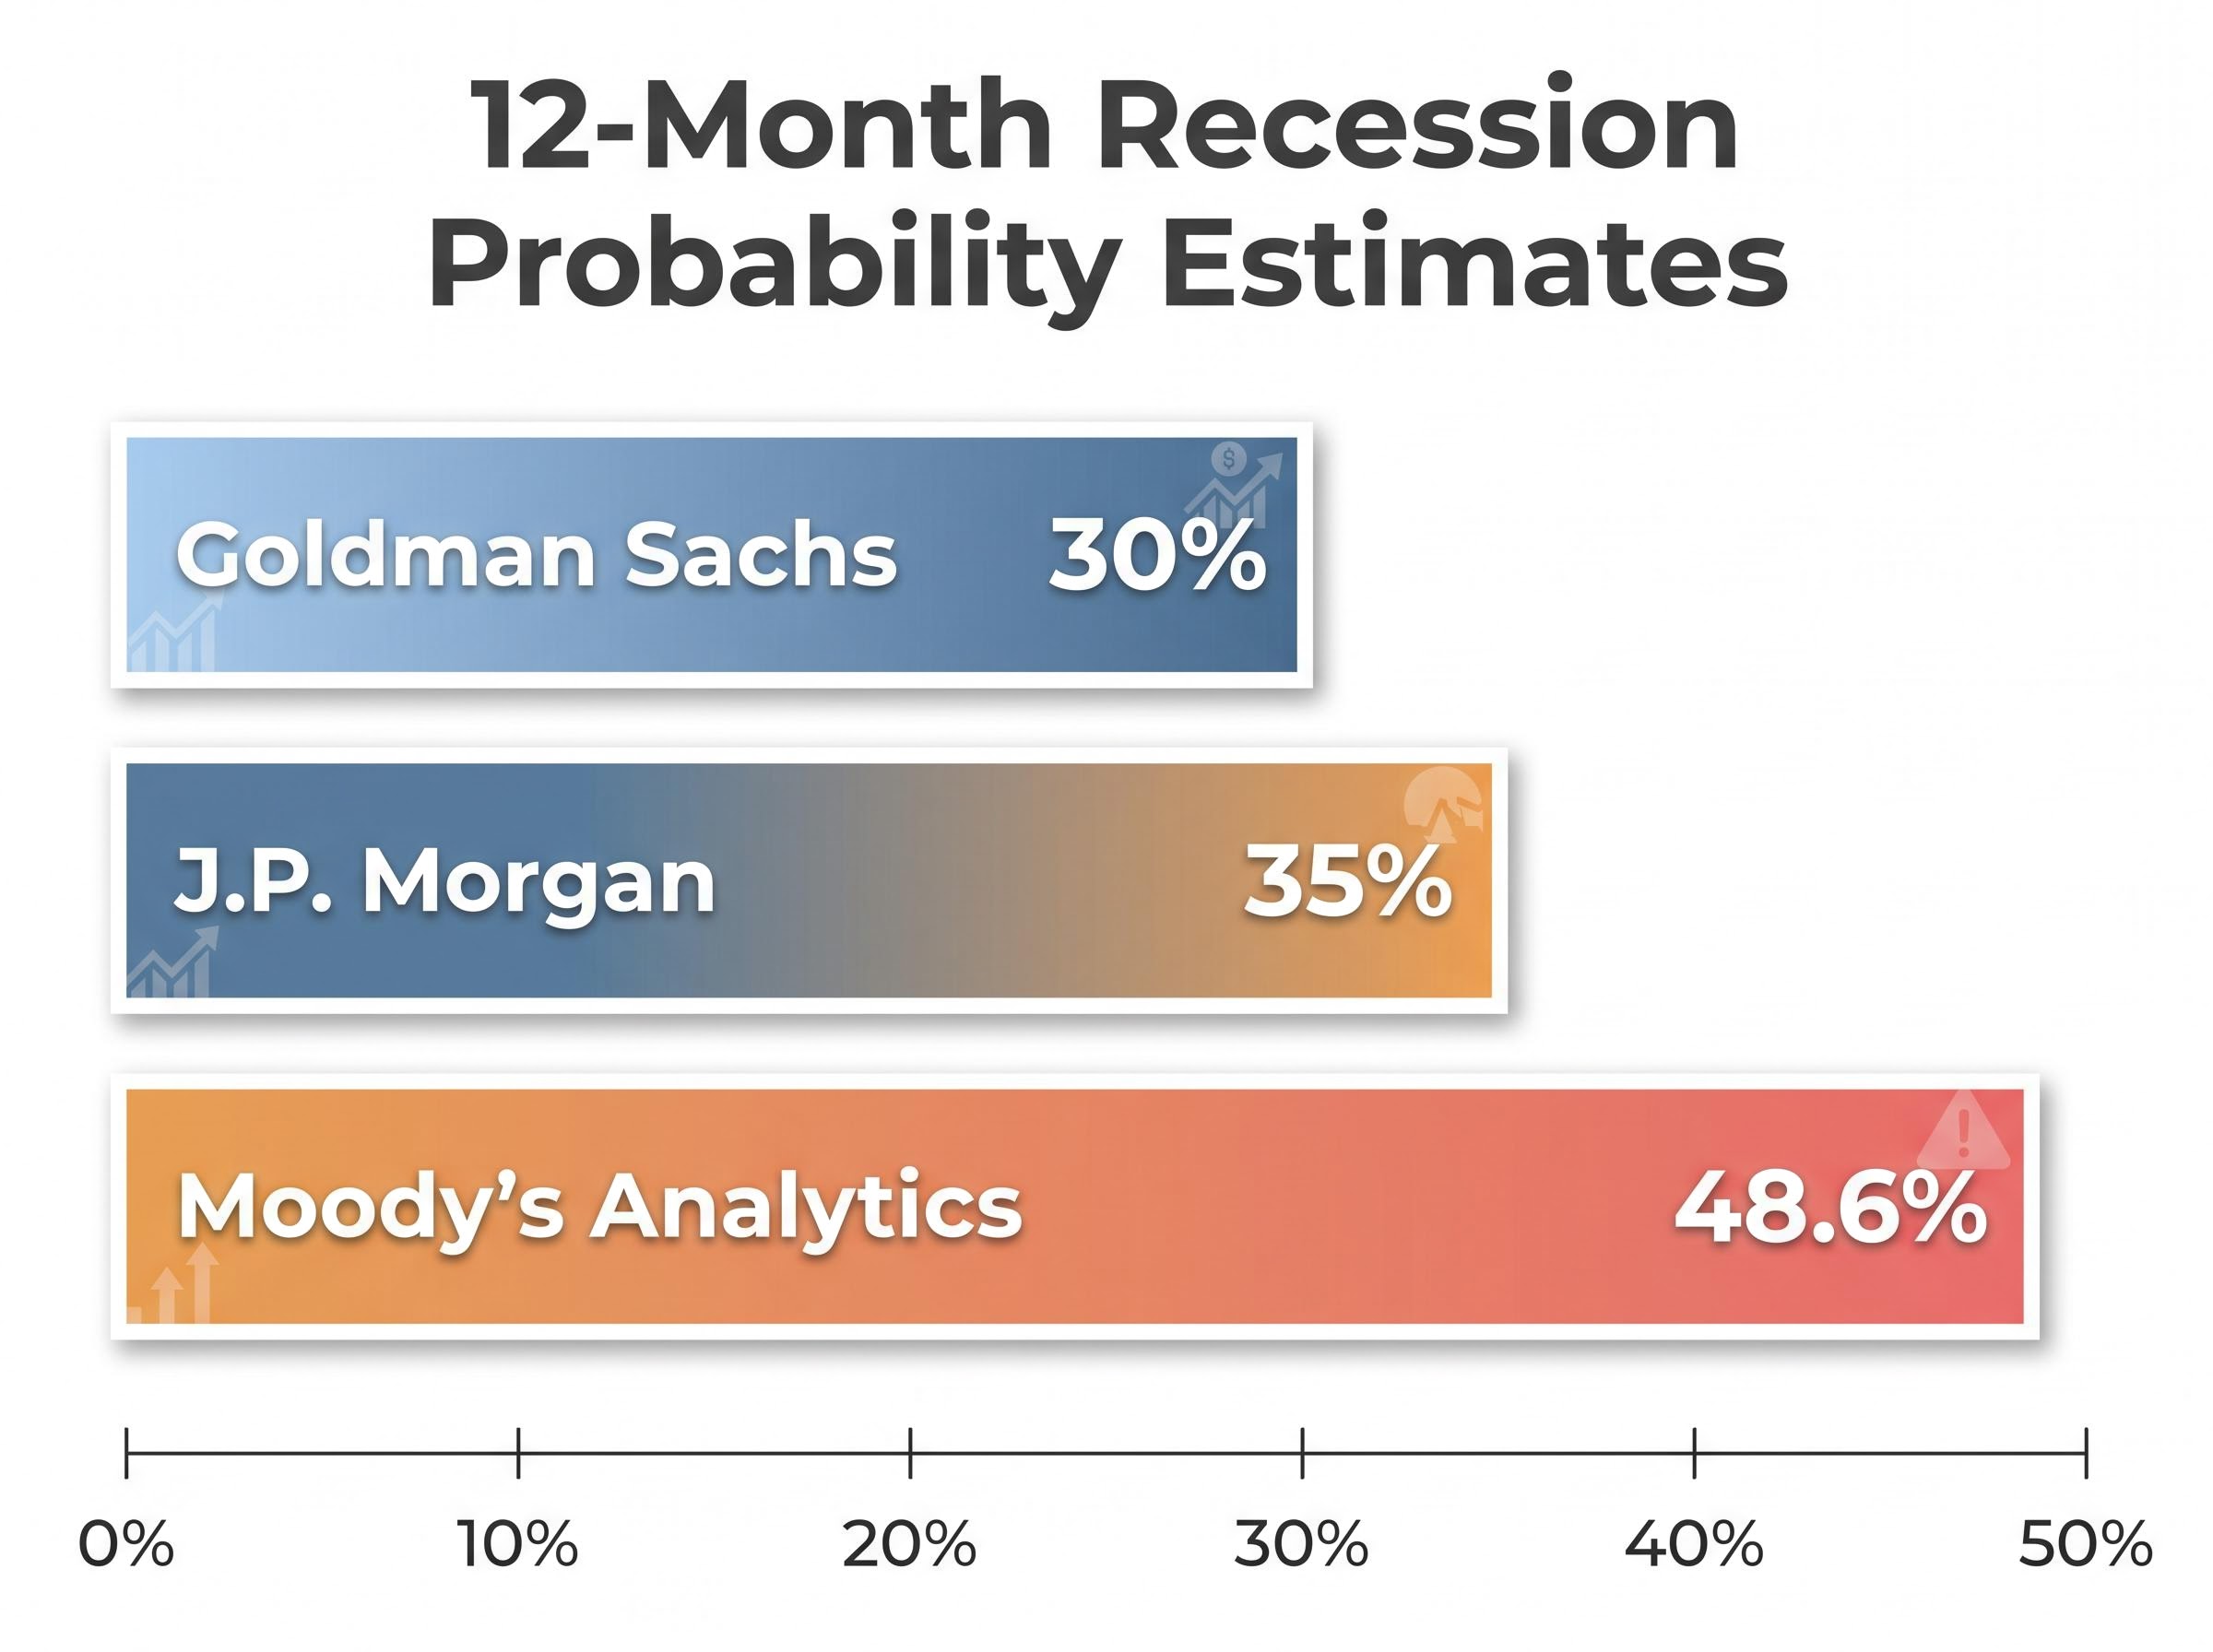
Three of Wall Street’s most closely watched institutions are running recession probability estimates that sit well above what the S&P 500’s record-adjacent level would imply.
| Institution | Recession Probability Estimate | Timeframe |
|---|---|---|
| Goldman Sachs | 30% | 12 months |
| J.P. Morgan | 35% | 12 months |
| Moody’s Analytics | 48.6% | 12 months |
These are not fringe estimates. They represent the research arms of institutions whose own trading desks are participating in the rally.
IMF Managing Director Kristalina Georgieva has separately urged market caution, citing softened growth forecasts and downside risks tied to a prolonged conflict. The IMF’s April 2026 World Economic Outlook cut global growth to 3.1% and raised its headline inflation forecast to 4.4%.
The University of Michigan Consumer Sentiment Index fell to 49.8 in April 2026, a level consistent with significant consumer pessimism. By contrast, the Conference Board Consumer Confidence Index rose modestly to 92.8 on 28 April.
The split between these two measures may be significant. Michigan’s survey is forward-looking and attitudinal; the Conference Board’s is more behaviour-based. When the attitudinal measure collapses while the behavioural measure holds, it can signal a lag: consumers say they feel worse before they start spending less. If that lag closes, the spending data will follow the sentiment data downward.
How elevated gasoline prices have historically affected stock market returns
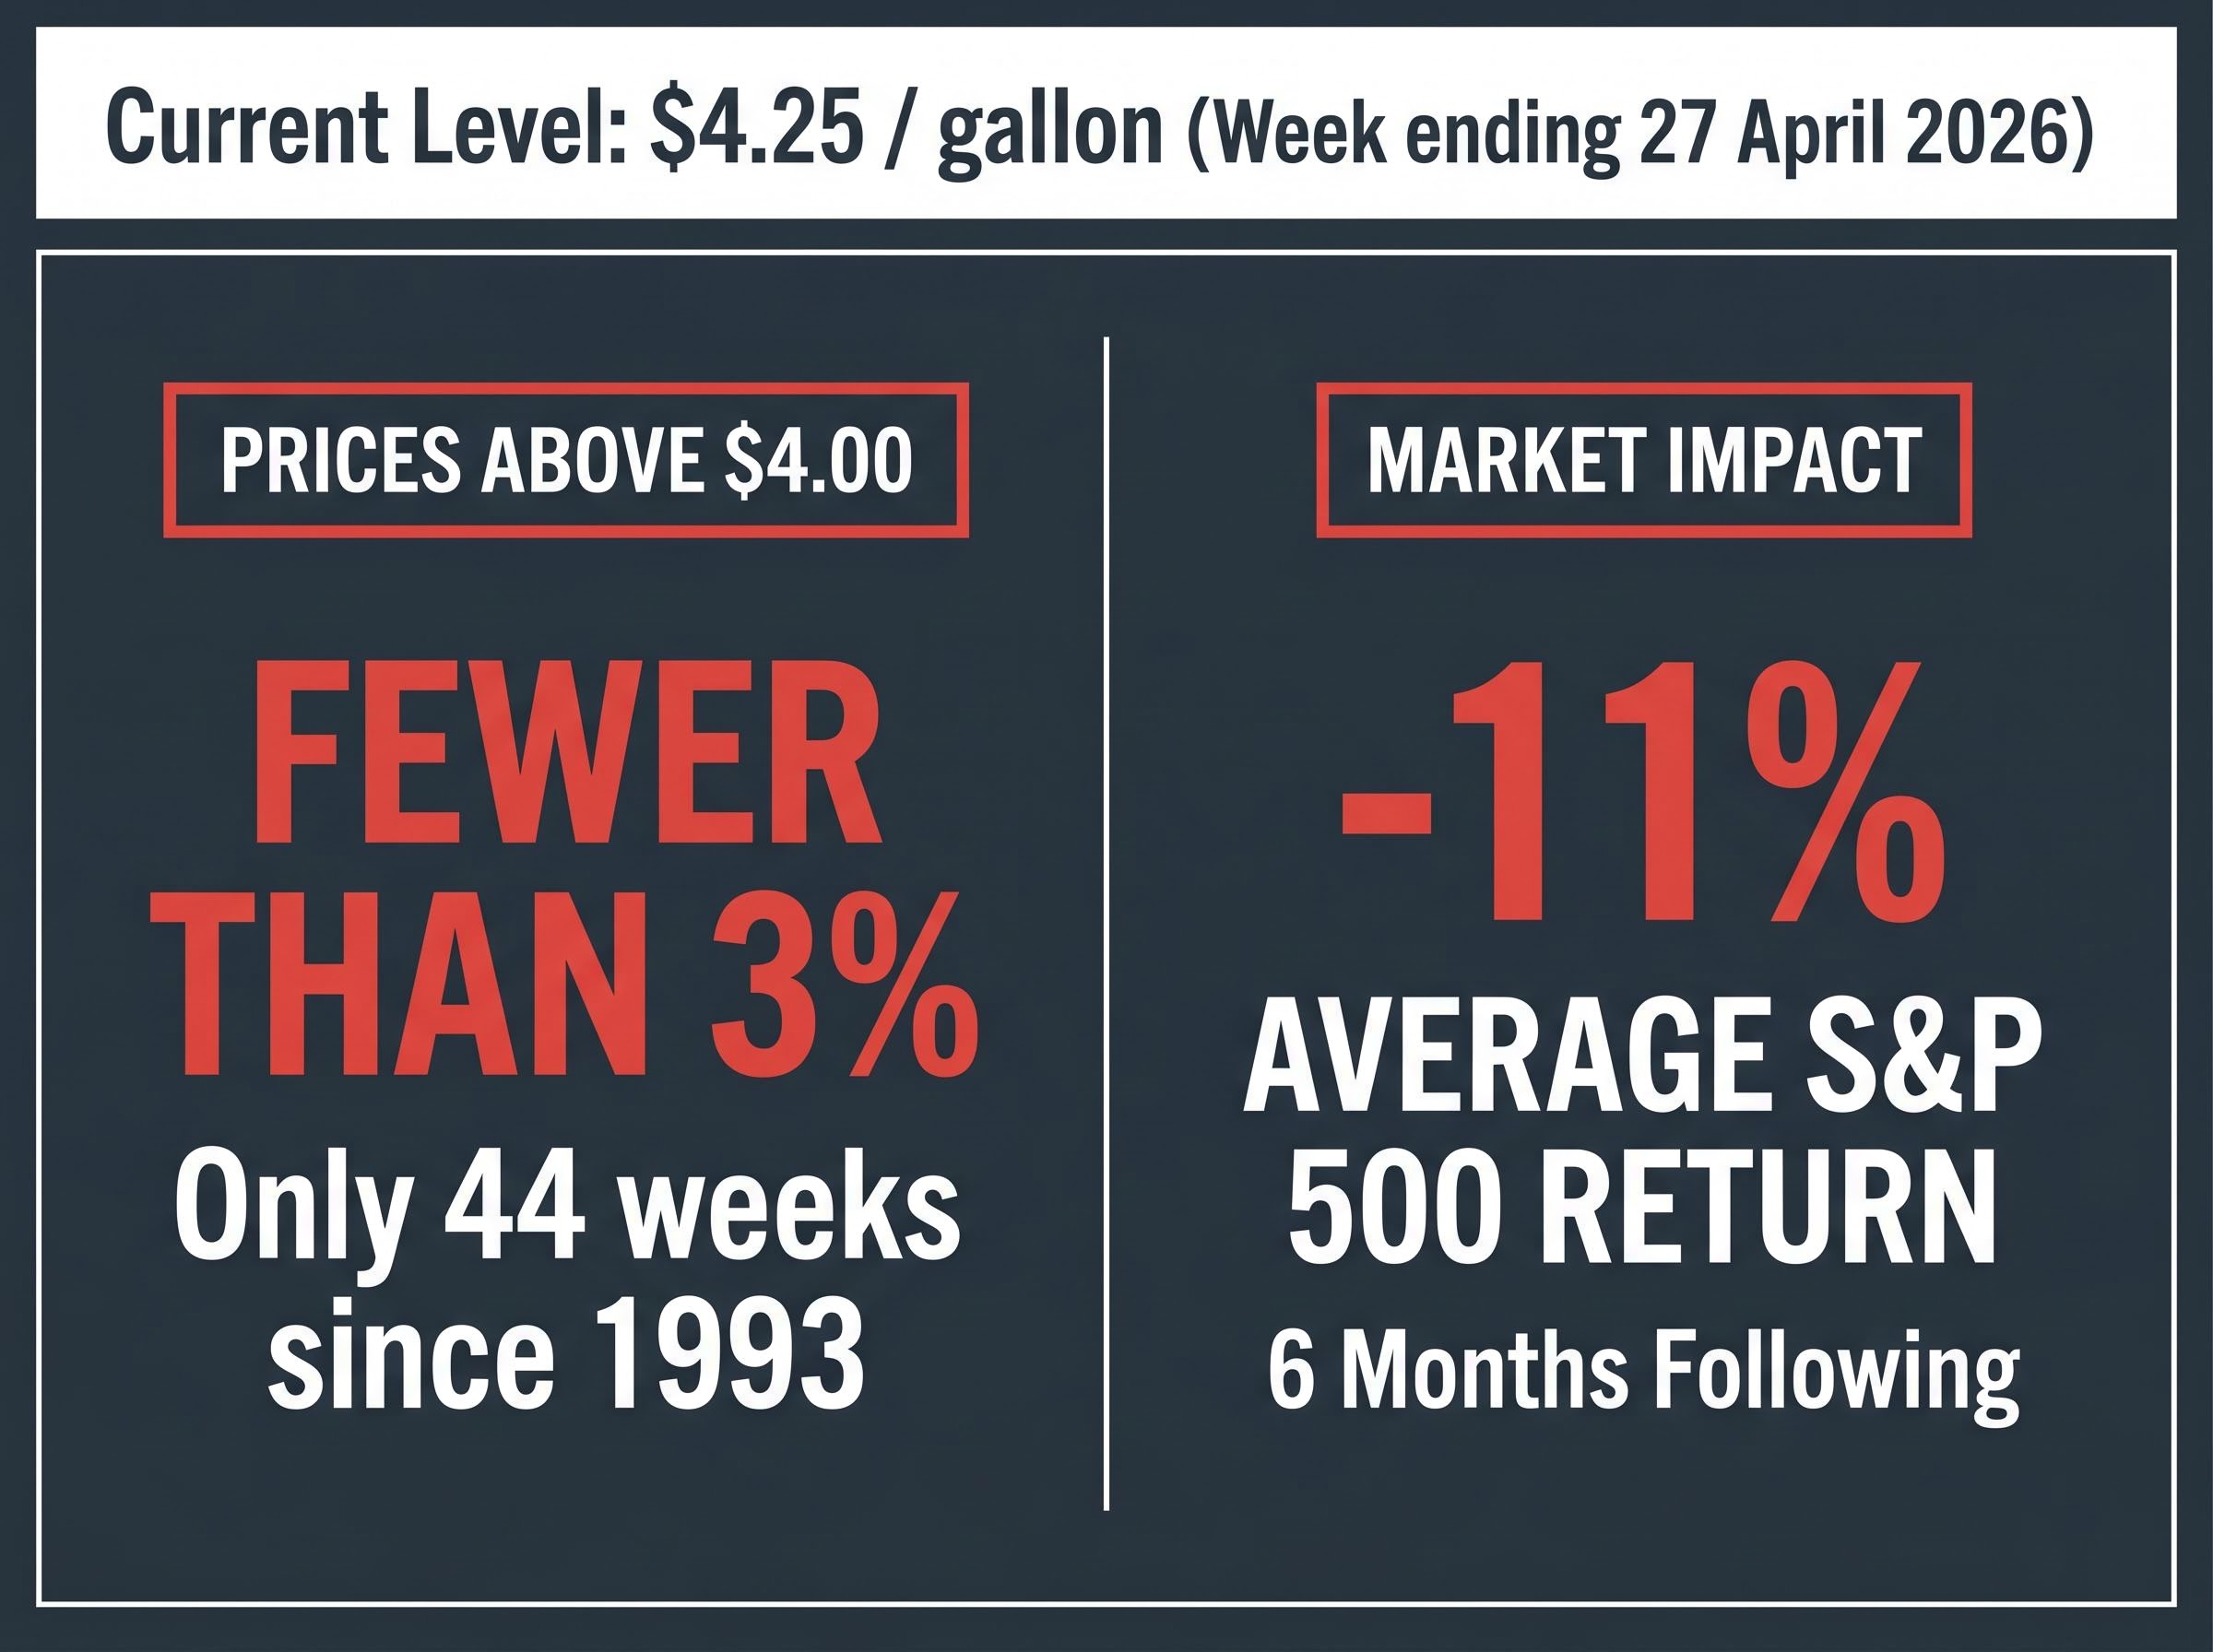
U.S. average gasoline prices hit $4.25 per gallon for the week ending 27 April 2026, according to the U.S. Energy Information Administration (EIA). That matches the highs last seen in August 2022 and represents a roughly 45% increase since the start of the year.
The EIA weekly gasoline price data confirms the national retail average crossed $4.25 per gallon for the week ending 27 April 2026, placing current prices firmly within the rare historical band that has preceded significant equity market underperformance.
The mechanism connecting fuel prices to equity returns is direct. Elevated fuel costs compress household spending at the pump and indirectly through higher business costs passed to consumers. That compression reduces the aggregate economic activity on which corporate revenues, and therefore equity valuations, depend.
The historical record sharpens the picture. In only 44 weeks since 1993 (fewer than 3% of all weeks tracked) have U.S. average gasoline prices exceeded $4.00 per gallon.
| Price Threshold | Historical Frequency (Since 1993) | Average S&P 500 Return (6 Months Following) |
|---|---|---|
| Above $4.00 per gallon | 44 of ~1,700 weeks (fewer than 3%) | Approximately -11% |
In the 44 weeks since 1993 when U.S. gasoline prices exceeded $4.00 per gallon, the S&P 500 declined an average of approximately 11% over the following six months.
The current environment meets that threshold. Gasoline is at $4.25, the underlying oil price disruption is structural rather than seasonal, and the historical pattern has been consistent across the small number of comparable episodes. This does not guarantee a repeat, but it provides a data-driven signal that maps current conditions to prior market outcomes.
The 11% average decline figure, however, understates the tail risk: sustained high-gas-price episodes have historically been associated with peak-to-trough bear market drawdowns averaging 41%, meaning the current episode sits at the mild end of a distribution that has extended far deeper when elevated fuel costs persisted long enough to become self-reinforcing.
The path from energy price spikes to economic contraction, and the timeline involved
The sequence from energy price shock to economic contraction follows a recognisable three-stage pattern:
- Energy prices rise sustained above trend, driven by supply disruption or geopolitical restriction.
- Consumer spending compresses as households allocate more income to fuel and energy-linked goods, reducing discretionary expenditure.
- Corporate revenues and employment contract as reduced consumer demand feeds through to earnings, hiring decisions, and capital expenditure.
Consumer spending represents the dominant engine of U.S. economic growth. Sustained energy price increases function as a tax on consumption, eroding the discretionary spending that sustains the corporate revenue base the S&P 500 is priced against.
The NBER research on oil shock transmission by James Hamilton provides a rigorous empirical basis for this sequence, documenting how sustained oil price increases reduce aggregate consumption spending and suppress automobile purchases before broader GDP contraction becomes visible in official data.
The IMF’s April 2026 outlook reflects this dynamic. Its global growth forecast was cut to 3.1%, and headline inflation was raised to 4.4%, explicitly under the assumption of a short-lived conflict. If the conflict extends, the IMF flagged materially worse outcomes.
What the scenario analysis actually says about oil prices
Martijn Rats, commodity strategist at Morgan Stanley, has outlined two scenarios for 2026 oil prices. Under the most favourable resolution, oil averages $80-$90 per barrel for the year. If the Strait of Hormuz remains closed for several months, the projection rises to $150-$180 per barrel.
The base case deserves scrutiny. An average of $80-$90 for 2026 represents a significant elevation above the $65 baseline at the start of the year. The favourable scenario is not a return to normal; it is a contained version of the shock.
Damaged infrastructure and storage capacity limitations mean that even a diplomatic resolution does not produce an immediate price normalisation. Production recovery takes time, and the structural component of the energy price problem outlasts whatever geopolitical trigger set it in motion.
What a recession would actually cost equity investors, in historical terms
Since the S&P 500’s inception in 1957, the index has lost an average of 32% during recessionary periods. That is the historical baseline for what happens to equities when the U.S. economy contracts.
Mark Zandi, Chief Economist at Moody’s, noted via social media platform X that even a swift wind-down of the Iran conflict and rapid oil price decline would still leave the U.S. economy with zero GDP growth and no job creation for the remainder of 2026.
The benign scenario, in other words, is already substantially negative for economic output. The question is whether the outcome tracks the benign case or something worse.
Anchoring the historical average to current levels provides a planning framework:
- Average S&P 500 drawdown during recessions since 1957: 32%
- The dataset covers every U.S. recession since the index’s inception
- A 32% decline from the 16 April 2026 close of 7,041 would imply an index level of approximately 4,788
That figure is not a forecast. It is an illustration of what the historical average would mean at today’s prices. Investors who dismiss recession warnings as abstract may find this framing more difficult to set aside.
Past performance does not guarantee future results. Financial projections are subject to market conditions and various risk factors.
The market is priced for the optimistic outcome. Here is what investors should actually be preparing for.
The bullish case that has powered the recovery is not baseless. It rests on specific supports:
- Q1 2026 earnings growth is forecast at approximately 12.6-13.2% year-over-year, reflecting corporate strength that predates the conflict.
- AI-driven capital spending continues to support valuations independent of near-term macro headwinds.
- Ed Yardeni has characterised geopolitical crises of this type as buying opportunities, a view consistent with the market’s historical tendency to recover from conflict-related selloffs.
The structural risk case sits alongside it:
- Moody’s Analytics puts recession probability at 48.6%, nearly a coin flip.
- Gasoline prices are at levels that have historically preceded an average 11% S&P 500 decline over six months.
- Even the favourable Morgan Stanley scenario leaves oil prices well above the January baseline for the remainder of the year.
- IMF Managing Director Kristalina Georgieva has urged caution, citing softened growth forecasts and explicit downside risks.
These two narratives are not mutually exclusive. The optimism is not wrong on its own terms, but it is incomplete. It prices in a swift resolution and a rapid return to trend growth without fully accounting for the structural energy price problem and the lagged economic damage already accumulating.
Questions investors should be asking about their current positioning
The question facing investors is not whether to be in or out of equities. It is whether current positioning reflects the range of plausible outcomes, including the scenario where recession materialises and the index retraces significantly.
Three questions are worth answering honestly: How concentrated is the portfolio in sectors most exposed to consumer spending compression? What is the realistic time horizon, and can it absorb a drawdown of 30% or more without forcing a sale? And is the current allocation one that was chosen deliberately for this environment, or one that was inherited from a different set of assumptions?
These statements are speculative and subject to change based on market developments and economic conditions.
A recovered index is not the same as a safe market
Market recovery and economic recovery are different things. The current environment is an example of the gap between them.
Three interlocking risks remain in play: an unresolved energy supply disruption with no confirmed timeline for resolution, institutional recession probability estimates running as high as 48.6%, and a historical precedent of 32% average drawdowns when recessions do materialise.
The next meaningful data points, including ceasefire developments, oil price trajectory, and GDP and employment readings, will clarify which scenario the economy is actually tracking toward. Investors who monitor those indicators alongside the index level, rather than relying on the index level alone, will be better positioned to distinguish between a market that has recovered and an economy that has not.
This article is for informational purposes only and should not be considered financial advice. Investors should conduct their own research and consult with financial professionals before making investment decisions.