Why Buffett Only Needed 5 Great Opportunities in 60 Years
11 hrs ago

Bank of Queensland earns $4.70 in annual profit for every $100 of shareholder equity. The sector average is more than double that figure. Yet the stock has attracted analyst buy cases in mid-2026. The disconnect between those headline numbers and the investment thesis surrounding them illustrates why valuing bank stocks requires more than a glance at a single ratio.
Regional bank stocks sit in an awkward space for Australian retail investors. They fall below the big four in scale and analyst coverage, yet carry similar complexity in their financial statements. Without a structured framework for reading the numbers, it is easy to dismiss a regional bank based on one weak metric, or to miss warning signs spread across several.
This guide explains three ratios used to evaluate any ASX-listed bank stock: Net Interest Margin (NIM), Return on Equity (ROE), and the Common Equity Tier 1 (CET1) capital ratio. It uses Bank of Queensland’s verified FY2025 and H1 FY2026 figures as a live worked example, then shows how these ratios feed into a Dividend Discount Model (DDM) valuation. By the end, the framework is portable to any banking stock on the ASX.
Standard equity valuation tools do not transfer cleanly to banks. A technology company’s revenue growth rate tells an investor something about demand for its products. A bank’s revenue growth rate tells far less, because a bank’s income is overwhelmingly a function of the spread between what it pays depositors and what it charges borrowers, not unit sales or pricing power in a conventional sense. BOQ generates approximately 93% of its income from net interest income alone, which means the lending margin is the single dominant earnings lever.
Price-to-earnings ratios, used in isolation, can also mislead. A bank’s earnings are shaped by provisioning decisions, capital allocation choices, and regulatory buffers that have no equivalent in most industrial companies. Dividends, not capital gains, are the primary return mechanism for Australian bank investors, which is why any valuation framework needs to assess dividend sustainability rather than growth trajectory.
Three ratios cover the three questions that matter most:
These three inputs ultimately feed into the DDM, which according to Rask Media is the preferred valuation method for ASX bank stocks given their high and consistent payout ratios.
NIM measures the spread between what a bank pays depositors and what it charges borrowers, expressed as a percentage of earning assets. A bank borrows cheap and lends at a higher rate; the difference, after adjusting for the size of its loan book, is the margin.
Several forces move NIM over time. The RBA cash rate cycle sets the baseline: when rates rise, banks can often reprice loans faster than deposits, temporarily widening margins. Competition for mortgages and term deposits pushes in the opposite direction, compressing spreads. The mix of fixed versus variable rate lending also matters; a book weighted toward fixed-rate loans locks in margins during rate rises but limits upside when rates fall.
BOQ’s income concentration: approximately 93% of total revenue comes from net interest income, making NIM the single most important metric for assessing this bank’s earnings power.
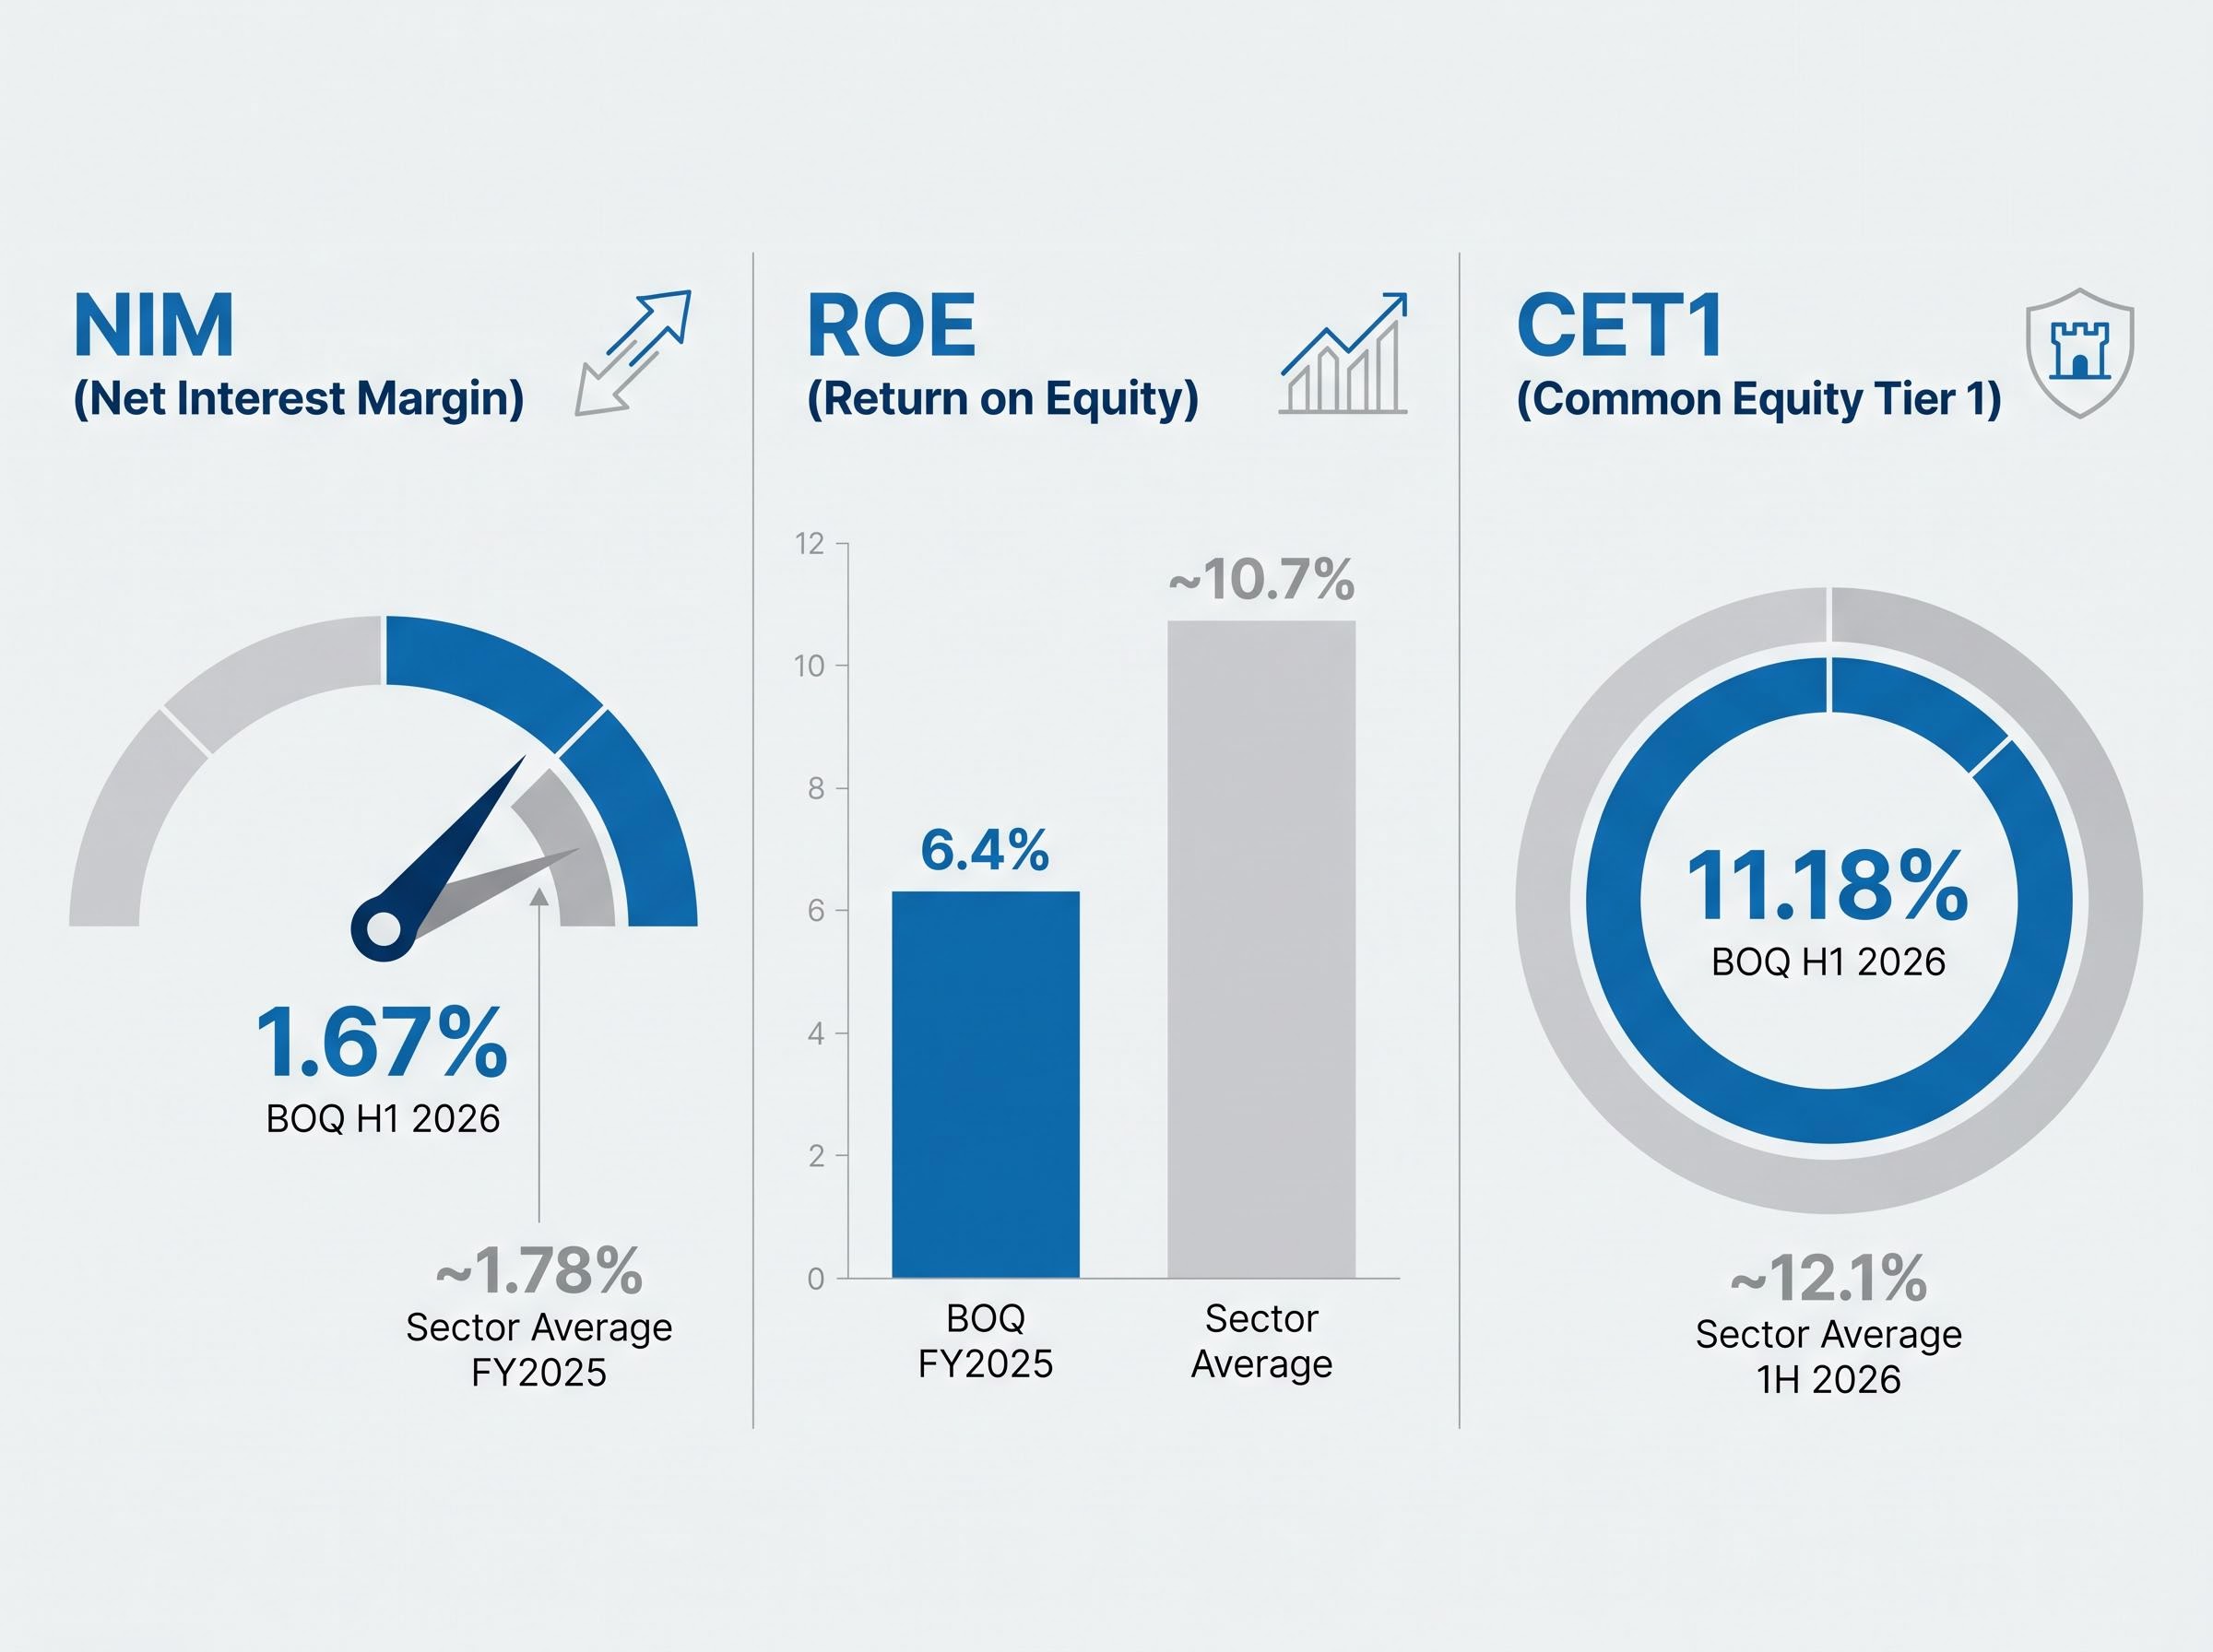
BOQ reported a NIM of 1.64% in FY2025, improving to 1.67% in H1 FY2026. That directional improvement signals margin management is moving in the right direction. Against the peer group, however, the gap remains visible.
| Bank | NIM (H1 2026) | Notes |
|---|---|---|
| CBA | 1.90% | Sector leader |
| WBC | 1.90% | Joint sector leader |
| NAB | 1.70% | Slightly above BOQ |
| ANZ | 1.60% | Below BOQ |
| BOQ | 1.67% | Improving from 1.64% (FY2025) |
| Sector Average (majors) | ~1.78% | FY2025 benchmark |
A reader who can track NIM trajectory will understand earnings direction before the profit headline is released. For a bank like BOQ, where lending dominates income so completely, even a few basis points of NIM improvement flows almost directly to the bottom line.
Regional bank NIM expansion does not always require scale: BNK Banking’s decision to shift its portfolio mix toward commercial lending and senior secured investments drove a 49-basis-point NIM improvement to 1.88% in its most recent half, demonstrating that a deliberate asset reallocation strategy can move the margin needle materially even for a lender operating well outside the big four.
ROE and CET1 answer different questions, but they sit in tension with each other. A bank can look safe while being a poor earner, or it can boost earnings by running its capital tighter. BOQ illustrates both sides of that tension simultaneously.
ROE measures the annual profit generated per dollar of shareholder equity. The numerator is net profit after tax; the denominator is the equity base. When ROE is consistently low relative to the sector, it signals a structural earnings gap rather than a one-year dip.
BOQ reported ROE of 6.4% in FY2025. The sector average, according to PwC Banking Matters (half-on-half to 2026), sits at approximately 10.7%. That gap is not marginal. It means BOQ is generating roughly 60 cents of profit for every dollar the sector average generates from the same equity base.
For valuation purposes, a structurally lower ROE justifies a higher required return assumption in a DDM. The bank is not deploying capital as efficiently, so an investor needs to price that underperformance into their expected return.
CET1 measures the proportion of risk-weighted assets backed by common equity, the highest quality capital a bank holds. APRA’s “unquestionably strong” framework requires major banks (classified as Domestic Systemically Important Banks, or D-SIBs) to maintain CET1 of at least approximately 10.5%, a figure built from a 4.5% minimum plus conservation and D-SIB buffers.
APRA Prudential Standard APS 110 sets the minimum CET1 ratio at 4.5% and adds a capital conservation buffer of 2.5%, with an additional 1.0% loading applied specifically to D-SIBs, which is why the effective threshold for the major banks sits materially above the nominal floor.
BOQ is not classified as a D-SIB but targets comparable levels. Its CET1 stood at 10.94% at FY2025 close and improved to 11.18% in H1 FY2026, above its own management target range. That provides a buffer against dividend cuts and regulatory intervention.
Against the major bank average of approximately 12.1% (per KPMG, 1H 2026), BOQ still sits lower. Individual major bank figures reinforce the spread.
| Bank | CET1 (H1 2026) | ROE Reference | Notes |
|---|---|---|---|
| ANZ | 13.3% | ~10.7% (sector avg) | Highest CET1 among majors |
| CBA | 12.3% | ~10.7% (sector avg) | Strong on both measures |
| NAB | 11.65% | ~10.7% (sector avg) | Above D-SIB minimum |
| WBC | 11.4% | ~10.7% (sector avg) | Closest major to BOQ on CET1 |
| BOQ | 11.18% | 6.4% (FY2025) | Above own target; below major avg |
| Sector Average (majors) | ~12.1% | ~10.7% | KPMG 1H 2026 benchmark |
The tension is visible in the table. BOQ’s CET1 is adequate, even comfortable, but its ROE remains well below the sector. Assuming a high CET1 signals strong earnings would be an error. Both ratios need to be read together.
A metric only means something in context. BOQ’s NIM of 1.67% is neither strong nor weak in absolute terms; it becomes informative when placed beside the sector average of 1.78%, the directional improvement from 1.64%, and the competitive dynamics of the current rate cycle.
The same applies to ROE (6.4% versus 10.7%) and CET1 (11.18% versus 12.1%). When a bank underperforms on all three measures simultaneously, it raises a specific set of analytical questions rather than triggering an automatic sell conclusion.
Three diagnostic questions to ask when a bank lags on multiple metrics:
Cost pressure context: BOQ’s cost-to-income ratio rose to 66.8% in FY2024, up from 58.0% in FY2023, indicating that transformation investment is compressing margins alongside the lending spread itself.
Supplementary indicators add further context. BOQ’s non-performing loans sit at just 0.13%, a credit quality reading that partially offsets the earnings gap. Its Liquidity Coverage Ratio (LCR) of 143% signals strong short-term liquidity. The benchmarking exercise is not a verdict; it is a structured way of identifying where to look deeper.
The BOQ share price discount relative to its DDM-derived fair value range is not a straightforward buy signal: a 430-basis-point ROE shortfall against the Big Four average and Fitch projections of a declining CET1 trajectory toward approximately 10.6% both represent structural headwinds that compress the upper end of any reasonable valuation estimate.
The Dividend Discount Model is the standard framework for valuing ASX bank stocks. Banks pay high, consistent dividends to an income-oriented investor base, which makes future dividend flows the natural basis for estimating what a bank is worth today.
The formula is straightforward:
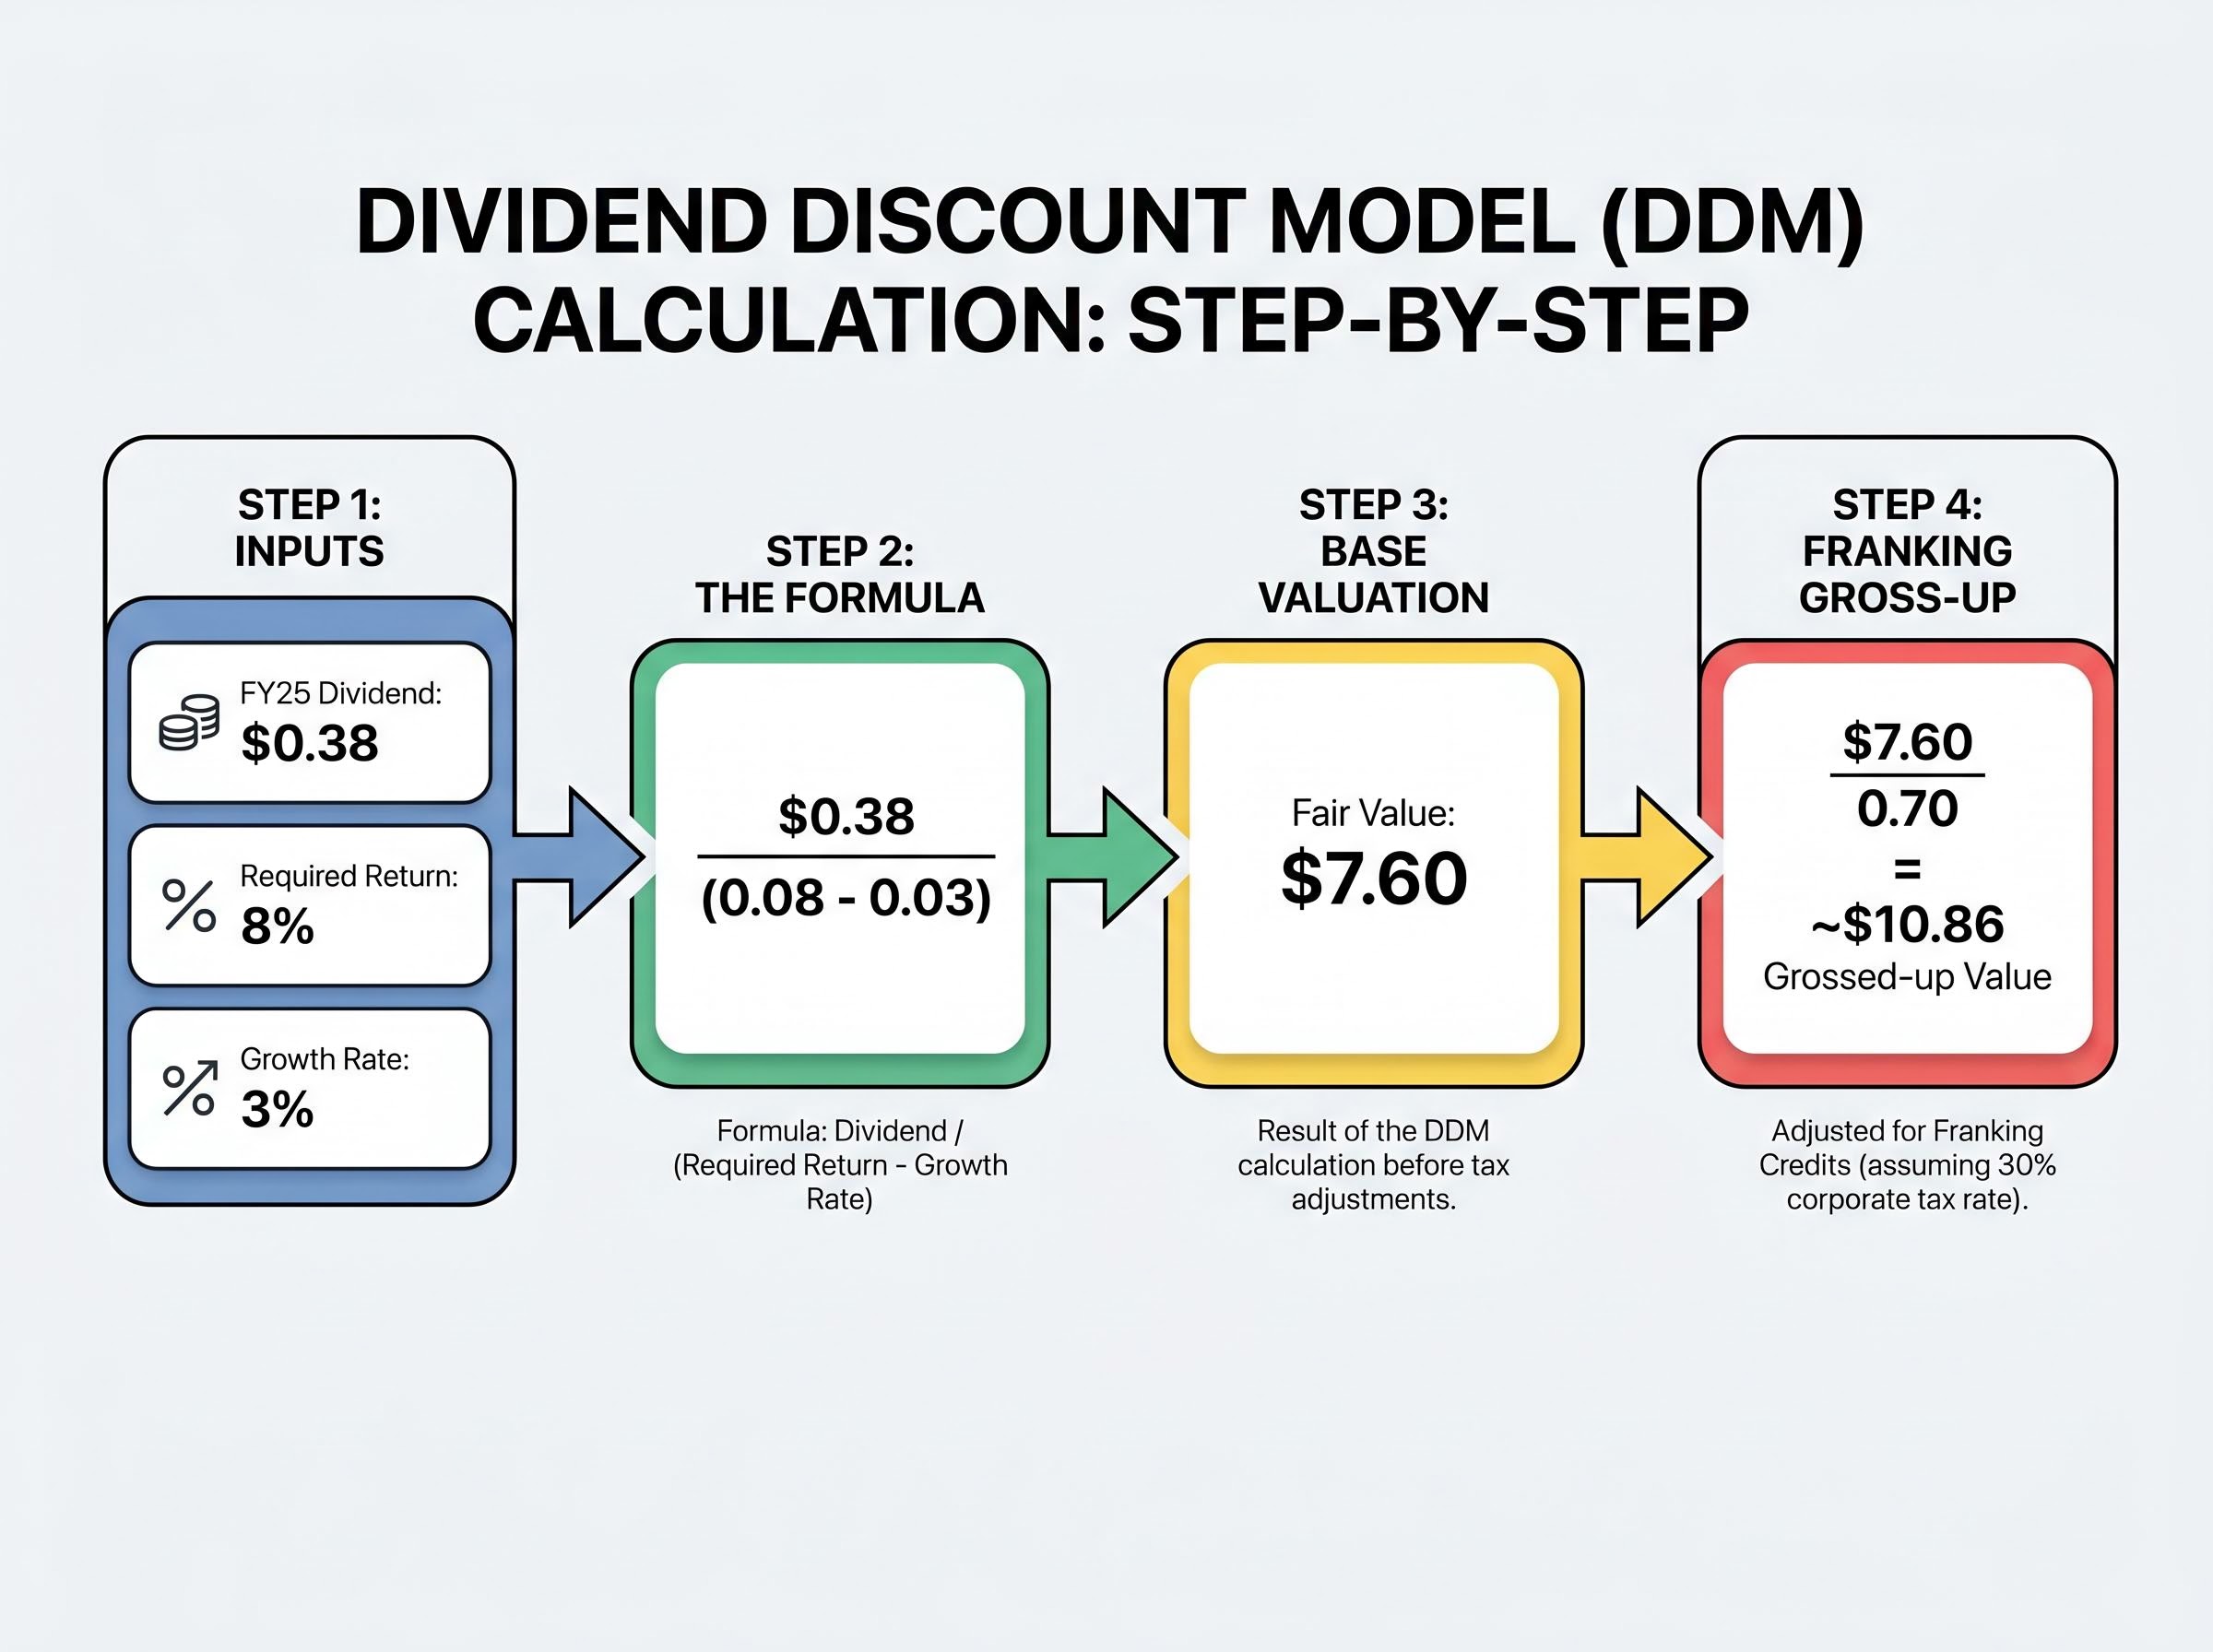
The formula: Fair Value = Annual Dividend / (Required Return Rate – Dividend Growth Rate).
Using a mid-case scenario of an 8% required return and 3% growth:
$0.38 / (0.08 – 0.03) = $0.38 / 0.05 = $7.60 indicative fair value.
The three ratios covered earlier enter directly here. NIM trajectory informs the growth rate assumption: improving NIM supports a case for dividend growth. ROE level informs the required return: BOQ’s 6.4% versus the sector’s 10.7% justifies a higher discount rate. CET1 adequacy determines the likelihood the dividend will be sustained, not cut.
The DDM sensitivity table below shows how assumptions shift the output.
| Required Return | 2% Growth | 3% Growth | 4% Growth |
|---|---|---|---|
| 8% | $6.33 | $7.60 | $9.50 |
| 9% | $5.43 | $6.33 | $7.60 |
| 10% | $4.75 | $5.43 | $6.33 |
| 11% | $4.22 | $4.75 | $5.43 |
With BOQ trading at approximately $6.14-$6.42 in May 2026, the mid-case DDM output of $7.60 suggests potential undervaluation, but the table also shows that a slightly higher required return or lower growth assumption compresses fair value below the current share price. Assumptions matter more than the formula.
Macro assumptions in bank valuations carry more weight than the formula itself: the same NAB model can produce a fair value range of $19.00 to $85.50 per share depending entirely on discount rate and growth assumptions, a spread that makes the sensitivity table in any DDM analysis a more important output than the mid-case figure sitting at the centre of it.
Analyst estimates for the H1 FY2026 forward dividend sit at approximately $0.35 per share, though this is an indicative estimate and not confirmed.
Australia’s dividend imputation system means fully franked dividends carry tax credits that reduce the investor’s personal tax liability. For a taxpaying Australian resident, the pre-tax value of a franked dividend is higher than the cash amount received.
The Parliamentary Budget Office guidance on franking credits explains how the imputation system attaches a tax credit to company dividends, allowing Australian resident shareholders to offset the corporate tax already paid against their personal income tax liability, which is the mechanism underpinning the grossed-up dividend calculation used in bank stock DDM models.
Franking gross-up formula: Grossed-up dividend = Cash dividend / (1 – corporate tax rate) = Cash dividend / 0.70
Applied to BOQ’s verified FY2025 dividend: $0.38 / 0.70 = $0.543 grossed-up dividend.
Applied to the mid-case DDM fair value: $7.60 / 0.70 = approximately $10.86 grossed-up fair value.
A common error is to multiply by 1.30 instead of dividing by 0.70. While directionally similar, the correct mathematical treatment is division by (1 – 0.30), which yields a slightly different figure and is the standard method used in financial analysis.
Past performance does not guarantee future results. Financial projections are subject to market conditions and various risk factors.
The BOQ case study has served its purpose. The framework beneath it is portable. Applied to any ASX-listed bank, the evaluation sequence runs as follows:
Alongside the quantitative ratios, several qualitative factors warrant inclusion in any long-term assessment:
BOQ’s mixed picture illustrates the framework in action. NIM and CET1 are improving (positive directional signals), ROE remains well below the sector (a structural gap), and a cost-to-income ratio of 66.8% represents an ongoing headwind. Non-performing loans at 0.13% provide a credit quality positive that a ratio-only framework might underweight. No single metric delivers the verdict; the framework does.
The opening question, why a bank earning $4.70 per $100 of equity still attracts buy cases, now has a structured answer. BOQ’s ROE is genuinely weak. Its NIM lags the sector. But both metrics are trending in the right direction, its balance sheet is above regulatory and internal targets, and a DDM incorporating franking credits produces a mid-case fair value above the current share price.
None of that constitutes a buy or sell recommendation. Every DDM output is only as reliable as its assumptions, and a shift of one or two percentage points in the required return rate transforms the conclusion entirely.
Sector-wide analyst consensus heading into mid-2026 provides an important reality check for any bottom-up DDM output: with all 14 analysts covering CBA rating it a sell at an average price target of $130.34 and unanimous bearish tilts across three of the four major banks, the gap between quantitative fair value estimates and market pricing appears to be a sector-level phenomenon rather than a feature unique to BOQ.
The practical next step: apply this framework to BOQ’s next ASX results release. Check whether NIM continued its improvement, whether ROE moved off 6.4%, and whether CET1 held above 11%. Then run the same exercise on a peer, whether that is one of the big four or a regional such as Bendigo and Adelaide Bank. APRA’s public capital framework documents and the ASX’s investor education resources provide deeper regulatory context for those who want to extend the analysis further.
This article is for informational purposes only and should not be considered financial advice. Investors should conduct their own research and consult with financial professionals before making investment decisions.
Net Interest Margin (NIM) measures the spread between what a bank pays depositors and what it charges borrowers, expressed as a percentage of earning assets. For banks like BOQ, where roughly 93% of revenue comes from net interest income, NIM is the single most important metric for assessing earnings power.
The Common Equity Tier 1 (CET1) ratio measures the proportion of risk-weighted assets backed by the highest quality capital a bank holds. APRA's framework requires major banks classified as Domestic Systemically Important Banks to maintain CET1 of at least approximately 10.5%, built from a 4.5% minimum plus conservation and D-SIB buffers.
Divide the annual dividend by the difference between your required return rate and your assumed dividend growth rate; for BOQ's verified FY2025 dividend of $0.38, a mid-case scenario using an 8% required return and 3% growth produces an indicative fair value of $7.60 per share. Australian resident investors can also gross up the dividend by dividing by 0.70 to account for the value of franking credits.
Fully franked dividends carry tax credits that reduce an investor's personal tax liability, making them worth more than the cash amount alone. The grossed-up value is calculated by dividing the cash dividend by 0.70 (reflecting the 30% corporate tax rate), so BOQ's $0.38 dividend becomes approximately $0.543 on a grossed-up basis.
ROE measures annual profit generated per dollar of shareholder equity, and a structural gap signals the bank is deploying capital less efficiently than peers. BOQ's FY2025 ROE of 6.4% sits well below the sector average of approximately 10.7%, which justifies using a higher required return assumption in a Dividend Discount Model valuation.