KOSPI Drops 10% as Crowded AI Trade Unwinds Across Global Markets
6 hrs ago

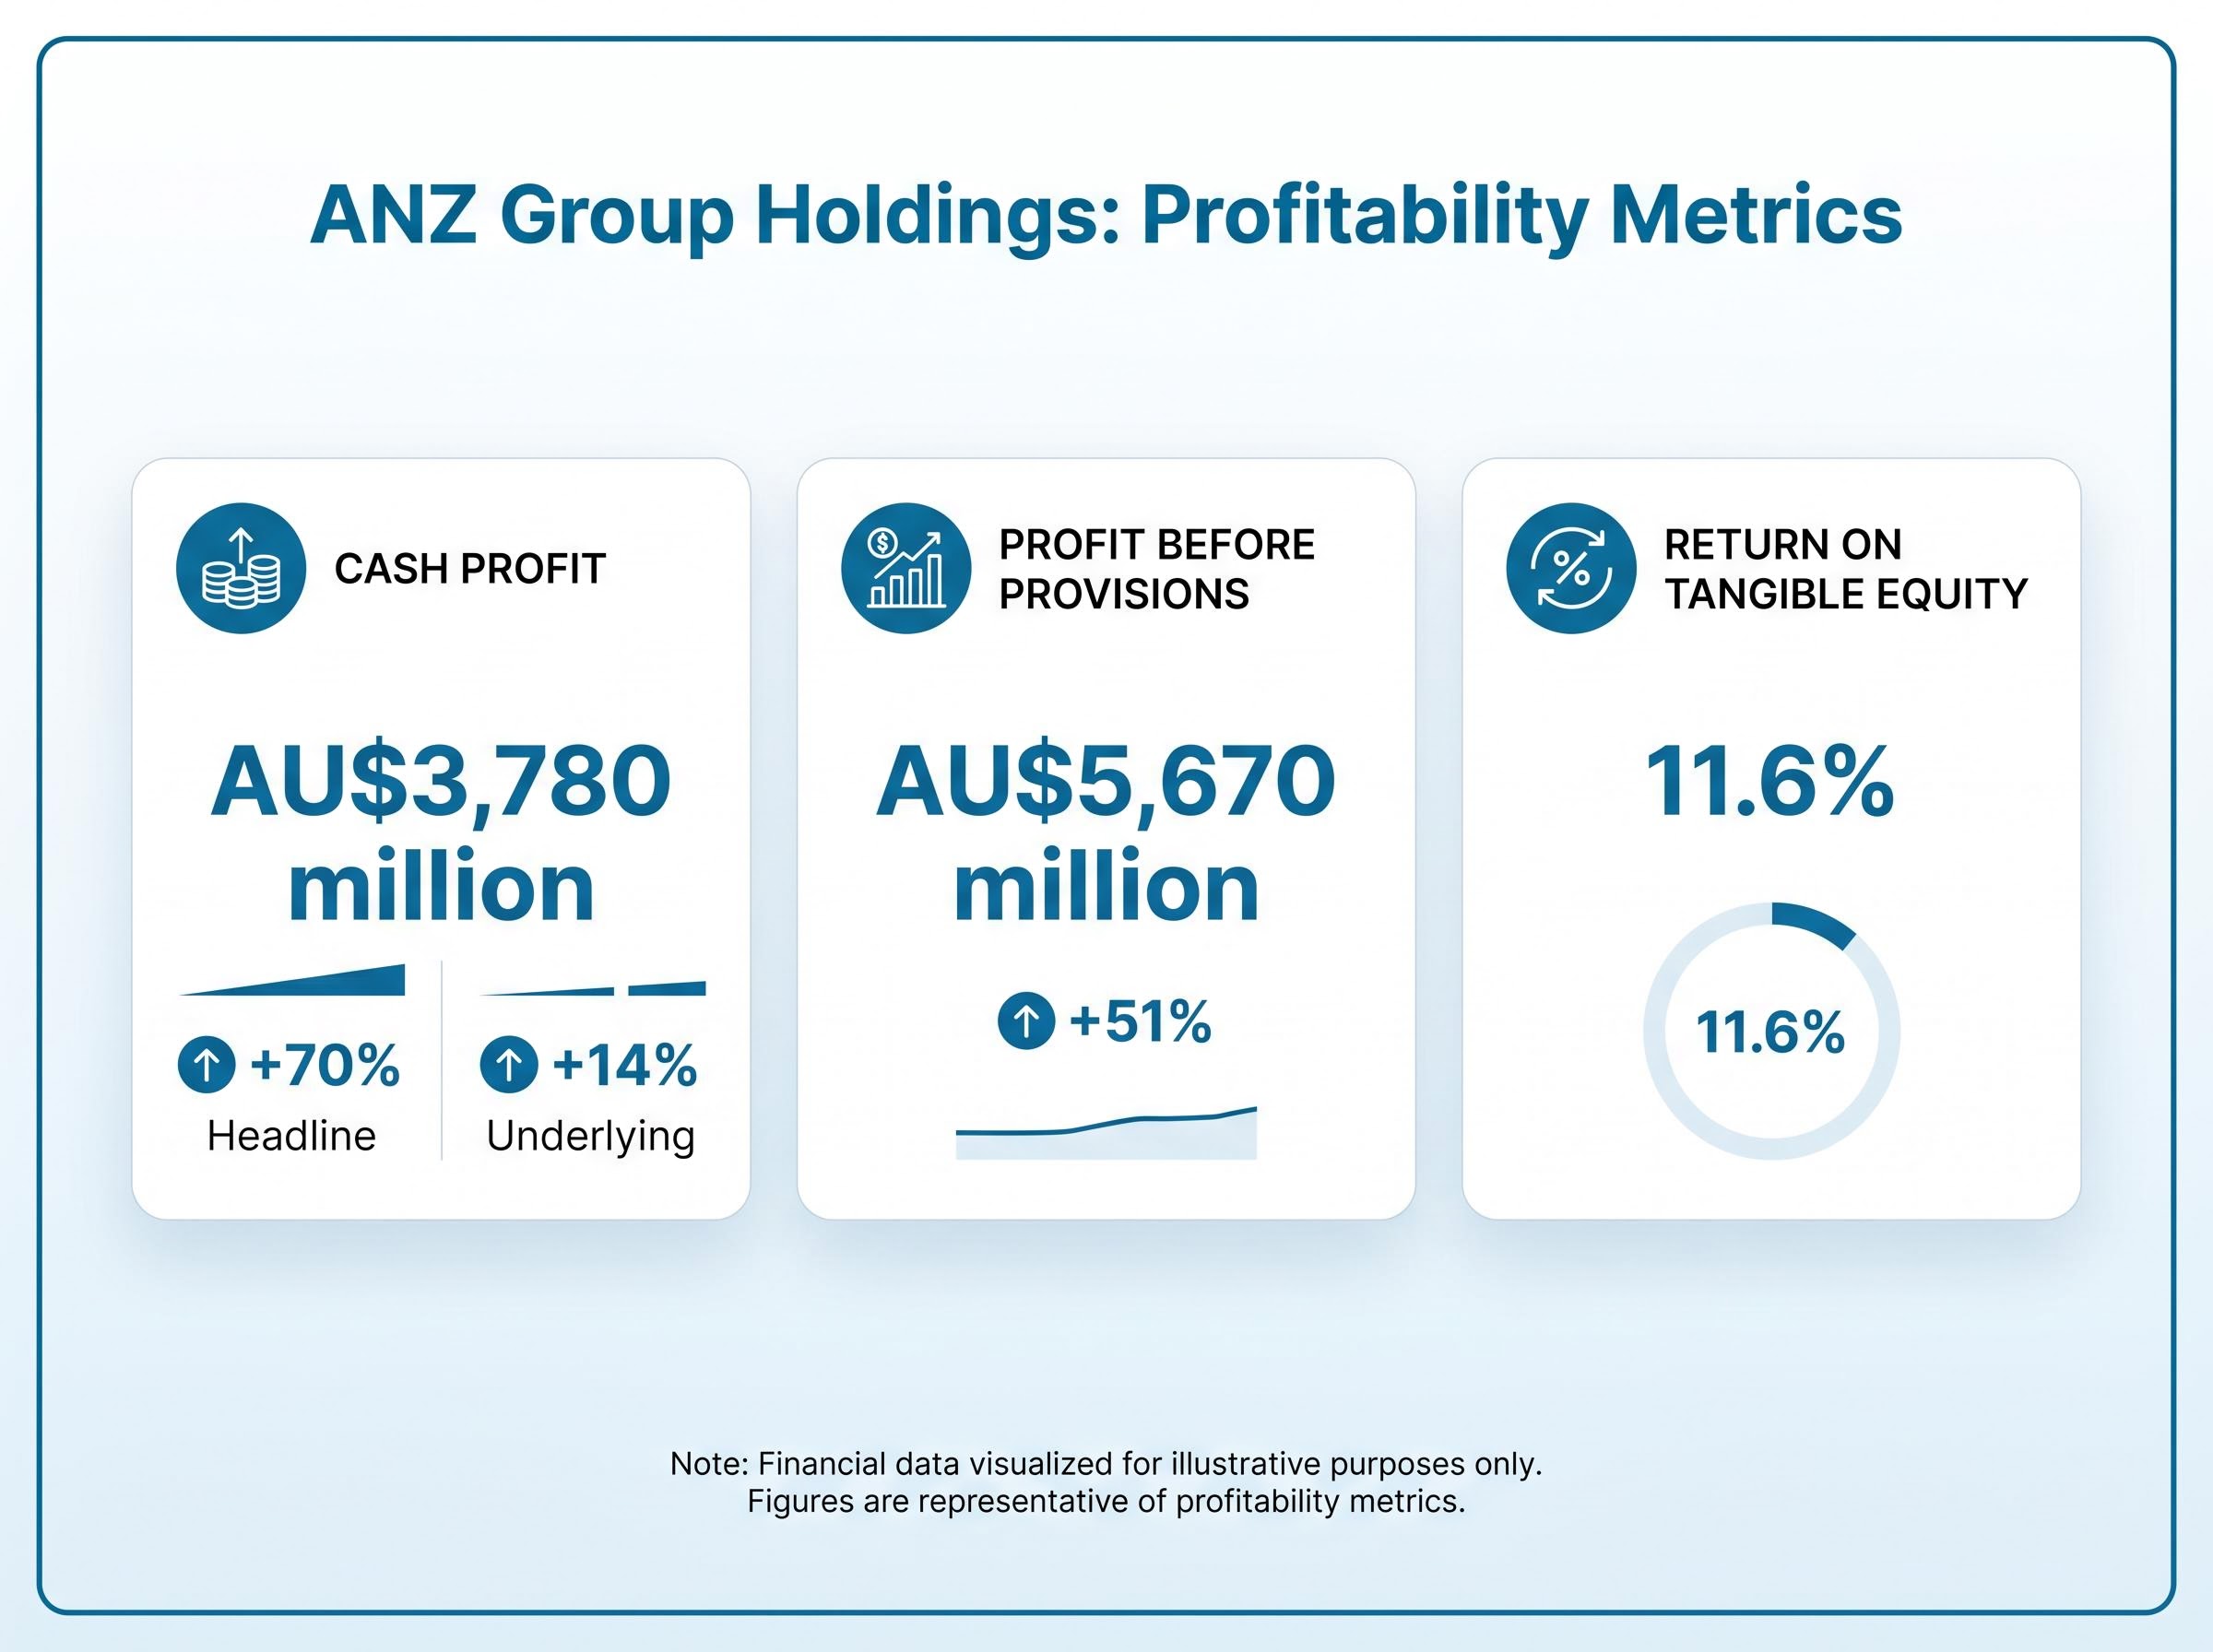
ANZ Group Holdings delivered a 70% surge in cash profit for the half-year ending 31 March 2026, reporting AU$3,780 million in a result that outpaced expectations and sent shares higher before the ASX had even opened for the day. The result arrives as Australian bank investors closely watch cost discipline and income diversification amid a competitive lending environment. ANZ’s outsized improvement relative to the prior half signals that its multi-year transformation programme is beginning to flow through to the bottom line in a material way. This article breaks down the headline numbers, explains what drove the improvement, covers the interim dividend and franking changes, and situates the result within ANZ’s broader strategic ambitions so readers understand both the scale and the durability of the gain.
The headline figure is striking: AU$3,780 million in cash profit, up 70% on the second half of FY2025. That number, taken alone, would suggest a bank firing on every cylinder. The reality is more nuanced.
CEO Nuno Matos characterised the result differently, pointing to underlying cash profit (excluding significant items) rising approximately 14%. The gap between the two figures reflects the resolution of prior-half significant items that had weighed on 2H FY2025, rather than a sudden operational leap of the magnitude the headline implies.
CEO Nuno Matos stated that the result showed improvement across all key financial metrics relative to 2H FY2025, with the underlying performance reflecting genuine progress across the business.
That said, operating momentum is real. Profit before provisions climbed 51% to AU$5,670 million, confirming that the bank’s revenue engine and cost discipline are both contributing, not just the absence of one-off charges.
For investors parsing the result, the distinction between the 70% headline and the 14% underlying figure is the most important calibration in the release. Understanding which gain is structural and which is a prior-period artefact is the starting point for forming a view on ANZ’s trajectory.
The distinction between structural earnings improvement and multiple expansion driving ANZ’s returns matters here: over five years to April 2026, the market re-rated ANZ to a FY26 P/E of approximately 14x even as statutory profit declined in FY25, meaning valuation sentiment has often led fundamentals rather than followed them.
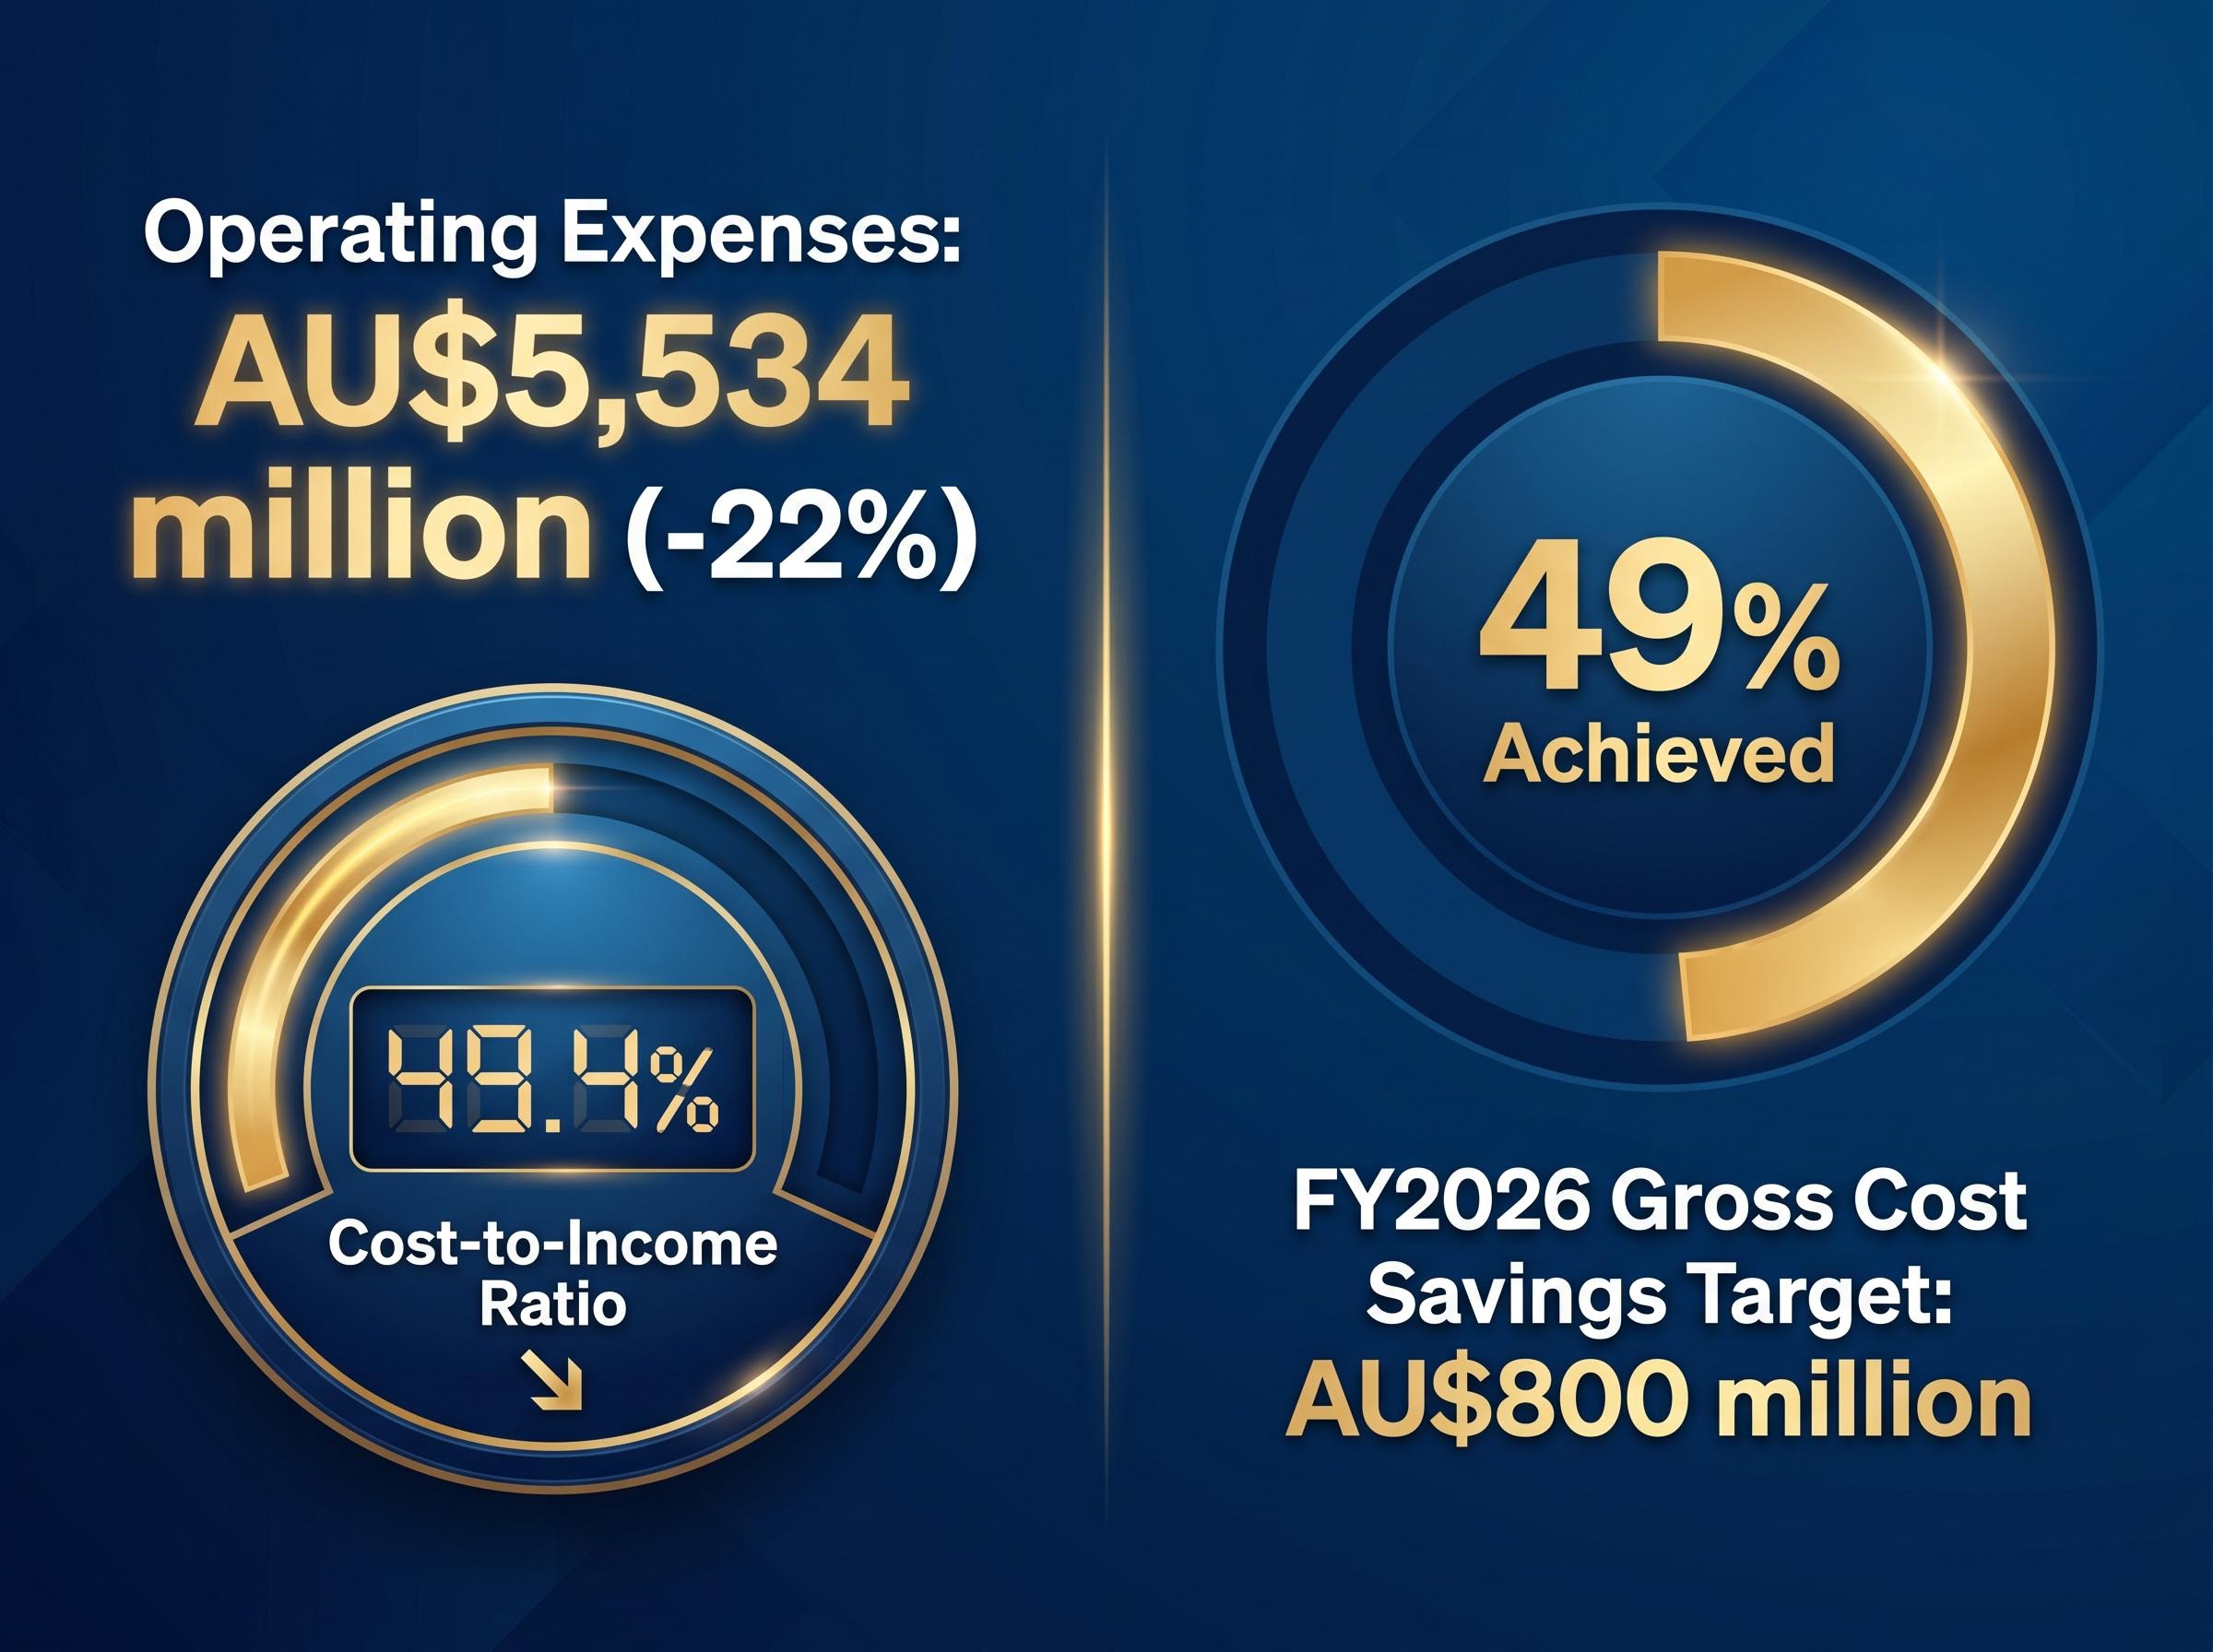
The cost story begins with a single number: operating expenses fell 22% to AU$5,534 million. Three forces drove the reduction:
Each of these is a discrete contributor, and together they produced a cost-to-income ratio of 49.4%, a figure that carries weight because it crosses a threshold the major Australian banks have long targeted.
The cost-to-income ratio measures the proportion of a bank’s operating expenses relative to its total operating income, expressed as a percentage. A lower ratio signals a more efficient bank: it costs less to generate each dollar of revenue. Australian major banks typically target ratios below 50%, making ANZ’s 49.4% a meaningful crossover into that territory.
The improvement is not yet complete. ANZ has achieved 49% of its AU$800 million gross cost savings target for FY2026, meaning more than half the programme’s benefits are still ahead. For investors, this signals that cost discipline has further room to contribute to earnings in the second half, provided execution continues at this pace.
PwC’s major bank half-year benchmarking for 1H25 showed the Australian majors collectively struggling to break below the 50% cost-to-income threshold, making ANZ’s 49.4% result in 1H26 a notable crossover relative to recent sector-wide performance.
Total operating income rose 3% to AU$11,204 million, a modest headline that conceals two sharply divergent forces underneath.
Net interest income, the traditional earnings engine for any bank, fell 2% to AU$8,888 million. Rate competition and margin compression pulled in one direction. Non-interest operating income surged 28% to AU$2,316 million, pulling in the other. The net effect was positive, but the composition matters: ANZ engineered a revenue gain not by growing its core lending margin but by expanding the income streams around it.
| Income Line | 1H26 Value (AU$ million) | Half-on-Half Change |
|---|---|---|
| Total Operating Income | 11,204 | +3% |
| Net Interest Income | 8,888 | -2% |
| Non-Interest Operating Income | 2,316 | +28% |
Total provision charges came in at AU$274 million, down from AU$296 million in the prior half, suggesting overall credit quality remains stable. Within that figure, however, sits a discrete item worth noting.
ANZ booked an AU$175 million provision charge for potential financial impacts of the Middle East conflict, a one-off credit charge embedded in the half that investors should consider separately from underlying credit trends.
A bank growing non-interest income at 28% while managing a decline in net interest income demonstrates revenue resilience. For investors assessing how ANZ will perform if the rate environment continues to compress margins, the diversification story is the one that underpins durability.
The interim dividend came in at 83 cents per share, matching the FY2025 final dividend. The signal is consistency rather than growth: management held the payout steady, reinforcing earnings stability.
The more meaningful change sits in the franking. ANZ lifted the franking level from 70% to 75%, a shift that improves the after-tax value of the dividend for Australian shareholders who can claim the associated tax credit.
CEO Nuno Matos attributed the franking increase to stronger performance in ANZ’s Australian operations, noting that improved domestic earnings supported a higher proportion of franking credits.
For the many Australian retail investors who hold ANZ for income and value the franking credit system, a flat dividend with rising franking is a net positive. The cash amount is unchanged, but the after-tax return improves. That distinction matters more to income-focused portfolios than a headline dividend increase would.
For income investors weighing whether ANZ’s dividend is competitive, a grossed-up yield comparison across the Big Four at the same point in April 2026 put ANZ’s franking-adjusted yield at approximately 5.95%, ahead of CBA’s 4.10% but marginally behind NAB’s 6.06%, a spread that reflects the combined effect of headline yield, payout ratio, and franking level.
The Parliamentary Budget Office guidance on franking credits explains how the dividend imputation system allows eligible Australian shareholders to offset the corporate tax already paid by a company against their personal tax liability, which is why a franking level increase from 70% to 75% translates directly into a higher after-tax return for domestic income investors.
ANZ shares (ASX: ANZ) traded up more than 1% to AU$37.11 on 1 May 2026, a positive but measured market response. The reaction suggests investors view the result as confirmation of progress rather than a catalyst for re-rating, consistent with the underlying 14% improvement being the number the market prices off rather than the 70% headline.
ANZ’s 2026 share price volatility in the months preceding this result, including an 11% surge on Q1 earnings and a subsequent 10% selloff driven by geopolitical risk premiums rather than company-specific news, provides the broader trajectory within which this 1% post-result move should be read.
Management framed the result within a broader strategic context, characterising execution against five immediate priorities as safe, sustainable, and on schedule:
CEO Nuno Matos stated that the bank is already producing materially improved returns for shareholders, positioning the half-year result as evidence of a sustained improvement cycle rather than a single-period anomaly. The question for the market is whether the second half can maintain the trajectory the first half established.
The 70% headline is attention-grabbing. The 14% underlying improvement is the figure that matters for assessing where ANZ is headed. Three structural drivers, cost discipline that has delivered nearly half of an AU$800 million savings programme, income diversification that offset margin pressure, and higher franking that improved shareholder returns without increasing the payout, suggest the improvement has durability beyond a single half.
The valuation case for ASX bank shares sits awkwardly alongside strong earnings: Morgans’ late April 2026 sell ratings across the sector were anchored on the observation that record profits had been met with higher share prices, pushing P/E multiples further above historical averages rather than closing the gap to analyst targets.
With 51% of gross cost savings still to be achieved in 2H FY2026, and the ANZ 2030 framework setting ambitions that extend well beyond the current year, the question for investors shifts from whether this half was strong to whether the second half can consolidate the momentum. The structural pieces are in place. Execution will determine whether they hold.
This article is for informational purposes only and should not be considered financial advice. Investors should conduct their own research and consult with financial professionals before making investment decisions.
ANZ Group Holdings reported cash profit of AU$3,780 million for the half-year ending 31 March 2026, up 70% on the prior half, while underlying cash profit (excluding significant items) rose approximately 14%, reflecting genuine operational improvement alongside the resolution of prior-period charges.
The 70% headline figure includes the reversal of significant items that had weighed on the second half of FY2025, whereas the 14% underlying figure strips those out to show the actual operational progress; the 14% number is the more reliable indicator of ANZ's ongoing earnings trajectory.
ANZ declared an interim dividend of 83 cents per share, payable on 1 July 2026, matching the FY2025 final dividend; the franking level was lifted from 70% to 75%, improving the after-tax return for eligible Australian shareholders without increasing the cash payout.
ANZ has achieved 49% of its AU$800 million gross cost savings target for FY2026, meaning more than half of the programme's benefits remain to be realised in the second half, providing a continuing tailwind for earnings if execution stays on track.
Rate competition and margin compression pushed net interest income down 2% to AU$8,888 million, while ANZ grew non-interest operating income by 28% to AU$2,316 million through income diversification, demonstrating that the bank offset margin pressure by expanding revenue streams beyond traditional lending.