
ANZ Dividend Holds at 83 Cents as Profit Surge Masks Weak Revenue
4 mins ago

ANZ Group Holdings shares closed at AU$36.65 on 1 May 2026, one cent below the average analyst consensus price target of AU$36.66 from 14 covering analysts. That one-cent gap carries a message: the market believes the easy gains from ANZ’s transformation have already been priced in, and what remains is execution against a multi-year programme with specific, measurable deadlines.
The bank’s 1H FY2026 results, released today, showed a 70% cash profit surge to AU$3,780 million and a 22% fall in operating expenses. Strip out significant items, however, and underlying cash profit rose a more measured 14%. The headline numbers flatter the story. The real question for investors is not what just happened but what the ANZ 2030 programme is designed to deliver next, and whether the current share price already reflects its success.
This analysis works through ANZ’s financial results, strategic architecture, cost savings scorecard, integration programmes, and valuation positioning to build a milestone-driven framework for evaluating the stock across the next three years.
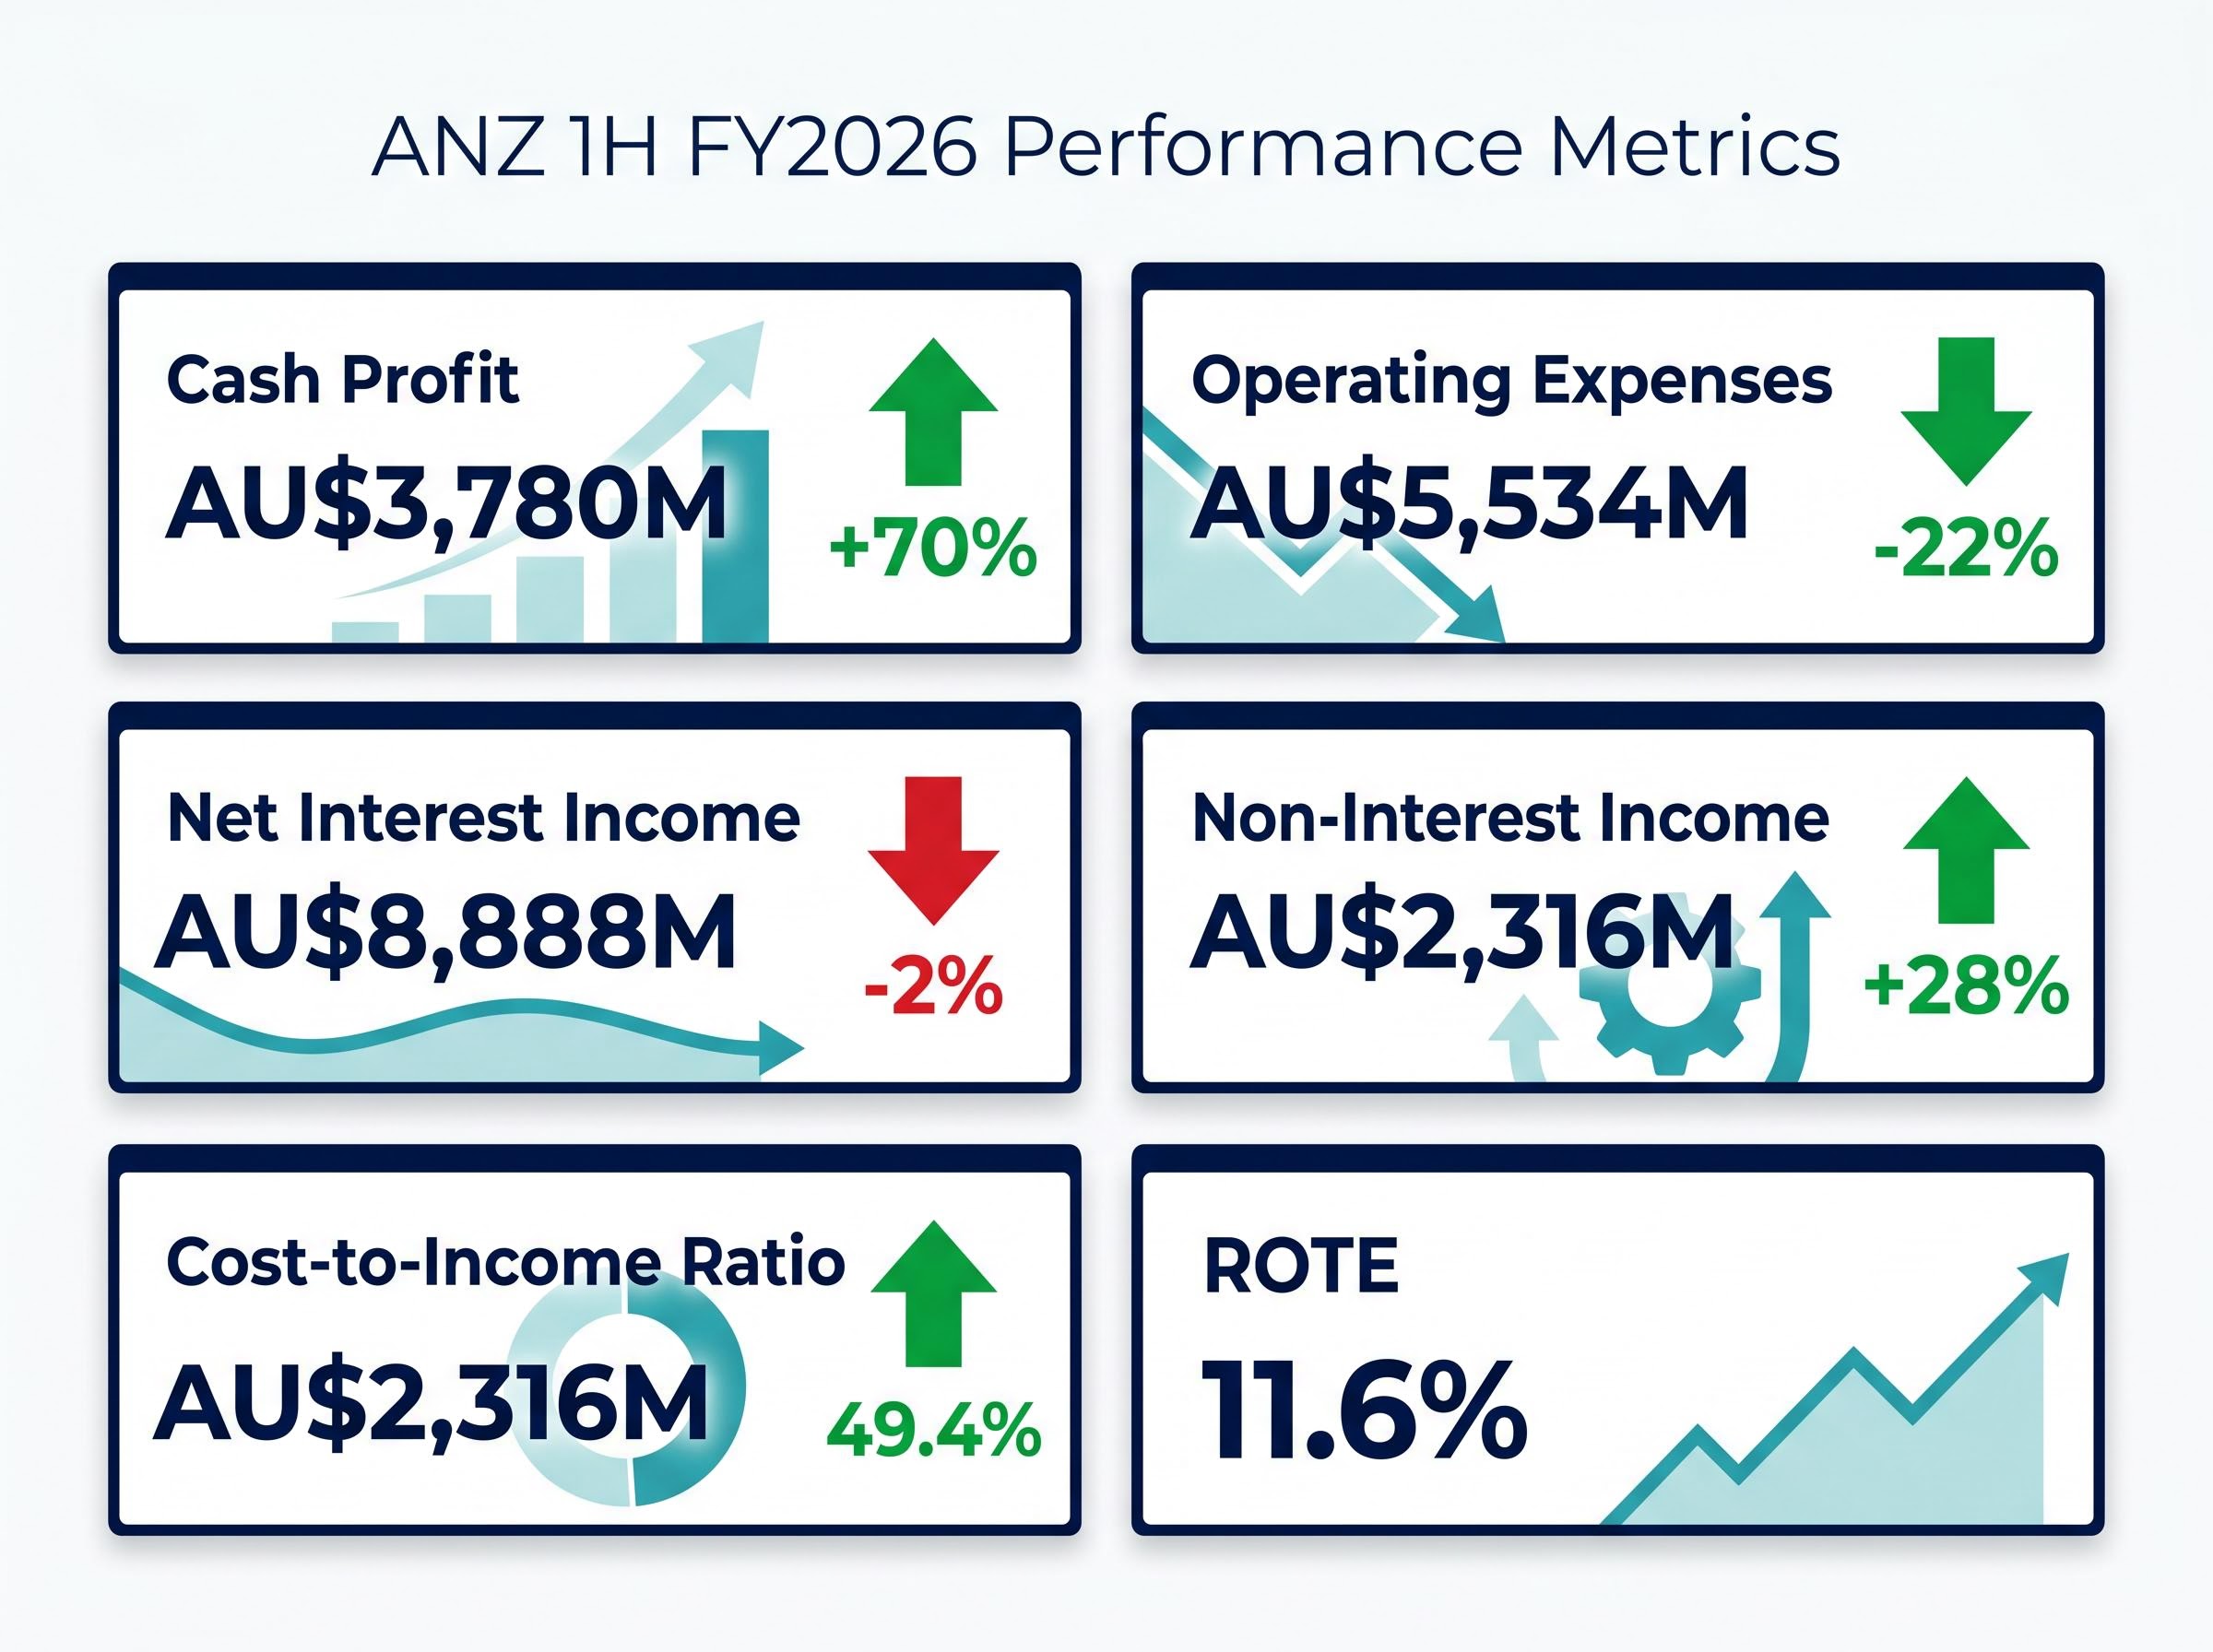
A 70% increase in cash profit commands attention. ANZ reported AU$3,780 million for the half ended 31 March 2026, and profit before provisions surged 51% to AU$5,670 million. But the underlying cash profit, stripped of significant items including provisioning adjustments and regulatory charges, rose approximately 14%. The gap between those two figures is where the analytical precision matters.
CEO Nuno Matos stated that all key financial metrics improved relative to 2H FY2025, describing the results as evidence that the bank’s transformation is “executing safely, sustainably, and on time.”
Total operating income rose 3% half-on-half to AU$11,204 million, yet net interest income actually declined 2% to AU$8,888 million. The income mix shift is material: non-interest income surged 28% to AU$2,316 million, while operating expenses fell 22% to AU$5,534 million. Those two levers, not headline profit, represent the genuine structural improvement.
| Metric | 1H FY2026 | 2H FY2025 | Change |
|---|---|---|---|
| Cash profit | $3,780M | $2,224M | +70% |
| Total operating income | $11,204M | $10,877M | +3% |
| Net interest income | $8,888M | $9,069M | -2% |
| Non-interest income | $2,316M | $1,808M | +28% |
| Operating expenses | $5,534M | $7,093M | -22% |
The cost-to-income ratio sits at 49.4%, and Return on Tangible Equity (ROTE) came in at 11.6%. Both figures matter more than cash profit as ongoing performance indicators, and both will form the basis for tracking whether ANZ’s transformation is generating sustainable returns.
Big Four sector performance in 2026, where the ASX 200 Financials index gained 8.87% year to date on momentum that analysts broadly describe as disconnected from underlying valuation fundamentals, provides the broader market backdrop within which ANZ’s individual transformation story is playing out.
The 1H FY2026 results are not isolated events. They are the first major scorecard for a deliberate strategic programme announced by CEO Nuno Matos on 13 October 2025 and structured around a five-year transformation with two distinct phases.
The four pillars supporting the framework, Customer First, Simplicity, Resilience, and Delivering Value, are not marketing categories. They map directly to operational decisions: simplifying duplicated processes, accelerating technology migration, improving compliance infrastructure, and redirecting capital toward higher-returning activities.
Five immediate priorities sit beneath this architecture:
The distinction between Phase 1 (FY26-FY27) and Phase 2 (FY28-FY29) is not cosmetic. Phase 1 is explicitly about productivity and getting the basics right. The growth and outperformance thesis is a Phase 2 story, meaning management’s own targets for market-beating returns do not begin until FY2028 at the earliest.
Capital management actions reinforce this sequencing. ANZ has ceased approximately AU$800 million in share buybacks, is returning approximately AU$1 billion in surplus capital, and is offering a 1.5% DRP discount on the next two plans. These are tools calibrated for a restructuring environment, not a growth environment. Investors with shorter time horizons need to price that reality into their expectations.
ANZ has committed to AU$800 million in pre-tax annual gross cost savings for FY2026, supported by 3,500 role reductions by September 2026. These are the two most concrete near-term accountability markers the bank has set for itself.
As of the 1H FY2026 results, ANZ reports achieving 49% of the gross cost savings goal. The operating expense decline of 22% to AU$5,534 million confirms that savings are already flowing through reported financials.
49% of the AU$800 million cost savings target has been achieved as of 1H FY2026. The remaining 51% must be delivered by September 2026 for the programme to hit its full-year objective.
The remaining 51% must be delivered in the second half. Whether ANZ closes that gap is one of the clearest binary checkpoints available before the FY28-FY29 growth thesis is tested. Three observable outputs should be monitored at the next results release:
These two programmes represent the bulk of ANZ’s growth optionality. They share priority status under ANZ 2030 but carry different risk profiles and operate on different timelines.
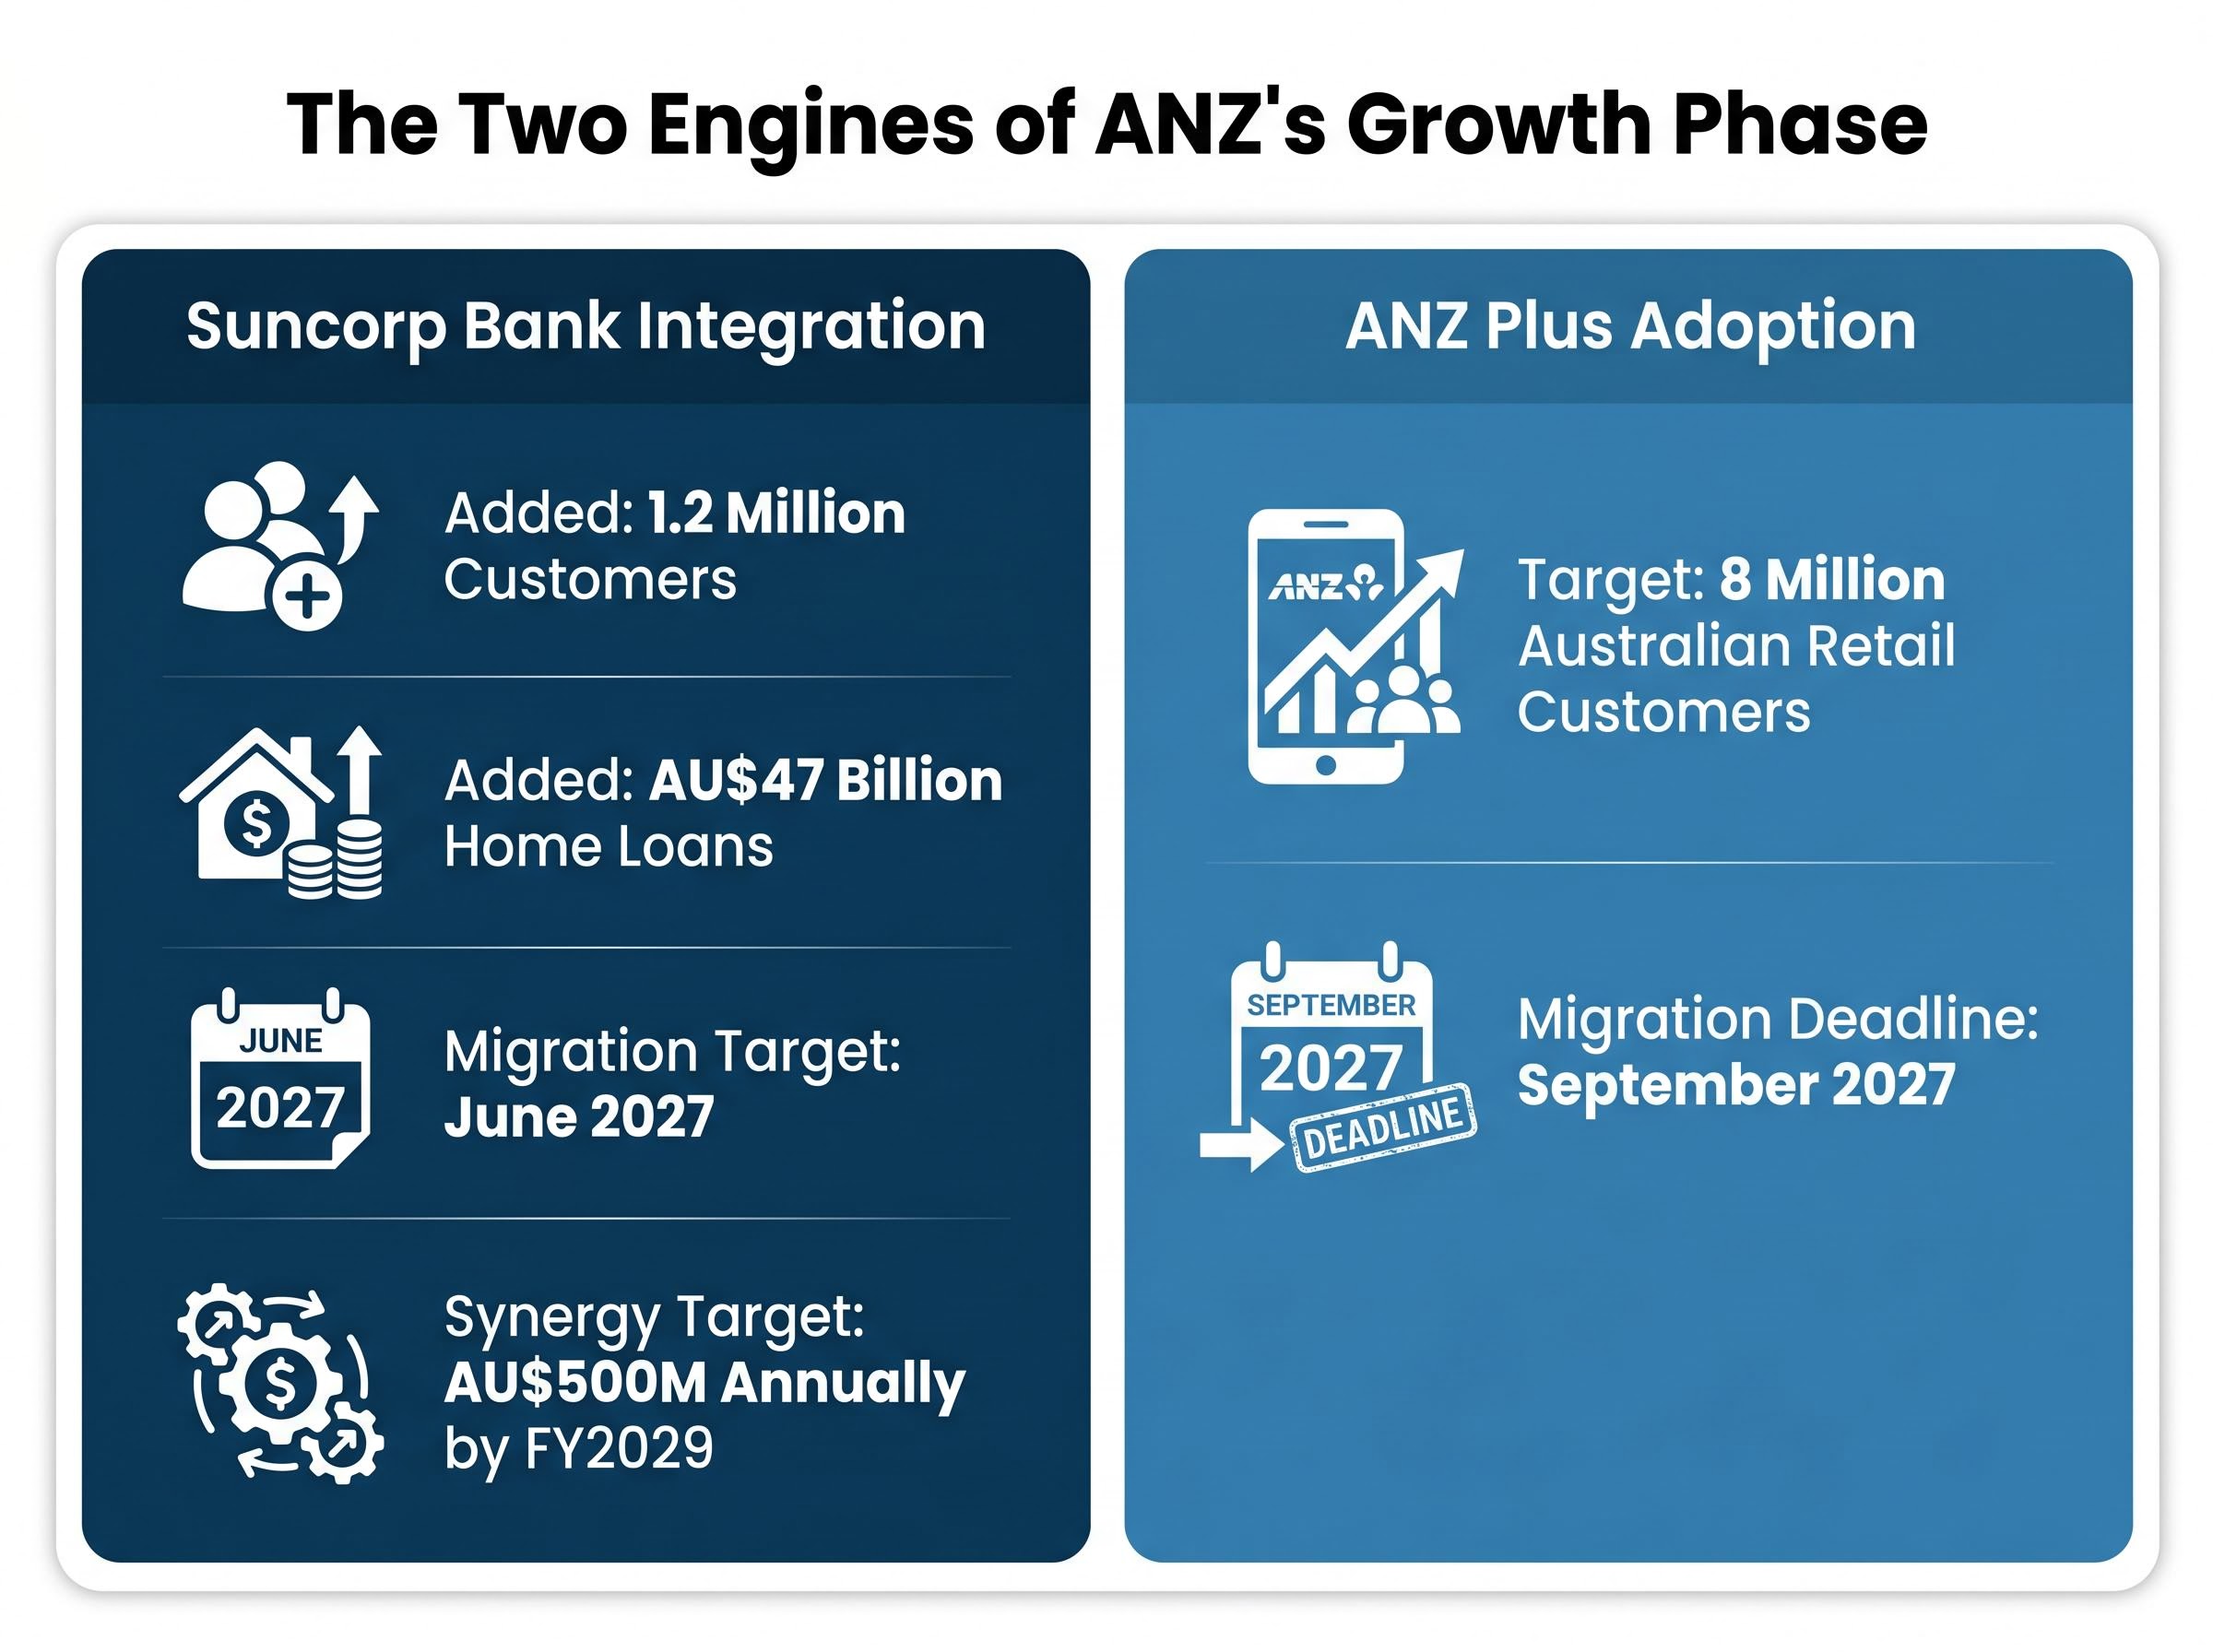
The Suncorp Bank acquisition added 1.2 million customers and AU$47 billion in home loans to ANZ’s balance sheet. Integration synergies are tracking to plan, with migration completion targeted for June 2027 and AU$500 million in annual cost synergies targeted by FY2029.
That FY2029 synergy target means the full return on the acquisition will not be measurable until four years after close. Investors should treat integration cost disclosures at each half-year result as a leading indicator of whether the synergy trajectory is on track or under pressure.
ANZ Plus is ANZ’s digital front-end strategy, targeting migration of 8 million Australian retail customers by September 2027. Its role is to reduce legacy technology complexity while improving the customer experience across retail and small business banking.
Current ANZ Plus user numbers are not publicly confirmed in available sources, making this the least transparent element of the two-programme picture. Investors should monitor the half-year results supplement for adoption disclosures, as the gap between the 8 million target and actual uptake will determine whether the digital strategy is on schedule.
| Programme | Key metric | Target | Deadline | Risk type |
|---|---|---|---|---|
| Suncorp integration | Annual cost synergies | $500M | FY2029 | Integration execution |
| ANZ Plus | Customer migration | 8 million | September 2027 | Adoption and technology delivery |
ANZ closed at AU$36.65 on 1 May 2026, after touching AU$37.11 intraday on results day for a gain of more than 1%. The average price target from 14 analysts covering the stock sits at AU$36.66, with a consensus rating of HOLD: 6 Buy, 5 Hold, 3 Sell.
ANZ’s 2026 price swings, including an 11% surge following the Q1 earnings beat and a subsequent 10% selloff driven entirely by geopolitical factors rather than any company-specific announcement, establish the volatility baseline against which the 1H FY2026 result and current one-cent discount to consensus should be read.
A share price of AU$36.65 against a consensus target of AU$36.66 implies the market has priced in current transformation expectations. Upside from here depends on execution exceeding those expectations, not on the strategy itself.
The HOLD consensus reflects three offsetting factors. On the bull side:
On the bear side:
Non-financial risk management remains an explicit immediate priority under ANZ 2030, an acknowledgement that compliance and operational risk improvement is still required. For investors, this means the quality of execution over the next two results cycles, rather than the strategy itself, becomes the primary determinant of whether upside is available from current levels.
Investors wanting to understand why ANZ carries the only buy-skewed consensus among its peers will find our dedicated guide to ANZ’s position among the Big Four, which covers the CET1 capital ratios, dividend yield comparisons, and sell-rating rationale across CBA, NAB, and Westpac that collectively explain why analysts treat ANZ as the sector exception heading into the growth phase.
ANZ’s restructuring follows a pattern common to major bank transformations, and understanding the mechanics makes it possible to read any large bank’s results with greater precision. Three metrics anchor this type of analysis:
Front-loading cost reduction serves three purposes. It frees capital for reinvestment in growth initiatives, reduces organisational complexity before large-scale technology migrations, and creates a cleaner baseline against which growth-phase performance can be measured.
ANZ’s explicit FY26-FY27 versus FY28-FY29 phasing illustrates the trade-off. Ceasing AU$800 million in buybacks and redirecting capital toward funding the Suncorp integration and ANZ Plus rollout is a decision to accept lower near-term shareholder returns in exchange for a stronger growth platform. The AU$175 million Middle East conflict provision in the results further demonstrates how non-financial risks can absorb capital that would otherwise be available for returns.
The analytical value of this framework crystallises when mapped against specific reporting dates. Rather than holding a static view on ANZ, investors can evaluate the stock at each results announcement against defined checkpoints.
| Milestone | Target date | What to watch |
|---|---|---|
| Cost savings programme completion | September 2026 | Whether full $800M target is met; headcount at 3,500 reduction |
| Suncorp migration completion | June 2027 | Integration cost disclosures; customer retention rates |
| ANZ Plus rollout target | September 2027 | Confirmed adoption numbers against 8 million target |
| Suncorp annual synergies | FY2029 | Whether $500M annual run-rate is achieved |
| Phase 2 growth targets | FY2028-FY2029 | ROTE improvement; cost-to-income ratio trajectory; revenue growth |
CEO Nuno Matos stated the bank is “already producing materially improved returns for shareholders” as a result of transformation efforts.
The near-term test is the September 2026 cost savings deadline. If ANZ delivers the remaining 51% of its AU$800 million target, management’s “ahead of schedule” claim holds. If it falls short, the credibility of the FY28-FY29 growth phase weakens before it begins.
The core finding of this analysis is not that ANZ’s 1H FY2026 results were strong. It is that the strategy is time-bound and milestone-driven, and that current pricing at AU$36.65 reflects expectations already embedded by the 14 analysts covering the stock.
The risk framework operates across three layers. Near-term: whether the cost programme closes its remaining 51% gap by September 2026. Medium-term: whether Suncorp migration and ANZ Plus adoption hit their 2027 targets. Long-term: whether the FY28-FY29 growth phase delivers the outperformance that justifies the capital trade-offs made today.
The next two half-year results (2H FY2026 and 1H FY2027) will be the most informative periods for assessing whether ANZ’s transformation is tracking or slipping. Cost-to-income ratio, ROTE, and integration disclosures are the primary signals. Investors evaluating their ANZ position may benefit from bookmarking these milestone dates and revisiting the analysis following the 2H FY2026 results release.
Investors exploring the bear case in more depth will find our full explainer on Big Four provisioning risks, which examines Morgans’ sector-wide sell ratings, the forecast rise in total bank provisions from approximately AU$2.4 billion in FY25 to AU$5.5 billion by FY27, and how worsening credit conditions tied to housing and Stage 3 loan stress could compress the earnings recovery embedded in ANZ’s current price target.
This article is for informational purposes only and should not be considered financial advice. Investors should conduct their own research and consult with financial professionals before making investment decisions. Past performance does not guarantee future results. Financial projections are subject to market conditions and various risk factors.
As of 1 May 2026, the average analyst consensus price target for ANZ Group Holdings is AU$36.66, based on 14 covering analysts, with a HOLD consensus made up of 6 Buy, 5 Hold, and 3 Sell ratings.
ANZ has achieved 49% of its AU$800 million pre-tax annual gross cost savings target as of 1H FY2026, with the remaining 51% required by September 2026 for the programme to meet its full-year objective.
ANZ 2030 is a five-year strategic transformation announced in October 2025, structured in two phases: Phase 1 (FY2026-FY2027) focuses on productivity and cost reduction, while Phase 2 (FY2028-FY2029) targets market-beating growth and outperformance.
The Suncorp acquisition added 1.2 million customers and AU$47 billion in home loans, with AU$500 million in annual cost synergies targeted by FY2029, meaning the full return on the acquisition will not be measurable until four years after close.
Investors should monitor the AU$800 million cost savings completion by September 2026, Suncorp migration completion by June 2027, ANZ Plus adoption against its 8 million customer target by September 2027, and Phase 2 ROTE and revenue growth targets across FY2028-FY2029.


