
ANZ Raises Franking to 75% as Dividend Holds at 83 Cents
2 mins ago

Apple posted $111bn in quarterly revenue, Eli Lilly’s EPS surged 156% year-over-year, and Caterpillar beat earnings estimates by 20%. All three reported on the same trading session that sent the S&P 500 to its strongest monthly gain since November 2020.
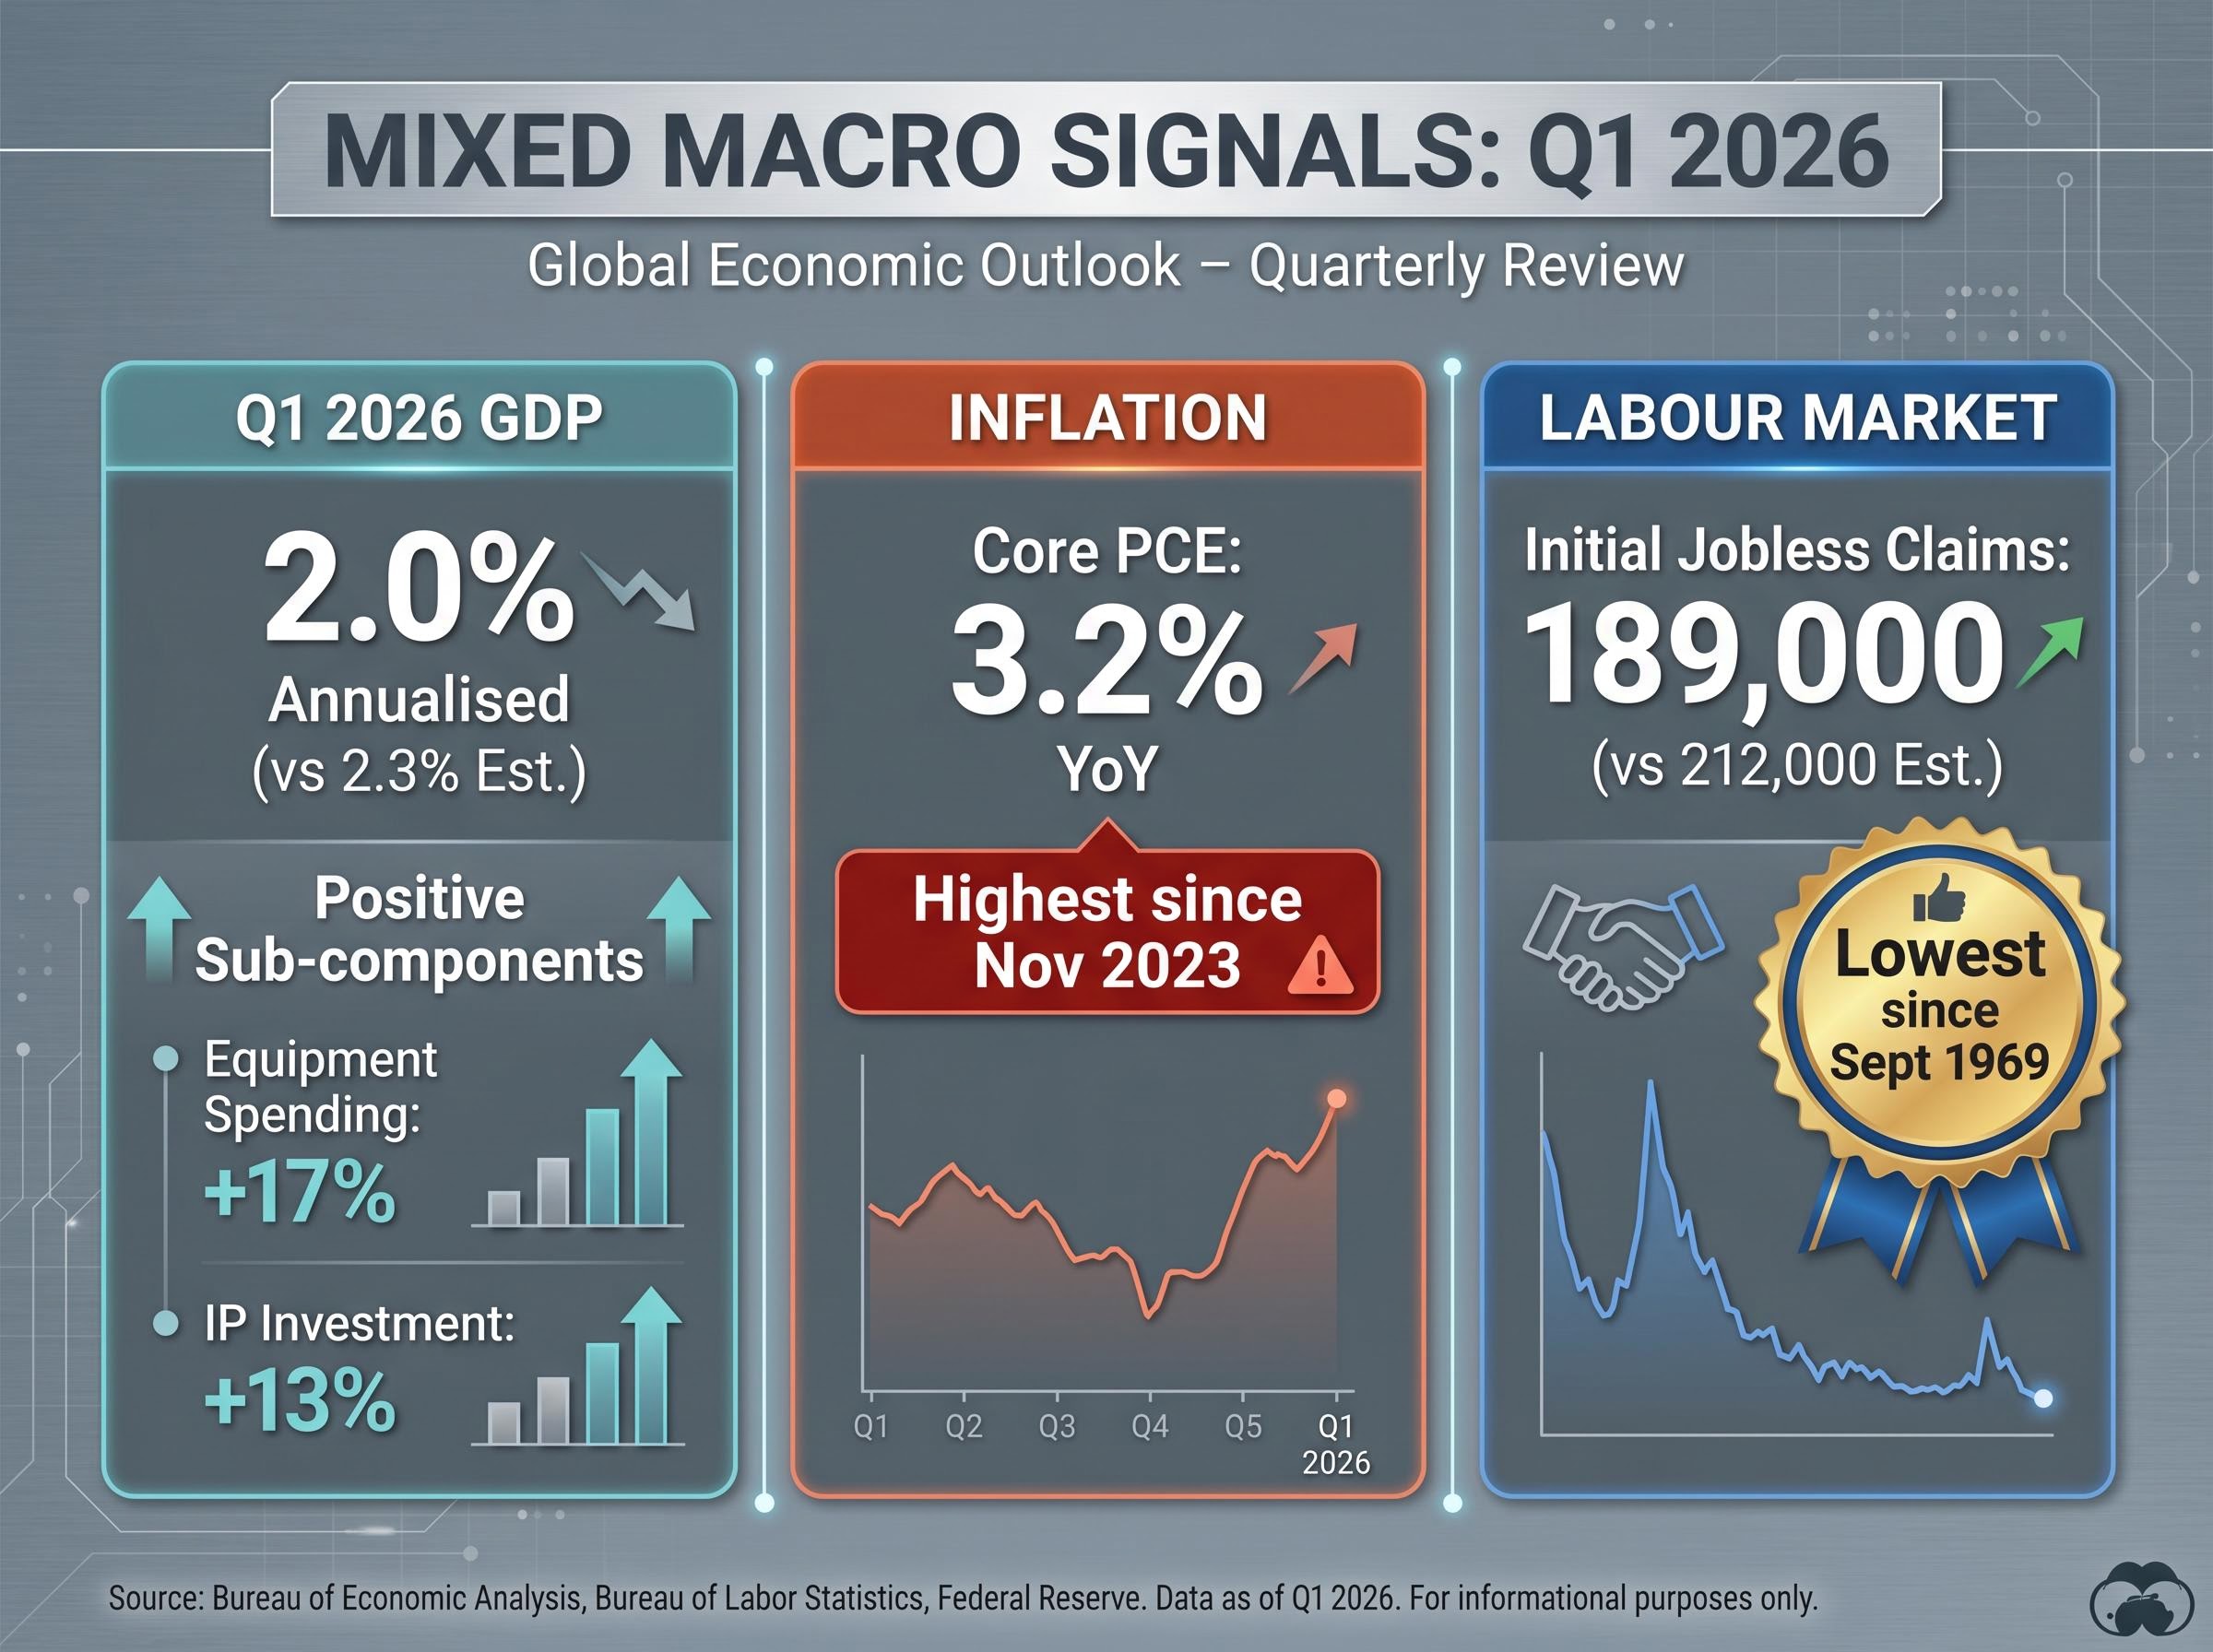
April 2026 closed with the S&P 500 up 10.4% for the month and the Nasdaq up 15.2%, driven by Q1 2026 earnings that have so far shown approximately 77-78% of reporters beating estimates, with blended earnings growth near 13.9%. The results arrive against a macro backdrop that resists simple interpretation: GDP came in below consensus at 2.0%, core PCE (the Federal Reserve’s preferred inflation gauge) hit 3.2% year-over-year, its highest since November 2023, and initial jobless claims fell to their lowest reading since 1969.
What follows unpacks what the standout Q1 results from Apple, Eli Lilly, and Caterpillar reveal about the structural themes powering the rally, what the broader mega-cap tech earnings picture adds to that story, and what the conflicting macro data means for investors assessing whether April’s gains can hold into May.
The scale of the April move deserves specificity. Consider the key monthly figures:
The S&P 500’s 10.4% April gain marks its strongest monthly result since November 2020, a period that followed an entirely different catalyst: post-election fiscal stimulus expectations.
The breadth matters as much as the magnitude. When small-caps, equal-weight indices, and mega-cap names all advance simultaneously, it signals that the rally is drawing from genuine market-wide conviction rather than narrow concentration in a handful of large constituents.
The mechanism beneath that conviction is earnings delivery. With nearly 60% of S&P 500 constituents having reported by the close of April, approximately 77-78% beat estimates, producing blended earnings growth of roughly 13.9%. That beat rate, paired with a growth rate that has held above pre-season consensus, positions the advance as fundamentals-led. Sentiment followed earnings, not the reverse.
Forward guidance signals rather than backward-looking quarterly results have been the primary market movers throughout this reporting period, a dynamic that explains why Microsoft’s in-line Azure figures produced a negative share price reaction and why Eli Lilly’s raised full-year revenue range carried more weight than the Q1 beat alone.
FactSet S&P 500 earnings season tracking provides the aggregated beat-rate and blended growth data that underpin the season-wide picture, with the April 24 update reporting that roughly 77-78% of reporters beat estimates and blended earnings growth held near 13.9%, figures that position April’s index gains as fundamentals-driven rather than sentiment-driven.
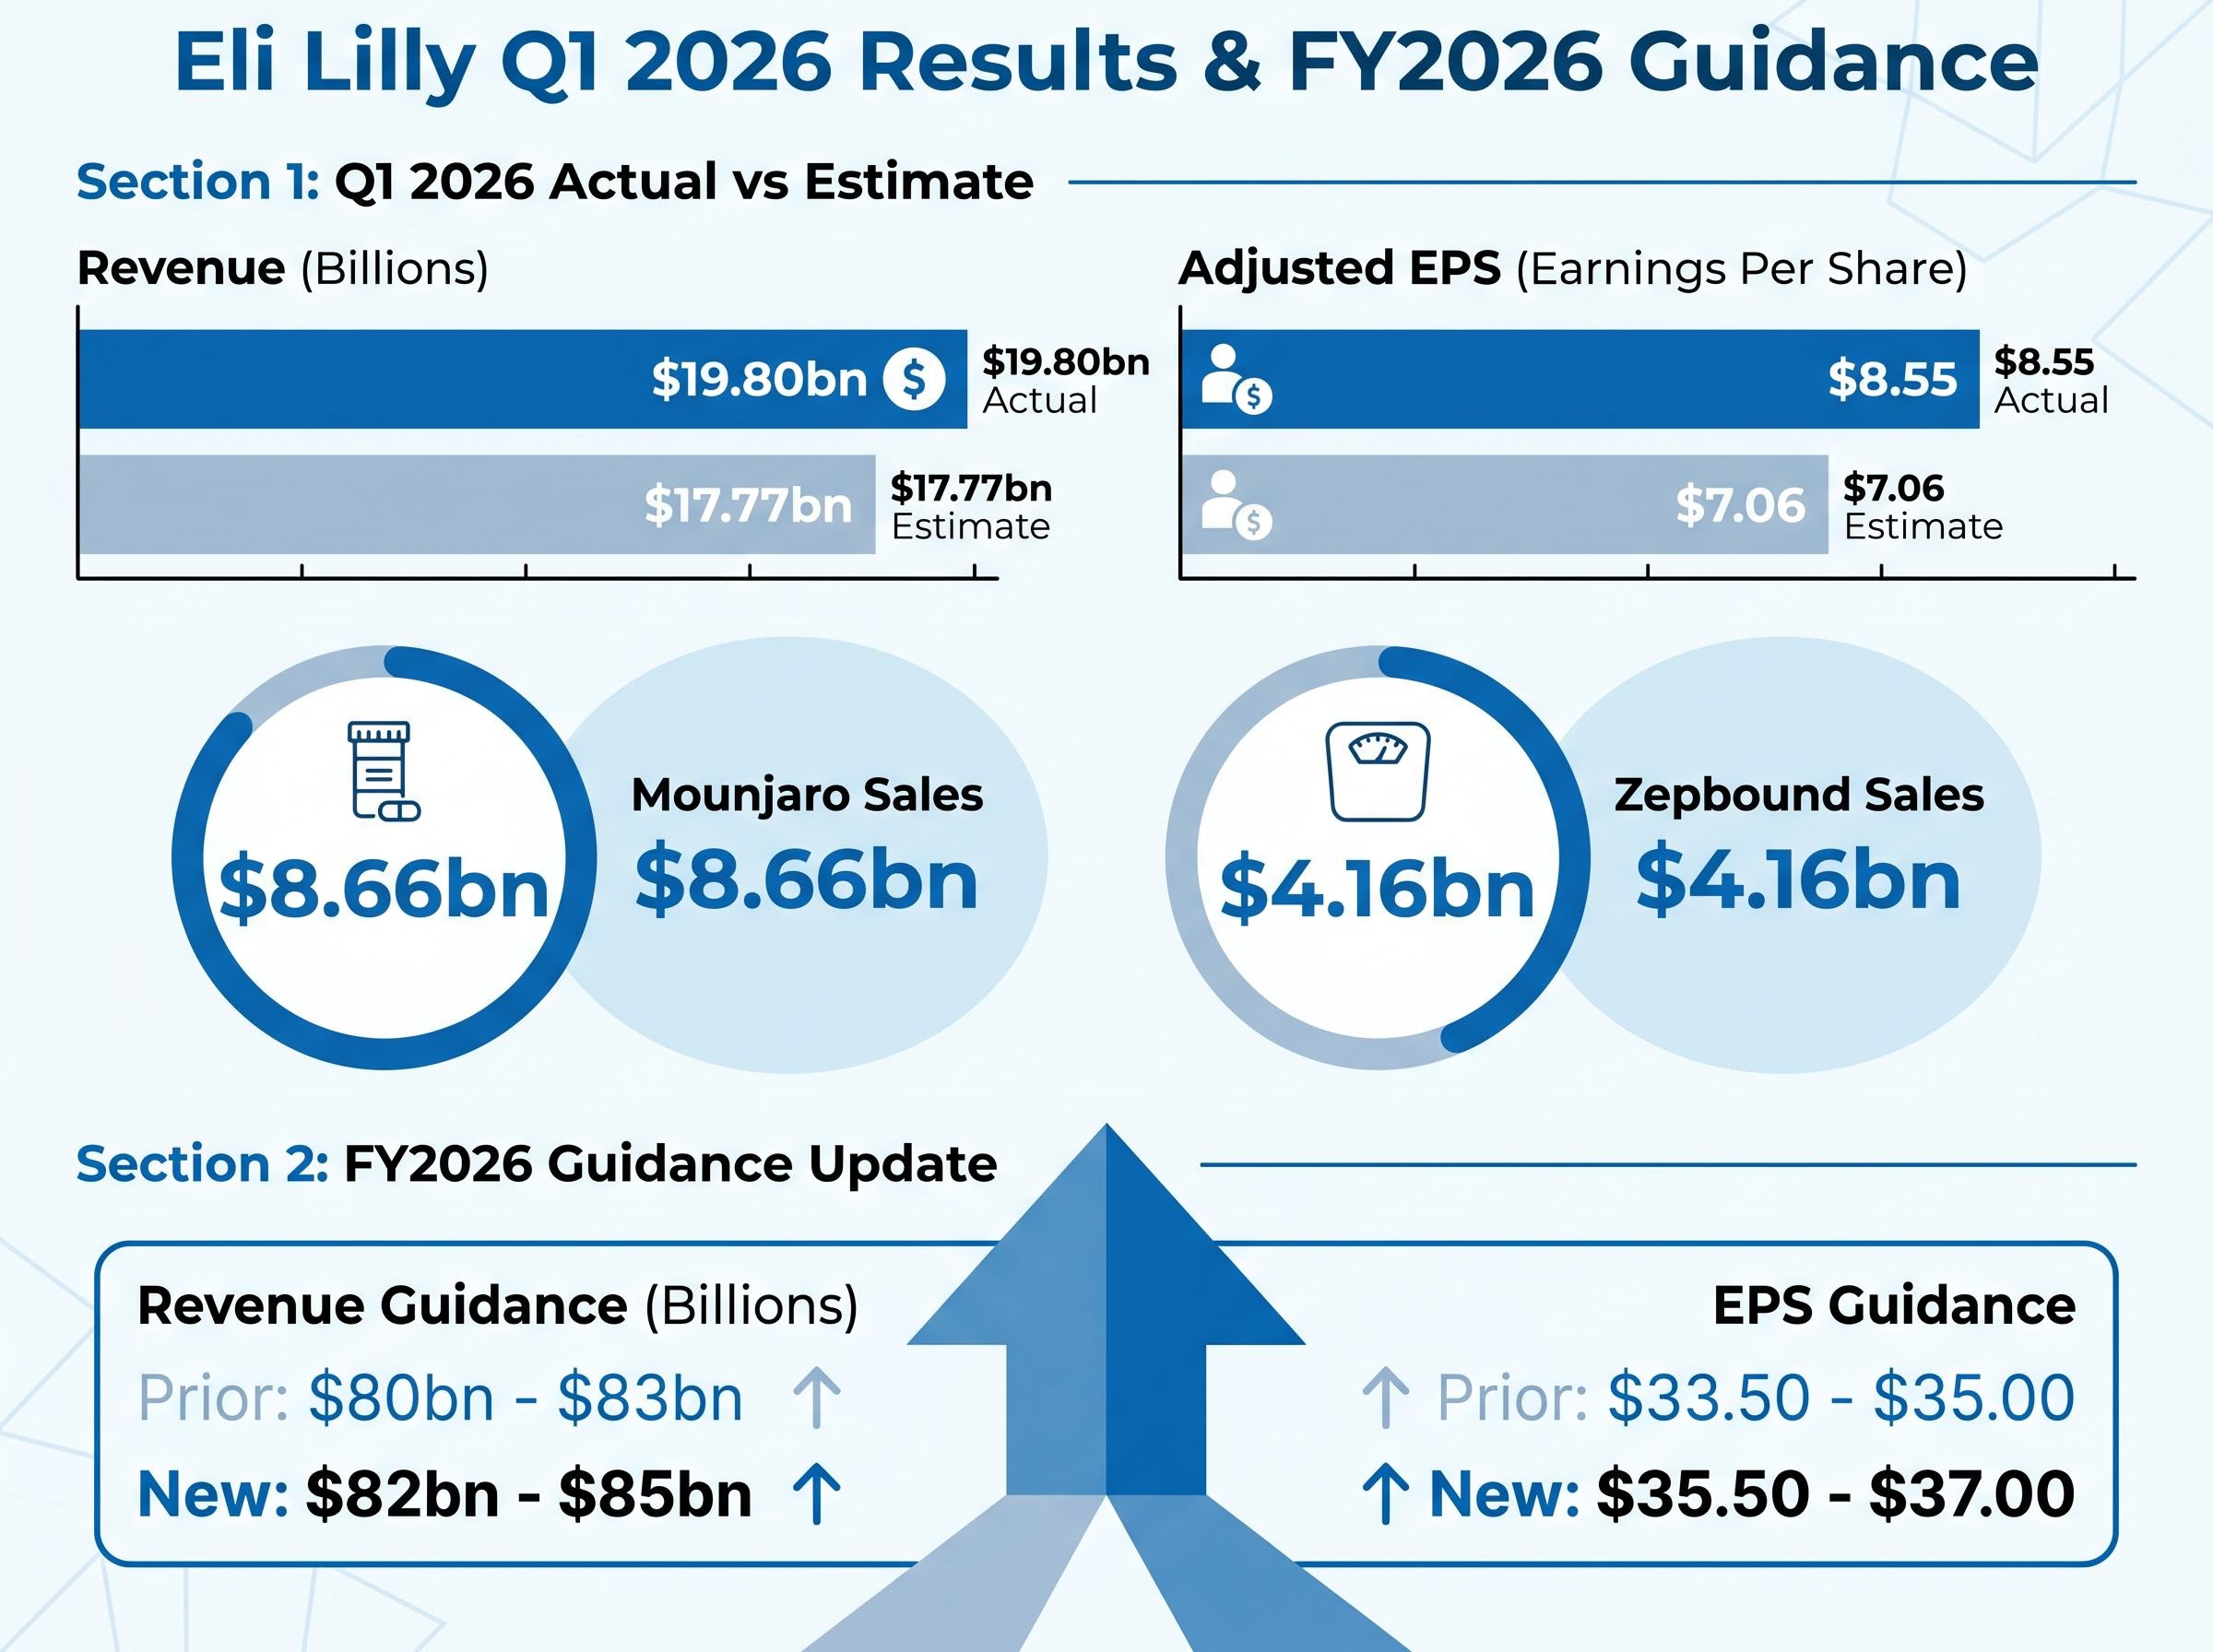
Eli Lilly reported Q1 2026 revenue of $19.80bn, up 56% year-over-year, against analyst estimates of $17.77bn. Adjusted EPS came in at $8.55, a 156% year-over-year increase, versus the $7.06 consensus.
Eli Lilly’s adjusted EPS of $8.55 represented a 156% year-over-year increase, making it one of the largest earnings beats of the Q1 season.
The individual product lines reinforced the scale of the outperformance. Mounjaro sales rose 125% to $8.66bn, beating the $7.21bn estimate by approximately 20%. Zepbound sales grew 80% to $4.16bn, versus estimates of $4.03bn.
| Metric | Actual Result | Analyst Estimate | Beat Margin |
|---|---|---|---|
| Revenue | $19.80bn | $17.77bn | ~11% |
| Adjusted EPS | $8.55 | $7.06 | ~21% |
| Mounjaro Sales | $8.66bn | $7.21bn | ~20% |
| Zepbound Sales | $4.16bn | $4.03bn | ~3% |
| FY2026 Revenue Guidance | $82bn-$85bn | Prior $80bn-$83bn | Raised |
What elevates this beyond a single-quarter beat is the FDA approval of Foundayo, Eli Lilly’s oral GLP-1 treatment that does not carry the food or liquid restrictions common to existing oral formulations. That distinction matters because it opens the GLP-1 addressable population to patients who have avoided injectable therapies. This is not a peak-demand story; it is an expanding-market story.
Management signalled the same conviction by raising full-year guidance: FY2026 revenue expectations moved to $82bn-$85bn from the prior $80bn-$83bn, and EPS guidance lifted to $35.50-$37.00 from $33.50-$35.00. Eli Lilly shares closed up 9.8% on April 30. As the 12th largest S&P 500 constituent, that move carried index-level weight.
Caterpillar is not the name that surfaces first in AI infrastructure discussions. That is precisely what makes its Q1 2026 result analytically significant.
The numbers tell a three-part story:
Cat Financial revenue increased 10% to $947m, with segment profit rising 11% to $144m. The past-due rate improved to 1.39% from 1.58% year-over-year, indicating stable credit quality across the equipment financing portfolio.
A power-generation backlog exceeding three times the prior-year level implies contracted demand stretching well into future quarters. This is not a single-quarter pull-forward of orders; it reflects data centre construction programmes that require heavy equipment on multi-quarter delivery schedules.
CEO commentary on backlog growth provides a window into forward demand that guidance figures alone do not capture. When a company reports backlog growth of this magnitude, it suggests that AI infrastructure spending has migrated from digital capex announcements into hard physical orders, with implications for industrial sector earnings projections throughout 2026 and beyond.
AI infrastructure spending is increasingly concentrated in physical power generation and hardware assets rather than software, with Wall Street projecting $530-700 billion in global data centre IT spending for 2026 alone, a capital allocation shift that explains why Caterpillar’s power-generation backlog has reached more than three times its 2024 level.
Apple reported March-quarter revenue of $111.18bn, up 16.6% year-over-year, versus estimates of $109.66bn. EPS came in at $2.01, up 21.8%, against a $1.96 consensus. A clean beat across both lines.
The segment detail sharpened the picture:
Greater China revenue of $20.50bn, up 28.1% year-over-year and approximately 8% above consensus, was the most strategically significant surprise of Apple’s quarter, directly challenging the assumption that geopolitical friction was suppressing demand in that market.
The China figure is the analytical centre of the result. Prior to this report, consensus had priced in sustained softness in Chinese demand, driven by geopolitical friction and domestic competition. An 8% beat on Greater China revenue does not just outperform estimates; it reframes the iPhone 17 cycle as a global demand story with more geographic runway than pre-earnings assumptions allowed.
Apple also authorised a new $100bn share buyback and raised its quarterly dividend 4% to $0.27 per share. Operating cash flow exceeded $28bn. Apple shares rose approximately 3.7% in after-hours trading, a more measured reaction than Eli Lilly or Caterpillar received, but one that reflects the already-elevated expectations embedded in Apple’s valuation.
The mega-cap tech results tell a more differentiated story than the headline index gains might suggest. The market is not simply rewarding AI exposure; it is distinguishing between companies demonstrating cloud revenue acceleration and those where rising infrastructure costs are compressing the return-on-investment narrative.
| Company | Key Q1 Metric | Market Reaction Driver | Investor Caution Point |
|---|---|---|---|
| Alphabet | Google Cloud revenue growth of 63% | Cloud backlog nearly doubled year-over-year | Sustainability of growth rate at scale |
| Amazon | Fifth consecutive quarter of accelerating AWS growth | Consistent cloud acceleration trend | Capital intensity of infrastructure buildout |
| Microsoft | Solid cloud figures | Underlying Azure growth remains strong | Underwhelming Q2 revenue outlook tempered sentiment |
| Meta | Solid quarterly results | Core ad business performance | Elevated full-year capex guidance flagged concerns |
Alphabet stood out as the clear leader within the group. Google Cloud revenue growth of 63%, combined with a Search segment that grew 19%, gave investors evidence across both the infrastructure and monetisation layers of the AI thesis.
A near-doubling of the cloud order backlog is a leading indicator. It signals contracted future revenue, meaning the 63% growth rate reported in Q1 is not a peak but a base from which already-committed demand will convert into recognised revenue across coming quarters. For investors assessing the durability of Alphabet’s cloud growth, the backlog figure carried more analytical weight than the revenue line itself.
Microsoft and Meta told a different story. Microsoft’s underlying cloud figures were solid, but a Q2 revenue outlook that fell short of expectations reminded the market that even strong businesses face quarter-to-quarter variability. Meta’s elevated full-year capex guidance raised questions about when AI-related infrastructure spending would translate into proportional revenue returns.
The divergence between Alphabet and Meta was not simply a matter of results versus guidance; it reflected how differently the market is now pricing each hyperscaler’s record AI capital expenditure relative to the revenue acceleration that spending is expected to produce, with Alphabet’s 81% net income growth treated as proof of concept and Meta’s $20 billion capex revision treated as a warning.
Strong earnings do not exist in a vacuum. Three economic releases in April frame the macro environment in which those earnings must sustain record valuations.
The BEA Personal Income and Outlays report for March 2026 confirmed core PCE at 3.2% year-over-year, the official federal measurement that the Federal Reserve weights most heavily when calibrating the timing and pace of any policy rate adjustment.
Initial jobless claims of 189,000 represent the lowest reading since September 1969, a 56-year low that directly contradicts any narrative of labour market deterioration.
A labour market at 56-year lows with inflation above the Fed’s 2% target gives policymakers limited justification for near-term easing. For equity investors, the implication is direct: record valuations must continue to be supported by earnings growth rather than multiple expansion from rate relief. The earnings season so far has delivered on the first condition. The macro data makes the second unavailable.
April’s results validated three structural themes with corporate-level evidence:
Genuine risks remain, as flagged in earnings commentary across multiple reporters:
The K-shaped consumer recovery complicates a straightforward reading of Apple’s Greater China rebound and iPhone 17 demand: aggregate spending metrics remain supported by high-income households drawing on savings and investment gains, while lower-income cohorts face energy-driven purchasing power erosion that the headline retail figures do not yet fully reflect.
The peak earnings period (April 27 through May 15) is still underway. Approximately 60% of S&P 500 constituents have reported, meaning the remaining 40% carries the potential to either reinforce or complicate the narrative that April built. The structural bull case has data behind it. The macro environment has introduced the uncertainty that will determine whether data is enough.
This article is for informational purposes only and should not be considered financial advice. Investors should conduct their own research and consult with financial professionals before making investment decisions. Past performance does not guarantee future results. Financial projections are subject to market conditions and various risk factors.
Blended earnings growth combines reported results with estimates for companies yet to report, giving a season-wide picture of corporate profit trends. For Q1 2026, blended earnings growth is running near 13.9%, with approximately 77-78% of S&P 500 reporters beating estimates, signalling a fundamentals-driven rally rather than a sentiment-driven one.
Eli Lilly shares surged 9.8% after the company reported Q1 revenue of $19.80bn (up 56% year-over-year) and adjusted EPS of $8.55 (up 156%), both well above consensus, while also raising its full-year 2026 revenue guidance to $82bn-$85bn and receiving FDA approval for Foundayo, a new oral GLP-1 treatment.
Caterpillar reported a power-generation order backlog exceeding three times its 2024 level, reflecting contracted demand from data centre construction programmes that require heavy equipment on multi-quarter delivery schedules. This suggests AI infrastructure spending has moved from digital capital expenditure announcements into hard physical orders, underpinning Caterpillar's 20% EPS beat.
Q1 2026 GDP came in at 2.0% annualised, below the 2.3% consensus, while core PCE rose to 3.2% year-over-year, its highest since November 2023. Together, these readings give the Federal Reserve limited justification to cut rates in the near term, meaning equity valuations must be supported by continued earnings growth rather than multiple expansion from rate relief.
Alphabet was the standout performer, with Google Cloud revenue growing 63% and its cloud order backlog nearly doubling year-over-year. Microsoft and Meta were more mixed: Microsoft's solid underlying cloud figures were offset by a weaker Q2 revenue outlook, while Meta's elevated full-year capex guidance raised questions about the timeline for returns on AI infrastructure spending.


