Fed Holds Rates but Dot Plot Signals a Hike Before Year-End
41 mins ago
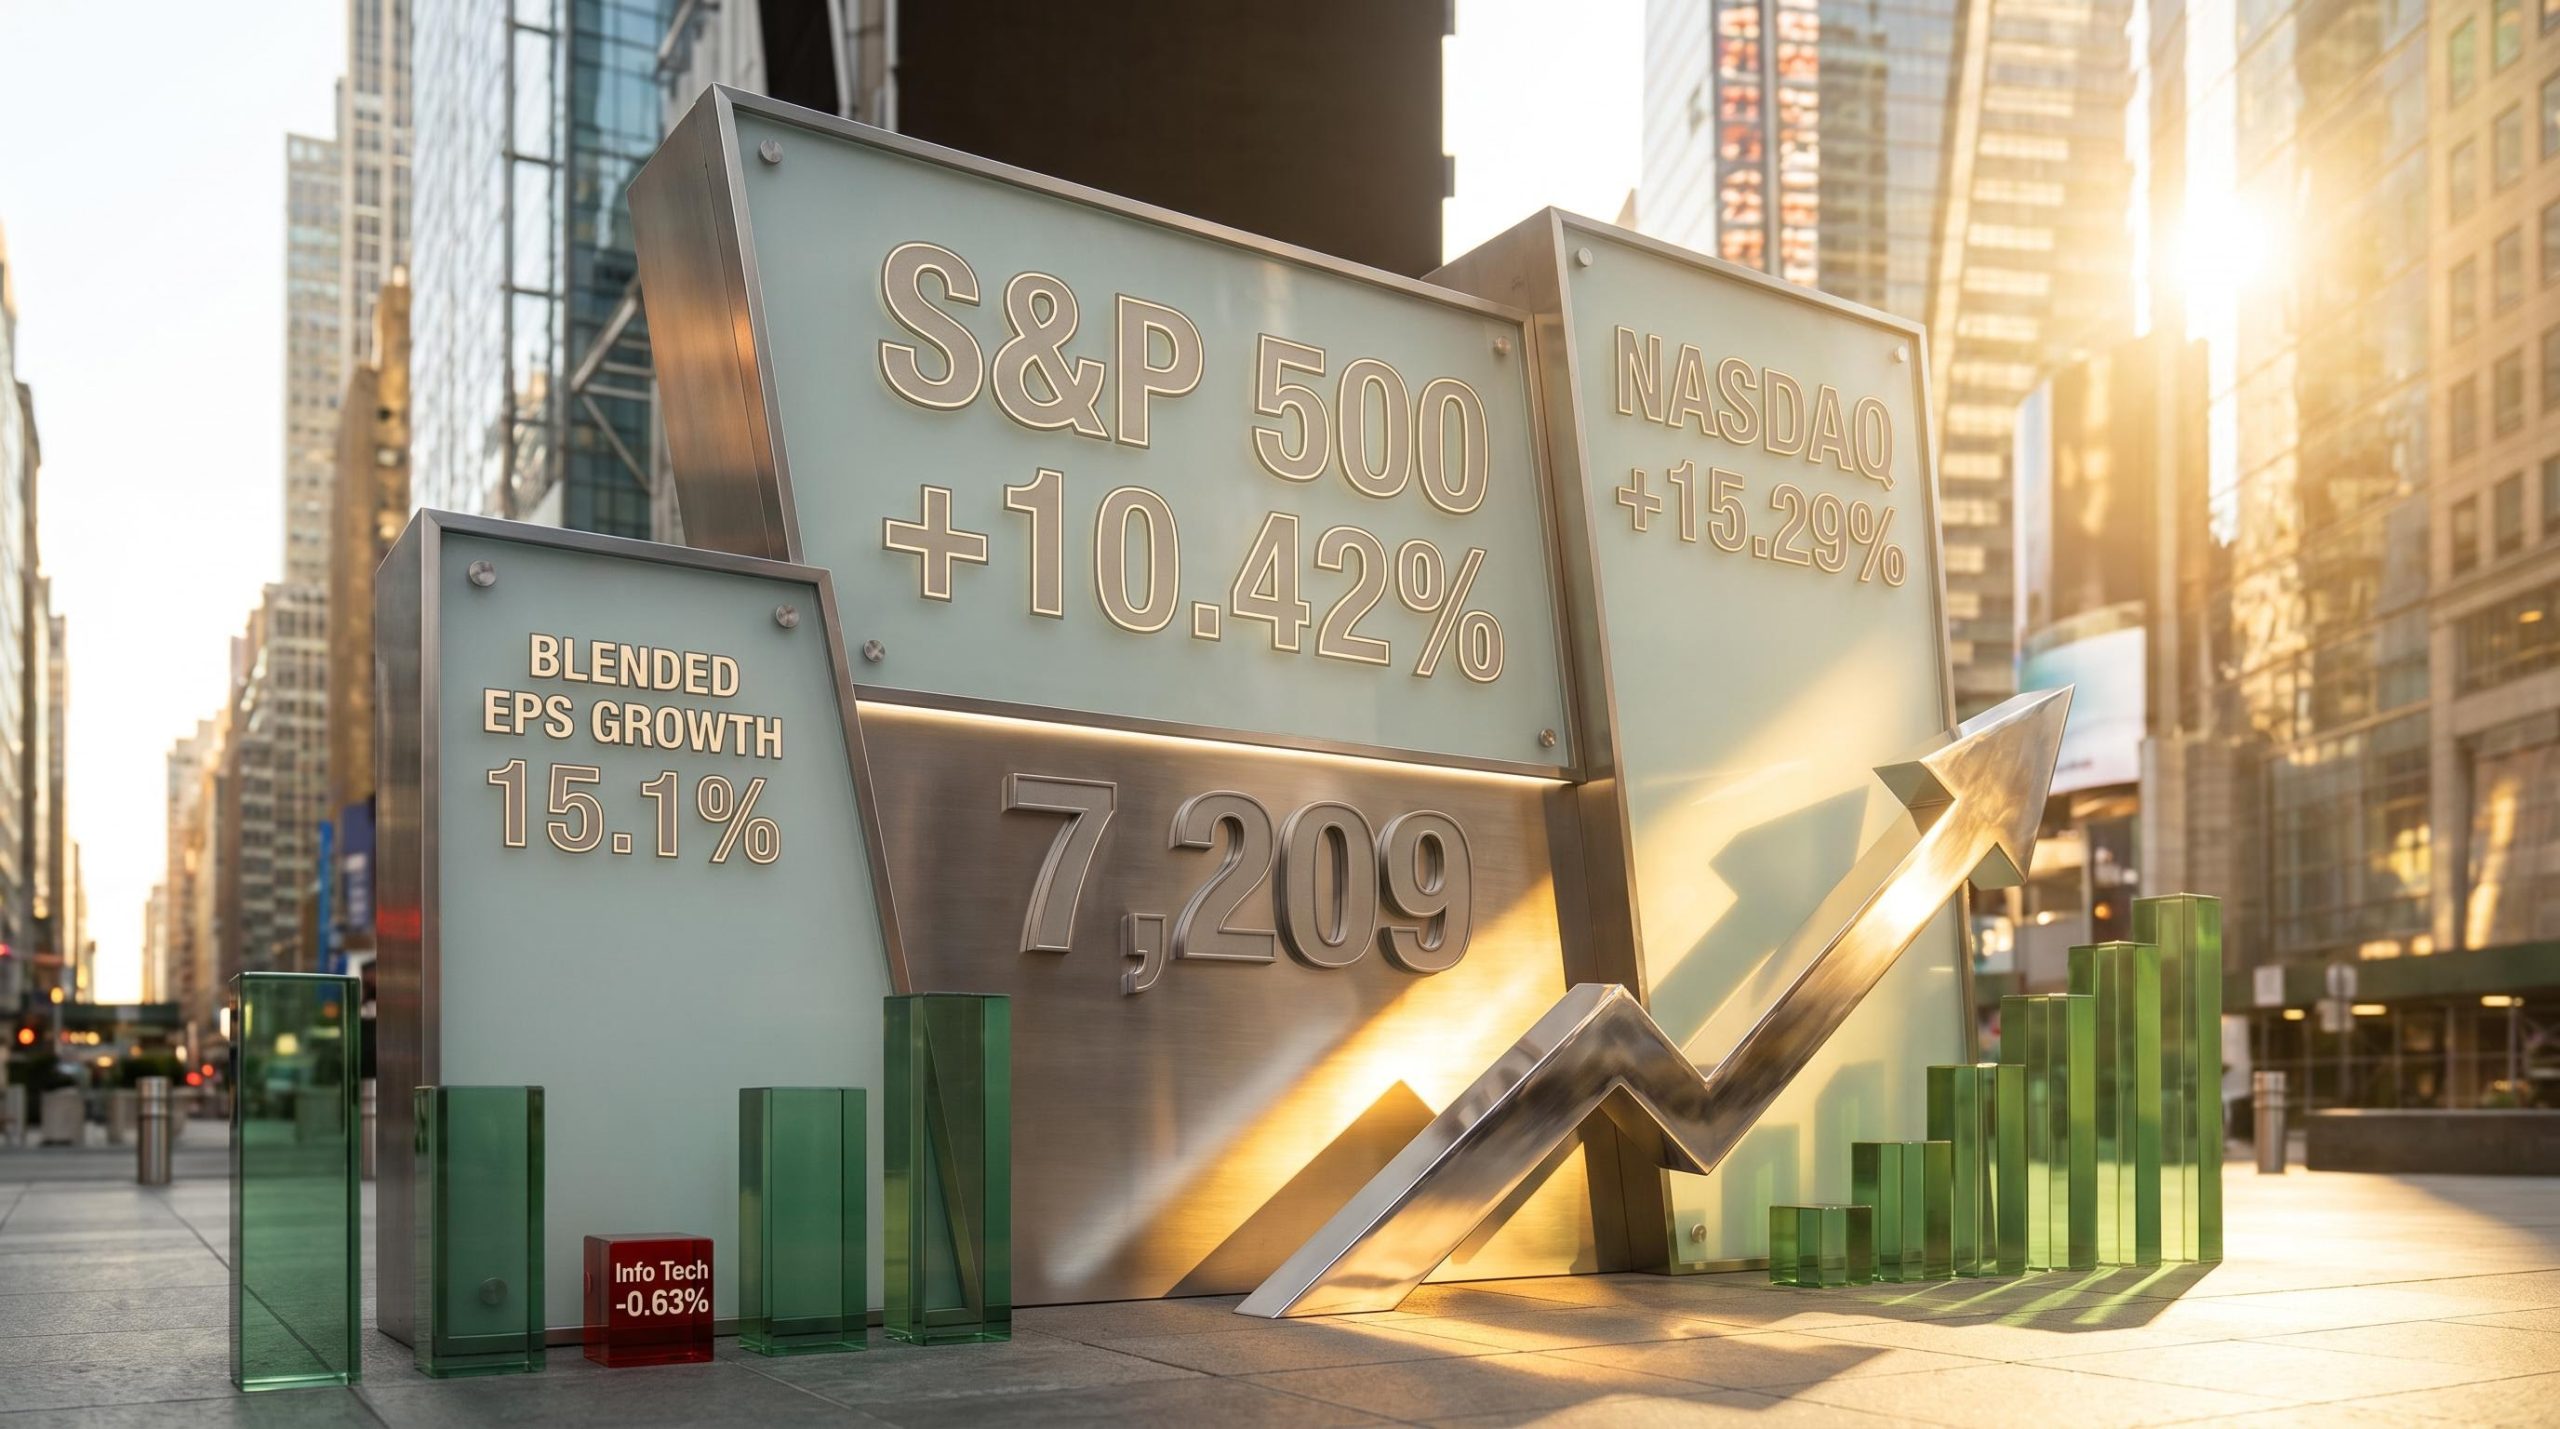
The S&P 500 just posted its strongest monthly gain since November 2020, a 10.42% surge in April 2026 that wiped out the year’s earlier losses and pushed the index to a record close of 7,209 on 30 April. Beneath that headline number, the market is telling a more complicated story.
The stock market rally unfolded against blockbuster earnings from Alphabet, Apple, Amazon, Eli Lilly, and Caterpillar, offset by sharp selloffs in Meta and Microsoft despite their own beats. Simultaneously, core PCE inflation sat at 3.2% year-on-year, GDP came in below consensus, and oil was trading near $105 a barrel. The question for investors is whether April’s euphoria is built on durable fundamentals or on a narrow set of AI-driven narratives that are already cracking at the edges.
What follows is an examination of what actually drove the rally, why the market’s reaction to earnings diverged so sharply across companies, and what the emerging tension between AI spending optimism and capex anxiety signals about where markets go from here.
The scale of the reversal needs to sit with the reader before any interpretation begins. In a single month, every major US equity benchmark posted gains that would be exceptional over a full year:
The S&P 500 and Nasdaq both posted their strongest monthly gains since November 2020, a period that saw markets surge on vaccine optimism and fiscal stimulus. April’s rally matched that scale without an equivalent single catalyst.
That equal-weight outperformance is worth pausing on. When the average stock in the index gains more than the index itself, it signals that buying pressure extended well beyond the mega-cap names that dominate the cap-weighted calculation. The Russell 2000’s 2.21% session gain reinforces the same point: small caps participated in strength, not just observed it.
The CBOE Volatility Index (VIX), a measure of expected near-term market volatility often called Wall Street’s fear gauge, dropped approximately 10% to 16.9, its lowest reading since 3 February.
A VIX below 17 indicates that options markets are pricing in relatively subdued daily swings. That is consistent with the post-rally positioning of a market that believes the worst is behind it. The counterpoint is straightforward: historically, VIX readings this low after rapid rallies have sometimes preceded renewed volatility, as complacency itself becomes the risk.
This was not a quarter where companies scraped past sandbagged estimates. The scale of the beats, across technology, healthcare, and industrials, is what gave the rally its fundamental credibility.
The blended Q1 2026 S&P 500 earnings growth rate reached 15.1%, with 76% of reporting companies delivering positive EPS surprises and 76% posting positive revenue surprises. Pre-season consensus had pegged growth at 13.2%. The gap between expectation and delivery was wide enough to move markets rather than merely confirm them.
Alphabet provided the clearest single-company catalyst. Q1 2026 revenue of $109.9 billion beat estimates by approximately $2.7 billion, driven by Google Cloud revenue surging 63% to $20 billion. Shares rose 9.9%. Eli Lilly delivered Q1 revenue of $19.8 billion, a 56% increase that beat estimates by roughly 12%, with Mounjaro revenue climbing 125% to $8.66 billion and Zepbound growing 80% to $4.16 billion. Caterpillar beat Q1 estimates and upgraded its full-year revenue outlook, contributing the majority of the Dow’s 790-point session rise.
| Company | Revenue | Key growth metric | Share price reaction |
|---|---|---|---|
| Alphabet | $109.9B (beat by ~$2.7B) | Google Cloud +63% | +9.9% |
| Caterpillar | Q1 beat; full-year guidance raised | ~10% share gain | ~+10% |
| Eli Lilly | $19.8B (+56%, beat by ~12%) | Mounjaro +125% | ~+9% |
| Apple | $111.2B (+17%) | Services record $30.98B | EPS $2.01, +22% |
| Amazon | $181.5B (+17%) | AWS +28% to $37.6B | AWS backlog $364B |
AWS posted 28% revenue growth to $37.6 billion, its fastest growth rate in 15 quarters. For institutional investors tracking cloud demand as a proxy for enterprise AI adoption, that single data point may carry more weight than any forward guidance number in the quarter.
Apple’s results illustrated a subtler dynamic. Q2 FY26 revenue rose 17% to $111.2 billion, with iPhone revenue hitting a March-quarter record of $57.99 billion. Yet the market work was done by the Services segment reaching a record $30.98 billion and the authorisation of an additional $100 billion share buyback, signalling management confidence in sustained cash generation.
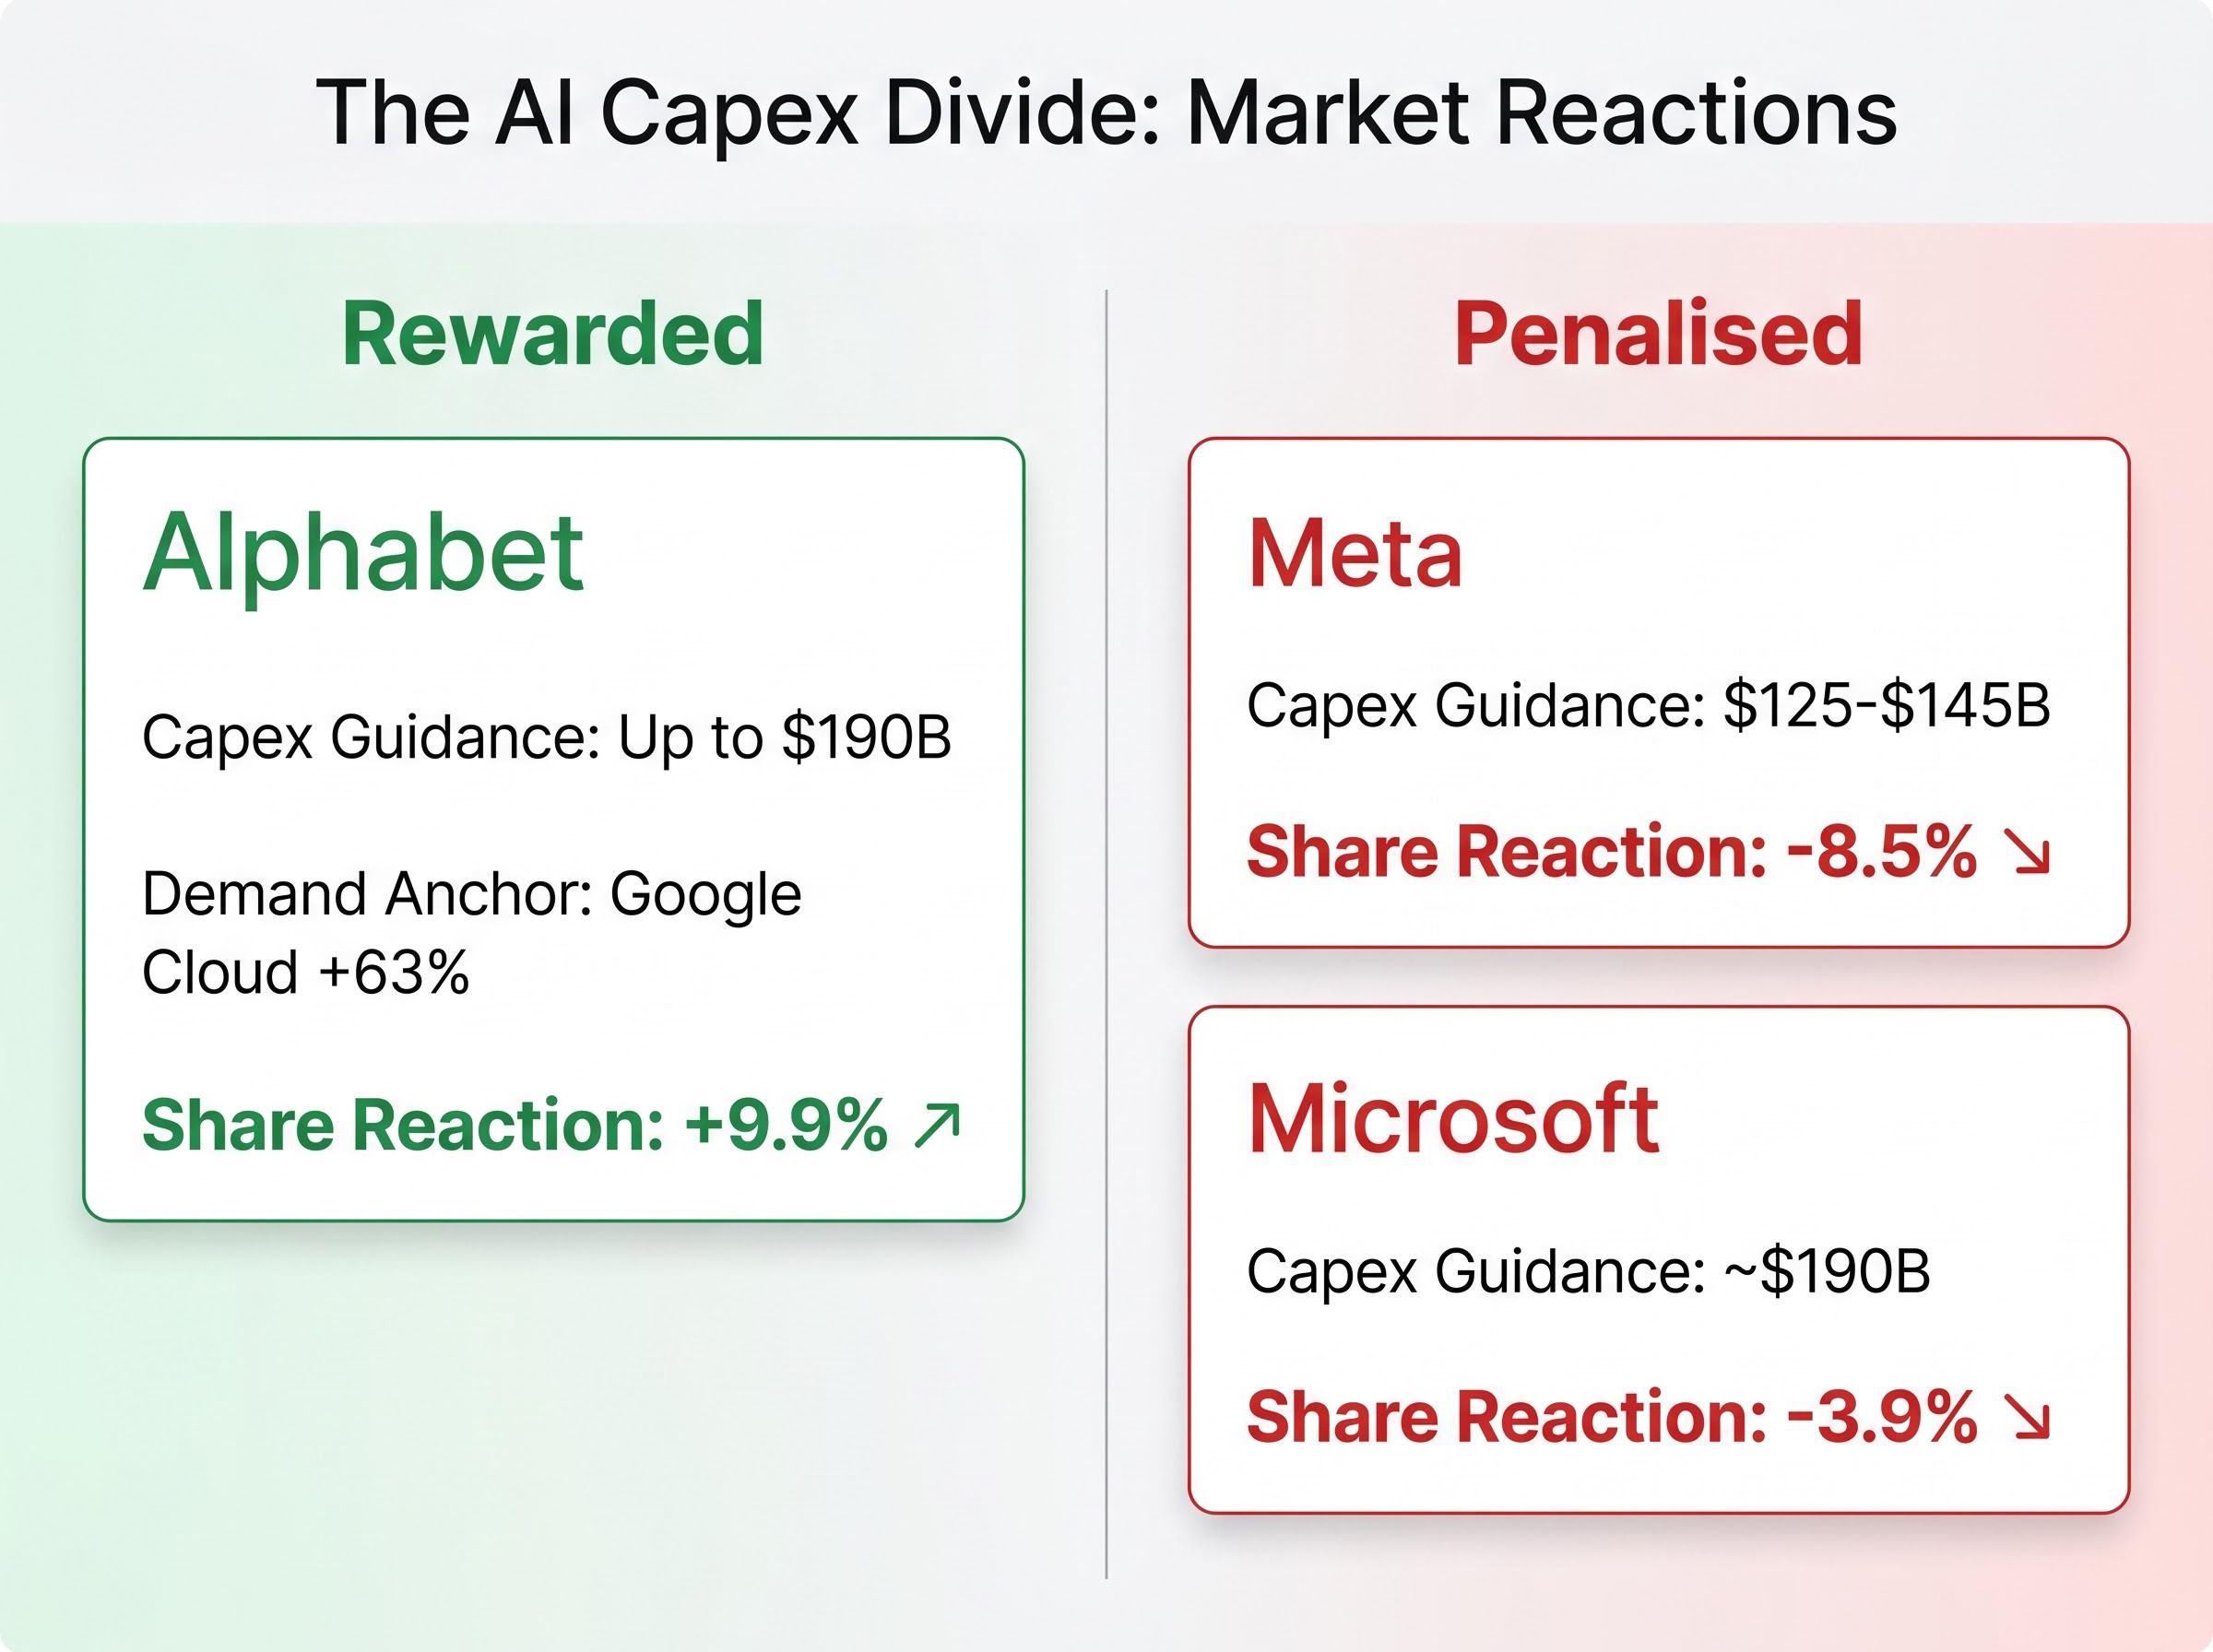
Meta beat Q1 earnings estimates and its shares fell 8.5%. Microsoft beat earnings estimates and its shares fell 3.9%. The apparent contradiction dissolves once the capex guidance is placed alongside the revenue growth rates those commitments are supposed to fund.
Meta raised its full-year capex guidance to $125-$145 billion, up from a prior range of $115-$135 billion. Microsoft’s fiscal-year capex sits at approximately $190 billion, with management citing elevated memory costs. In both cases, the market reaction suggests investors were asking a specific question: where is the demand that justifies this spending? Neither company provided the equivalent of Alphabet’s 63% cloud growth rate or Amazon’s $364 billion AWS backlog to anchor the outlay.
The pattern of guidance overriding beats played out across multiple names on 29 April alone, with Spotify falling 12-14% and Corning dropping roughly 9% despite both beating current-quarter estimates, while Centene surged nearly 9% on raised full-year EPS guidance, offering a granular single-session illustration of the same dynamic visible in Meta and Microsoft’s reactions.
Combined 2026 AI capex commitments from Alphabet, Meta, Microsoft, and Amazon now exceed $650 billion.
The combined 2026 AI capex projections for the four largest US hyperscalers were flagged as early as February 2026 by analysts citing Bloomberg data, making the market’s subsequent scrutiny of individual company demand anchors a predictable consequence of commitments that were always going to require visible revenue validation.
Alphabet raised its own 2026 capex guidance to up to $190 billion, the same figure as Microsoft. Its shares rose 9.9%. The distinction the market appeared to draw was between capex backed by verifiable demand acceleration and capex that is projected but unanchored.
Google Cloud’s 63% revenue growth and Amazon’s $364 billion backlog (supplemented by a recent Anthropic deal exceeding $100 billion) gave the market confidence that those companies are spending into contracted demand. Meta’s capex increase lacked an equivalent demand anchor, and the market priced accordingly.
The pattern extended further. Qualcomm surged 15% after referencing engagement with a leading hyperscaler on custom silicon expected to ship later in the year. Nvidia fell 4.6% on the session despite no company-specific negative news, caught in the broader capex scrutiny.
The market is not punishing AI spending. It is discriminating between spending with visible returns and spending that raises questions about discipline.
Individual company stories are compelling, but the aggregate earnings picture is where the market’s fundamental health becomes measurable. Understanding how to read beat rates and blended growth figures offers a framework that extends well beyond this single quarter.
An earnings season unfolds in layers, and each layer reveals something different:
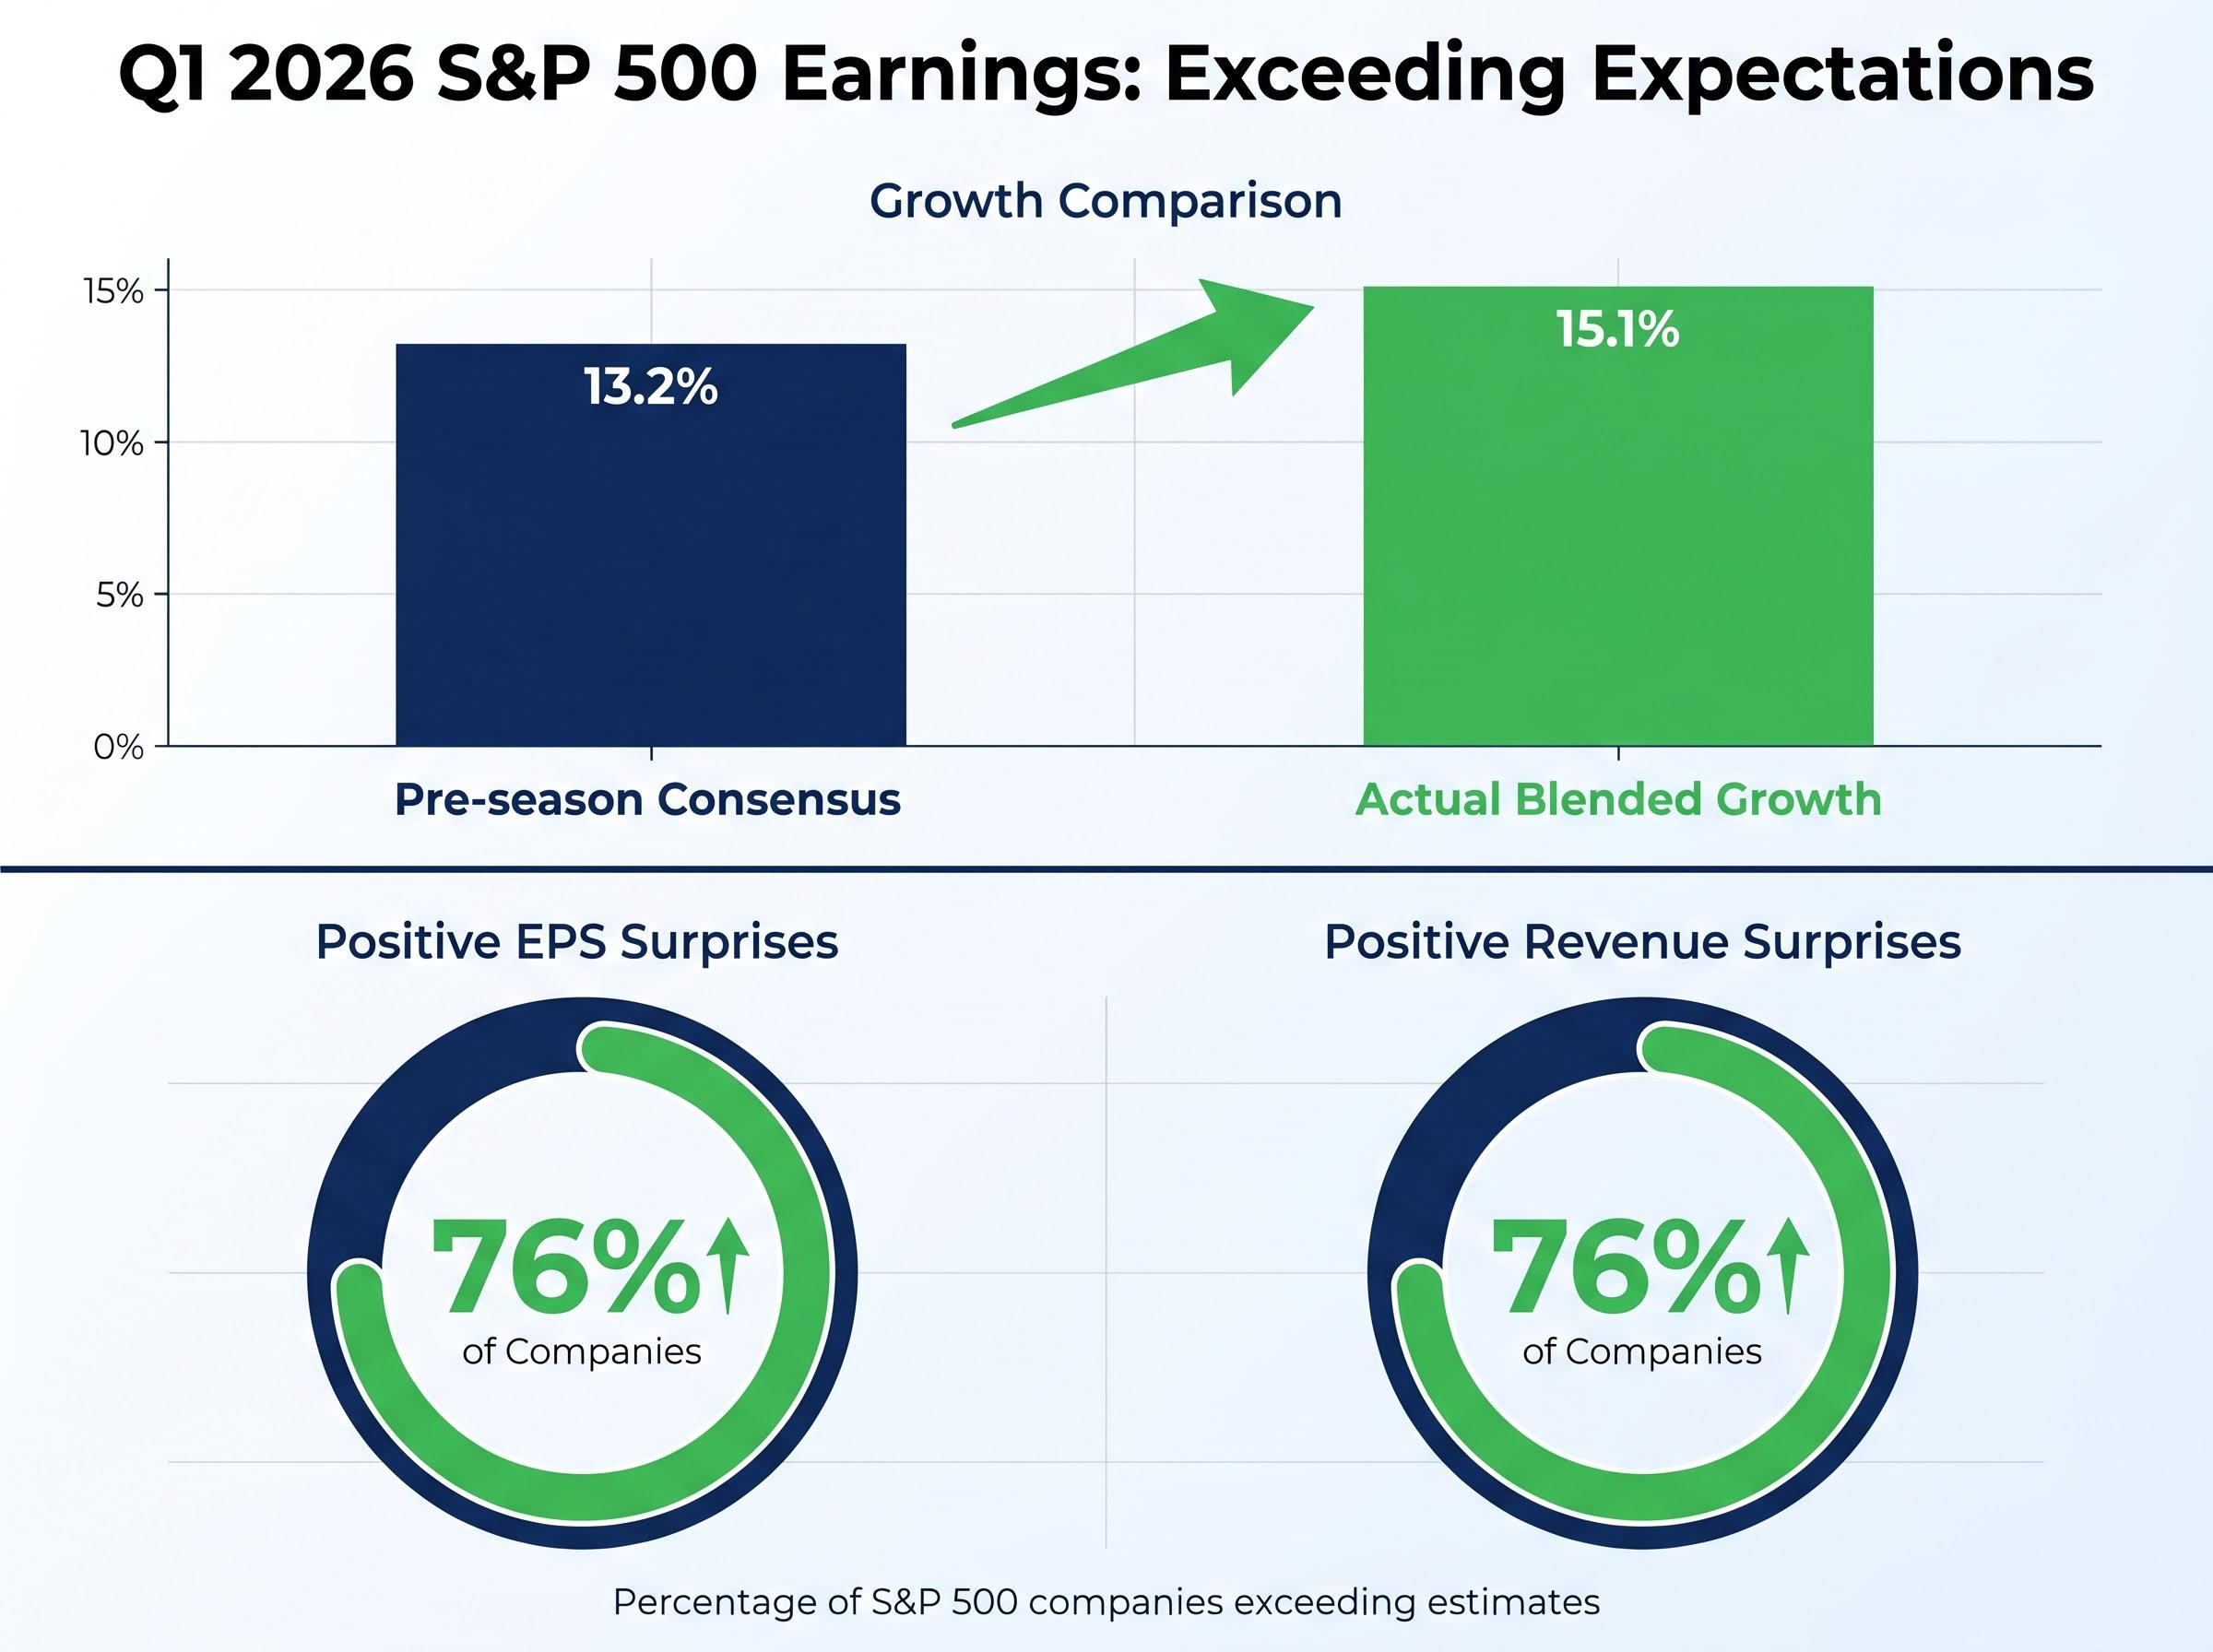
Pre-season consensus called for 13.2% earnings growth. The blended rate delivered 15.1%. When actual growth exceeds expectations by that margin across 76% of reporting companies, the analyst community systematically underestimated corporate health.
The FactSet Earnings Insight report tracking Q1 2026 results placed the blended S&P 500 earnings growth rate at 15.1%, with the 76% positive EPS surprise rate sitting at the high end of the 10-year average, giving the headline beat rate its historical context.
When both EPS and revenue surprise rates exceed 75% simultaneously, it indicates broad-based outperformance rather than a handful of outliers distorting the average. Historically, quarters with dual beat rates above 75% have supported further market gains in the subsequent three to six months, though past performance does not guarantee future results.
The earnings picture earned the rally. The macro data complicates it.
Growth:
Inflation:
Energy:
Goldman Sachs estimated that Strait of Hormuz export flows were running at just 4% of normal levels, and raised its Q4 2026 Brent crude forecast to $90 per barrel from $80.
The Trump administration extended an Iran ceasefire indefinitely on 30 April 2026, a development that could ease oil prices if flows normalise. United Airlines offered a ground-level illustration of the damage already done, cutting its full-year forecast citing rising fuel costs.
In Europe, the ECB held its deposit rate at 2.0% for a third consecutive meeting, while Eurozone Q1 2026 GDP grew just +0.1% quarter-on-quarter.
A market that rallies 10% in a month while core inflation runs at 3.2% and oil sits near $105 is a market pricing in a soft landing with considerable conviction. The macro data has not yet confirmed that conviction.
The geopolitical risk mispricing argument runs deeper than a single oil price reading: the market appears to be pricing in Hormuz normalisation and conflict containment as near-certainties, when the 17 April reopening and same-day re-closure of the strait demonstrated that diplomatic signals and actual shipping conditions can diverge within hours of each other.
The headline numbers say technology drove April. The 30 April session data tells a different story.
| Sector | Session return (%) |
|---|---|
| Communication Services | +3.98 |
| Industrials | +2.76 |
| Utilities | +2.55 |
| Health Care | +2.20 |
| Consumer Discretionary | Positive |
| Financials | Positive |
| Consumer Staples | Positive |
| Materials | Positive |
| Real Estate | Positive |
| Energy | Positive |
| Information Technology | -0.63 |
Information Technology was the sole declining S&P 500 sector on the session that the Nasdaq posted its best month since November 2020. The divergence suggests the session’s buying pressure rotated away from pure-play tech into Communication Services, Industrials, and smaller-cap names.
Communication Services led at +3.98%, boosted substantially by Alphabet’s 9.9% gain. Industrials followed at +2.76%, with Caterpillar’s roughly 10% surge contributing heavily. The Russell 2000’s +2.21% close at 2,800 and the equal-weighted S&P 500 outpacing the cap-weighted index by 49 basis points reinforced the breadth signal.
When small caps outperform large caps and cyclical sectors lead while pure-play tech declines, the market is broadening its earnings thesis. For investors building or rebalancing portfolios, that rotation pattern is among the more constructive signals available after a concentrated, tech-led rally.
For investors wanting to apply a structural framework to the breadth signals visible in the 30 April session data, our dedicated guide to Dow Theory confirmation signals examines the specific industrial and transportation average divergence that emerged in April 2026, including why the Dow Transports’ record peak failed to confirm the industrial average’s trajectory and what that historically implies for rally durability.
Three analytical threads define April’s market. Earnings fundamentals are genuinely strong, with a 15.1% blended growth rate that exceeded pre-season consensus by nearly two percentage points. AI capex is increasingly discriminated by the market rather than uniformly rewarded, with demand-validated spending gaining and unanchored spending losing. Macro headwinds, from 3.2% core PCE to $105 oil, remain unresolved but are being treated as second-order risks.
The sector rotation and small-cap outperformance on 30 April is the most constructive structural signal from the session. Whether that broadening persists will say more about the rally’s durability than any single earnings report.
The variables that will determine whether April’s record is a foundation or a ceiling:
This article is for informational purposes only and should not be considered financial advice. Investors should conduct their own research and consult with financial professionals before making investment decisions. Past performance does not guarantee future results. Financial projections are subject to market conditions and various risk factors.
The April 2026 stock market rally was driven by a blended Q1 2026 S&P 500 earnings growth rate of 15.1%, well above the 13.2% pre-season consensus, with standout results from Alphabet, Apple, Amazon, Eli Lilly, and Caterpillar pushing the S&P 500 up 10.42% to a record close of 7,209.
Meta and Microsoft fell 8.5% and 3.9% respectively because investors were concerned that their massive capex commitments (Meta raised guidance to $125-$145 billion and Microsoft sits at approximately $190 billion) lacked the demand-side anchors, such as Alphabet's 63% cloud growth or Amazon's $364 billion AWS backlog, needed to justify the spending.
The blended earnings growth rate combines actual reported results with analyst estimates for companies yet to report, giving the most complete real-time picture of corporate earnings health. In Q1 2026 it reached 15.1%, nearly two percentage points above the pre-season consensus of 13.2%, signalling that analysts broadly underestimated corporate strength.
Core PCE inflation ran at 3.2% year-on-year in March 2026 (its highest reading since November 2023), US GDP grew below consensus at 2.0% annualised, and WTI crude was trading near $105 a barrel, all of which remain unresolved risks that could delay Federal Reserve rate cuts and pressure corporate margins.
On 30 April, Information Technology was the only declining S&P 500 sector while Communication Services led at +3.98%, Industrials gained +2.76%, and the Russell 2000 rose 2.21%, suggesting buying pressure was broadening beyond mega-cap tech into cyclicals and small caps, which is generally a constructive signal for rally durability.