Micron Surges 9% After Guiding $6.4 Billion Above Consensus
2 hrs ago

ANZ shareholders who invested A$10,000 in April 2021 would now hold roughly 25% fewer shares at current prices, yet their total return has averaged approximately 11% per year over five years. That tension between share count erosion and wealth accumulation is precisely what makes decomposing bank stock performance so instructive.
With ANZ trading at approximately A$37.92 as of late April 2026, the stock has moved through a COVID recovery arc, reached a fresh all-time high above A$40, and pulled back through a period of geopolitical uncertainty. The five-year window captures nearly every phase of a market cycle, making it a rare real-world laboratory for understanding how bank stocks create, or erode, shareholder value.
What follows is a breakdown of the three distinct forces behind ANZ’s five-year return: profit growth, earnings multiple expansion, and dividend income. By the end, readers will have a practical framework for evaluating any Big Four bank stock, not just ANZ.
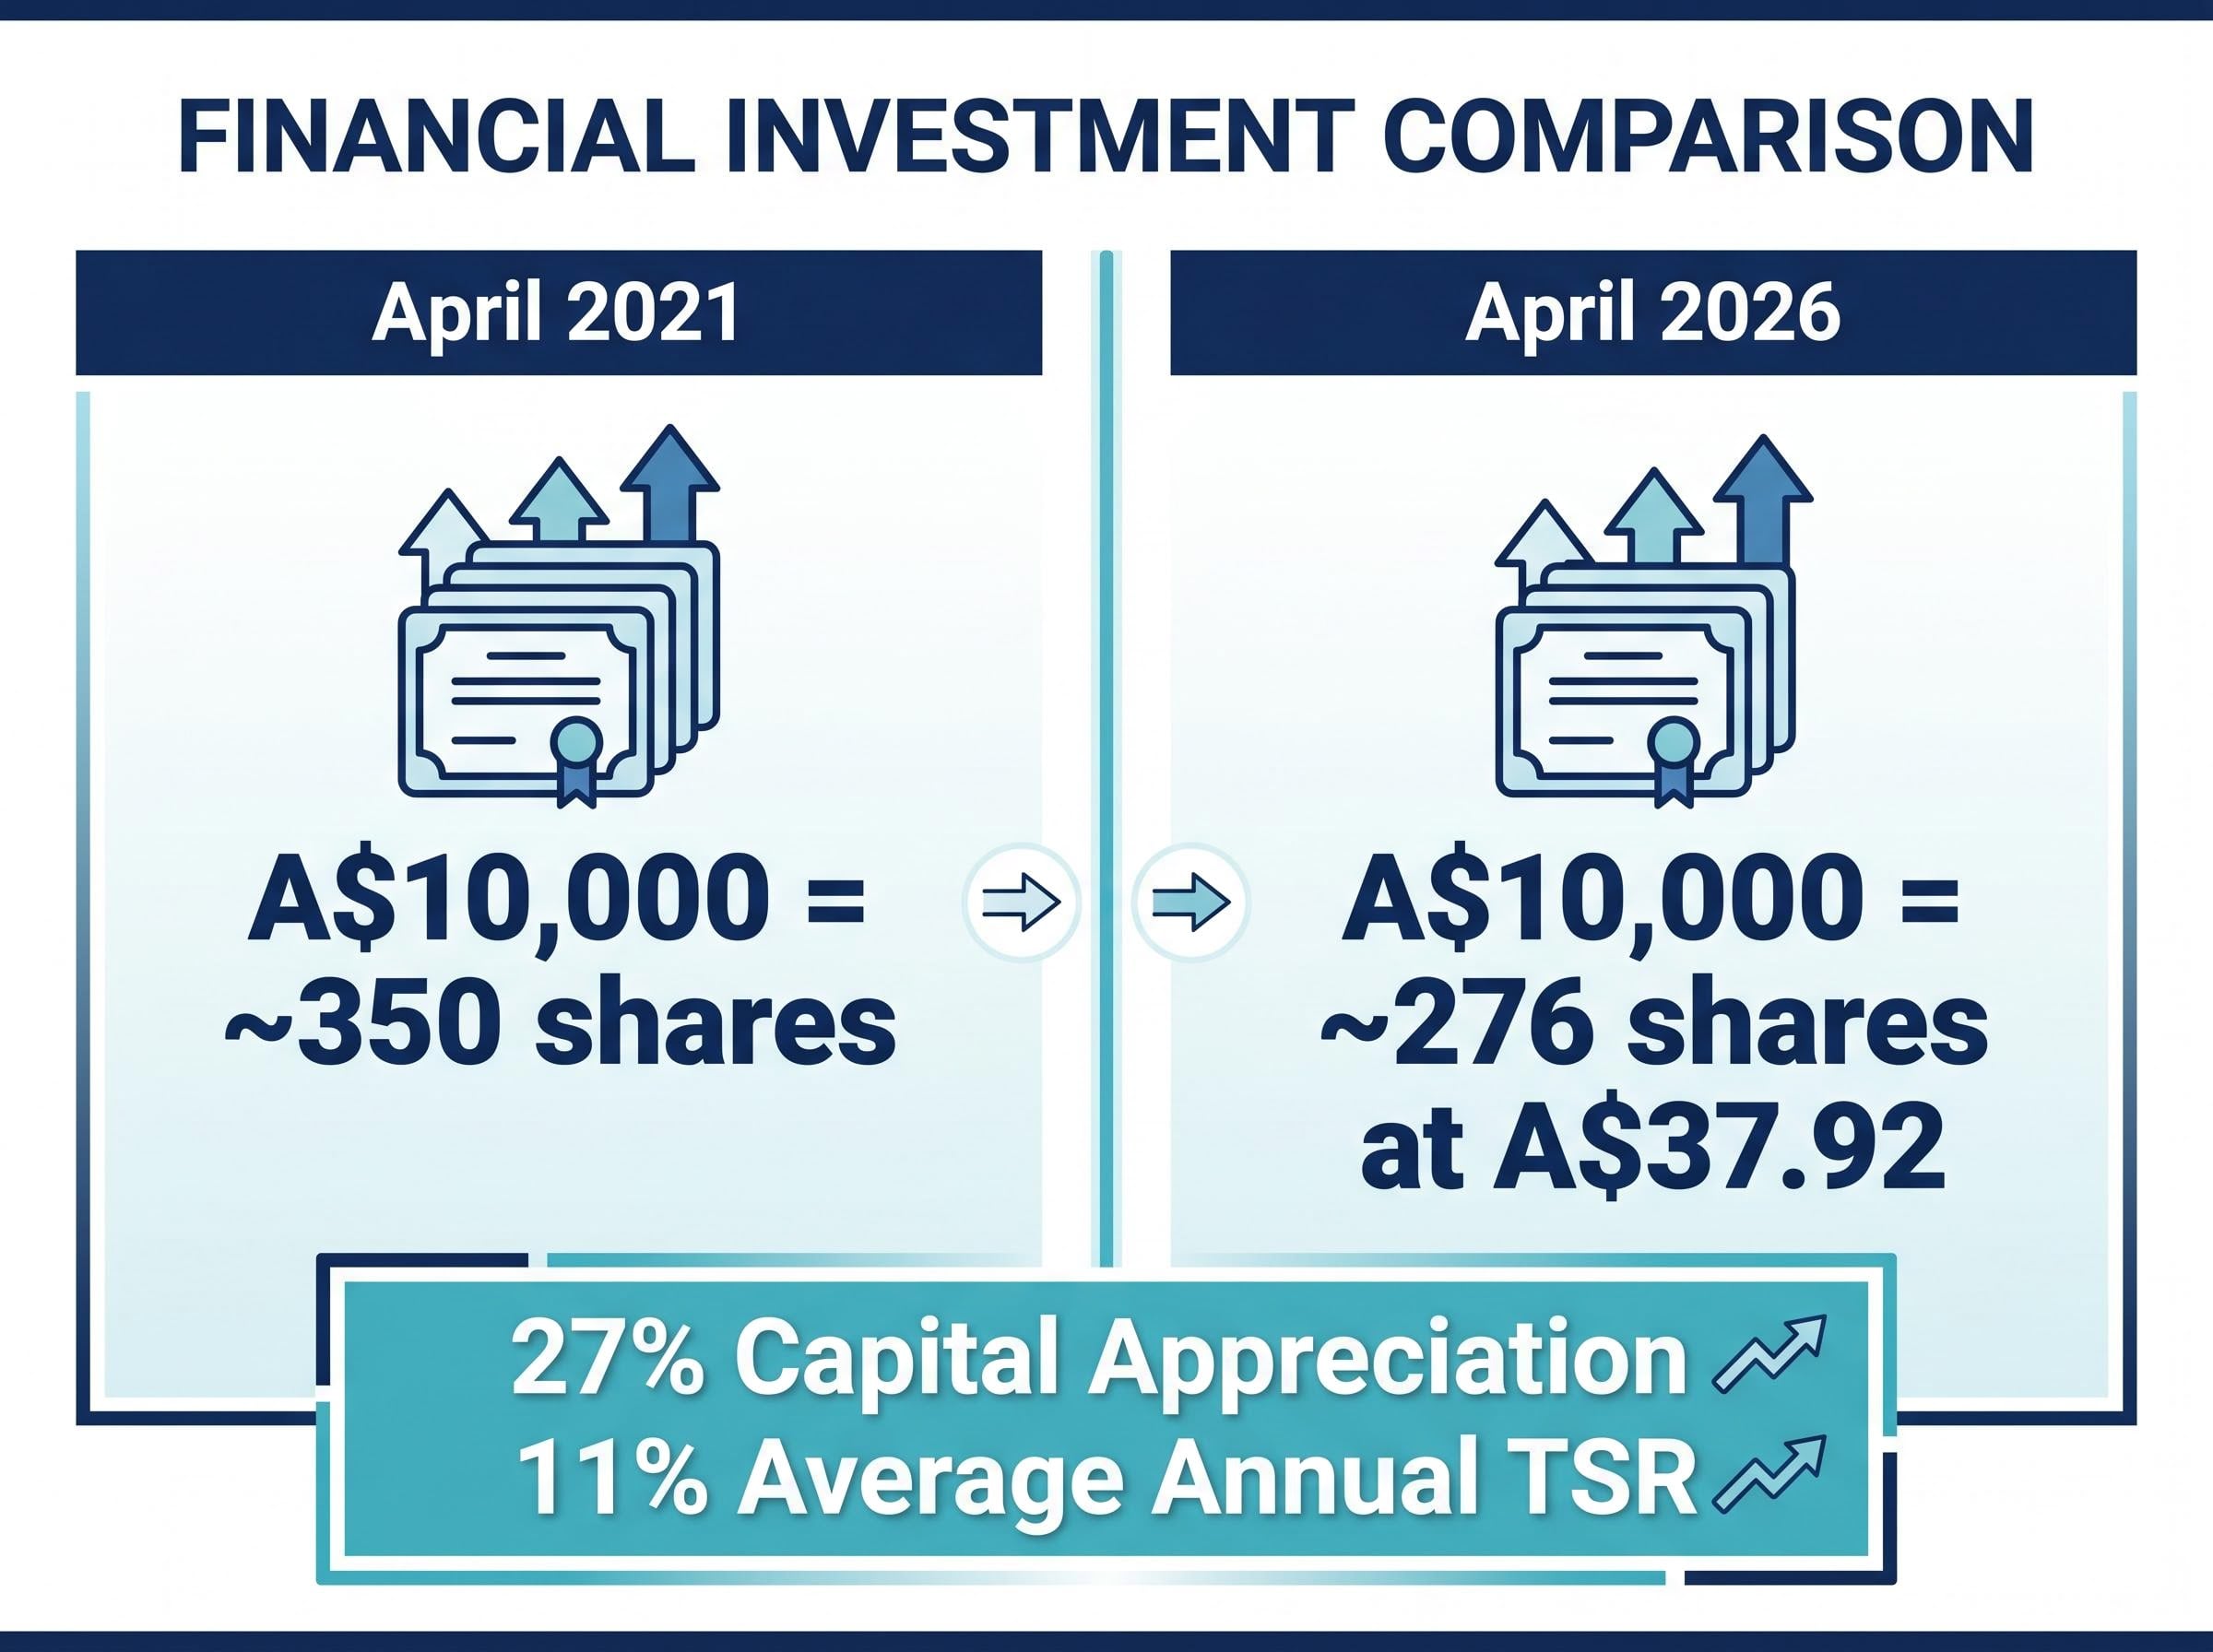
The headline numbers look straightforward. Over the five years from April 2021 to April 2026, ANZ delivered a 27% capital gain and an average annual total shareholder return (TSR) of approximately 11%, according to CMC Invest data. Look closer, and the gap between those two figures is the story.
Consider the A$10,000 illustration. In April 2021, that sum purchased roughly 350 ANZ shares. At today’s price of approximately A$37.92, the same A$10,000 buys approximately 276 shares. The share price has appreciated, yet the capital gain alone does not account for the full return experience.
An investor who deployed A$10,000 into ANZ in April 2021 would have accumulated approximately 350 shares. At A$37.92, that same capital now purchases roughly 276 shares, a gap that illustrates the 27% price appreciation in tangible terms.
The five-year headline metrics:
That gap between the 27% capital gain and a TSR that compounds to substantially more over five years points directly to one place: dividend income. The rest of this analysis resolves how much each driver contributed, and what those proportions signal about the stock’s next chapter.
If profit growth and multiple expansion explain the 27% capital gain, then dividends explain most of the distance between that figure and the compounded value of 11% average annual TSR. For a five-year holding period, income was not supplementary. It was structural.
ANZ’s dividend profile carries three distinct components for Australian shareholders:
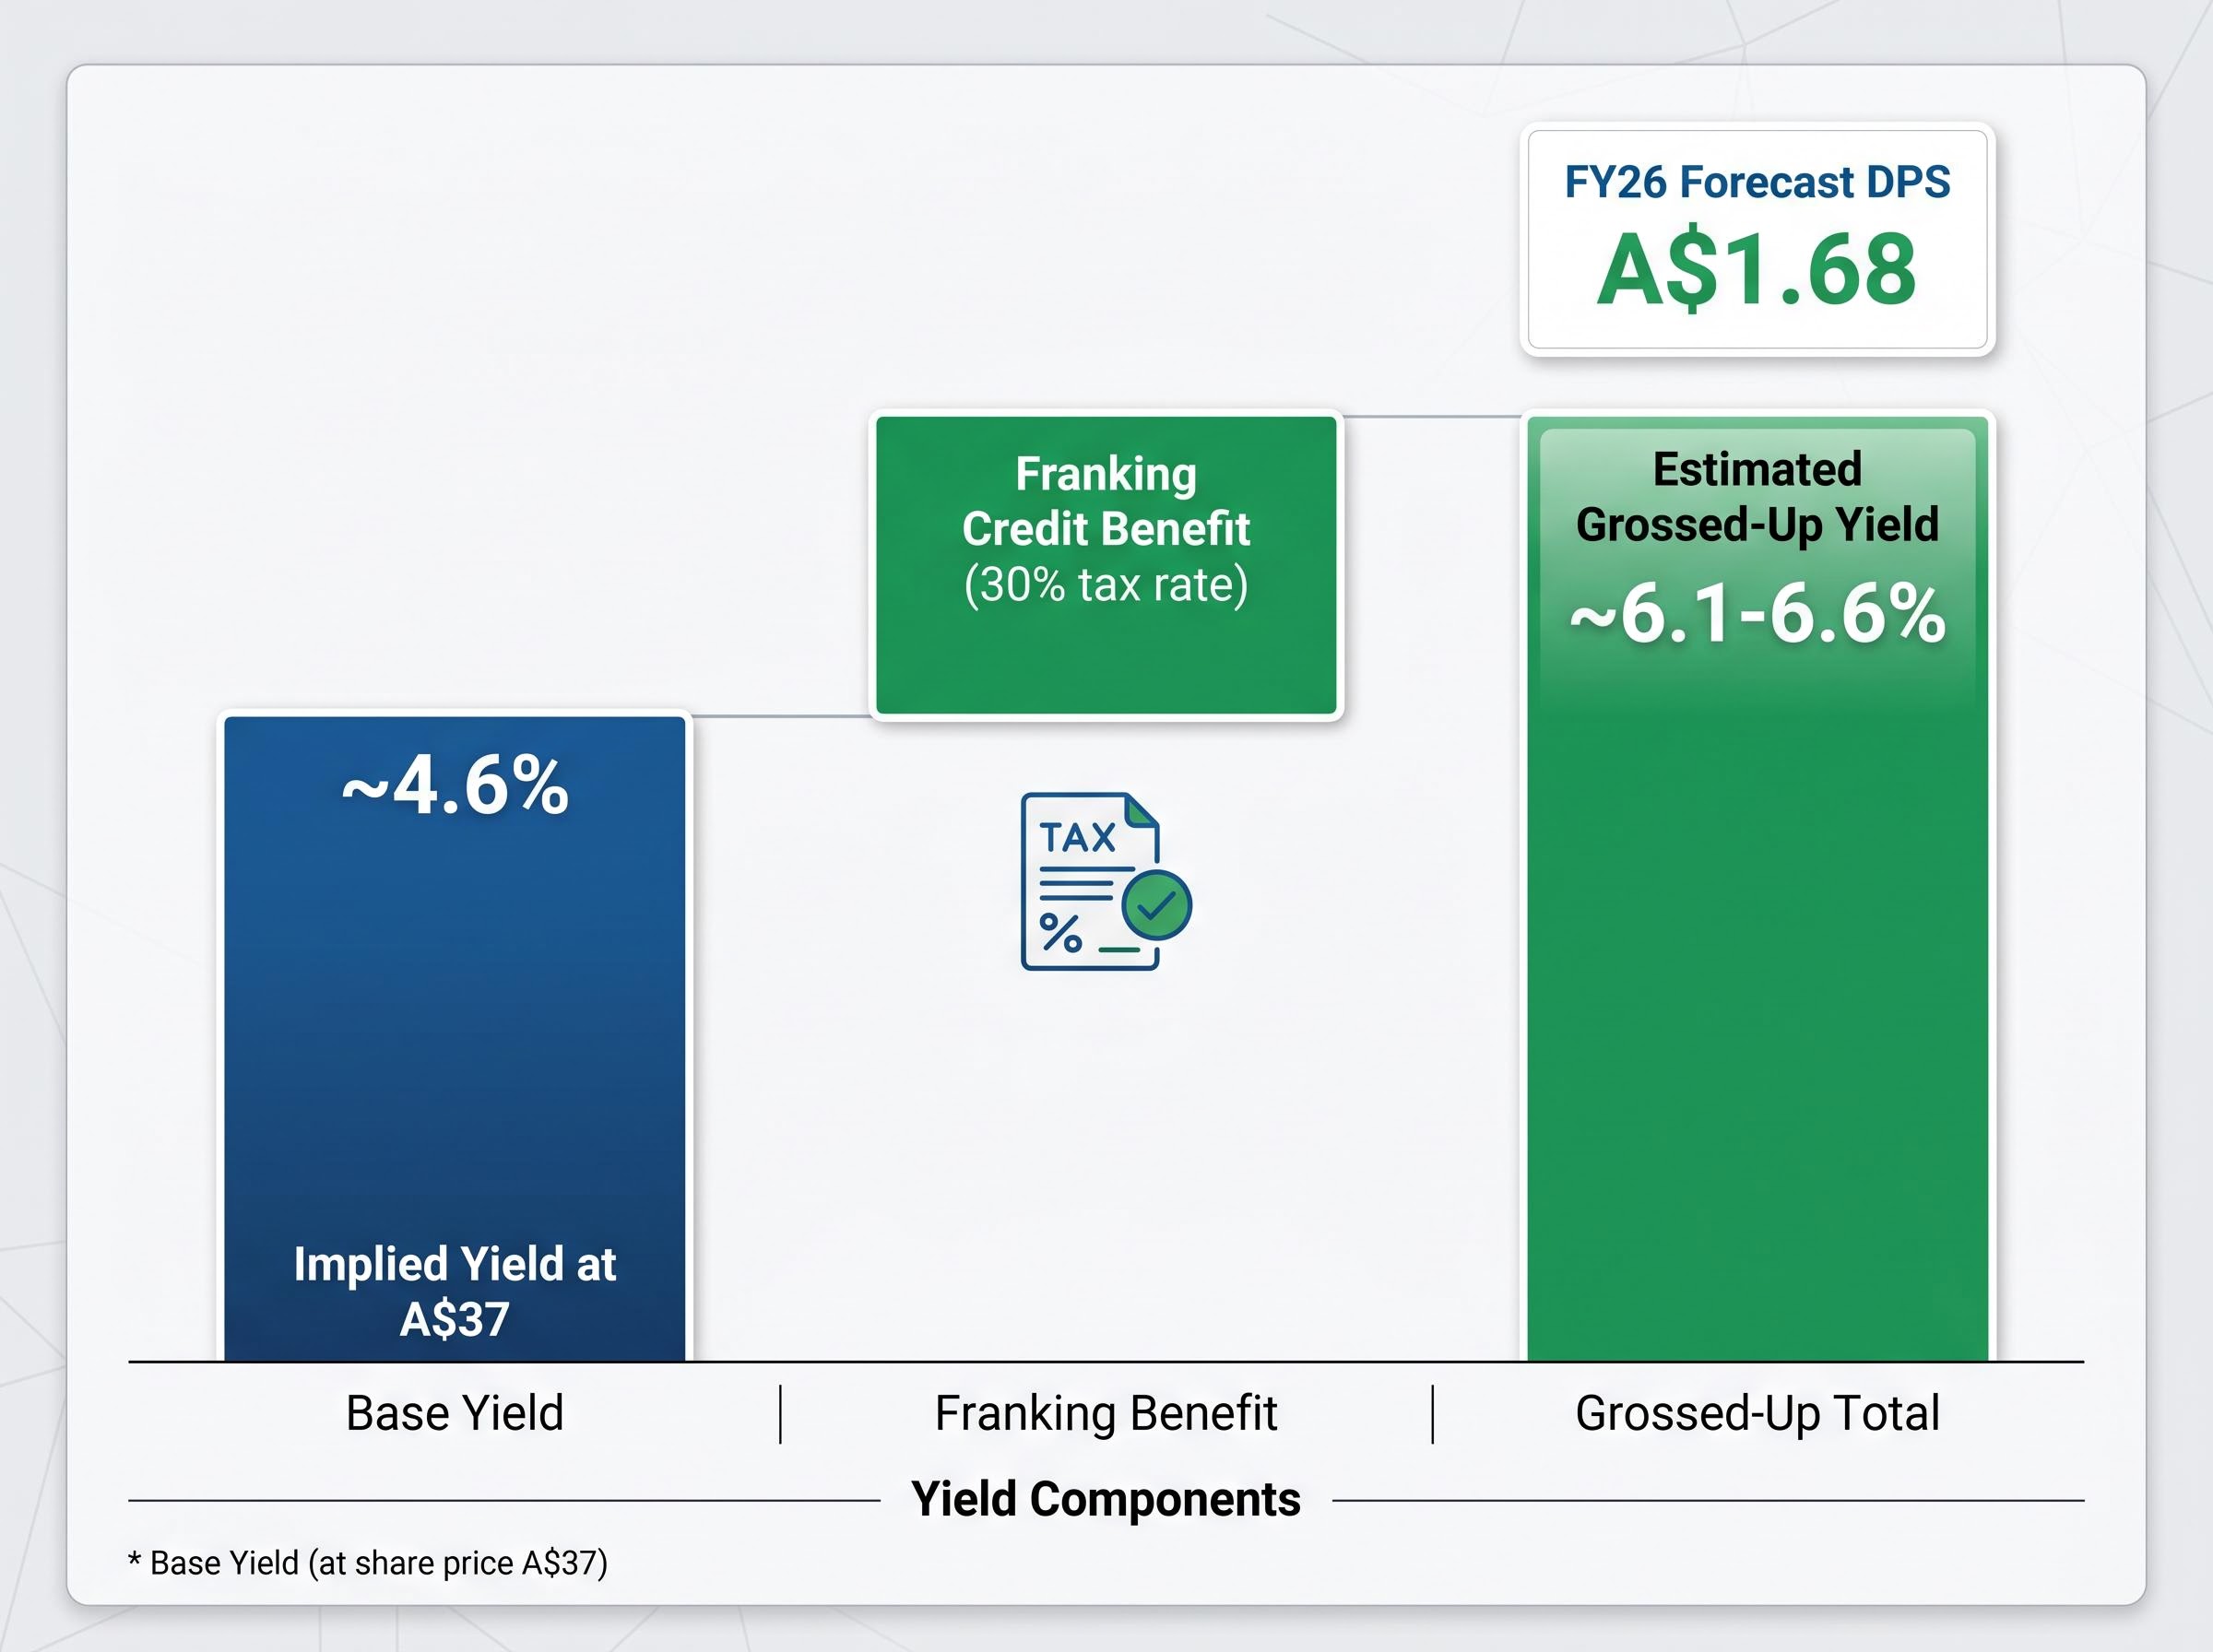
Franking credits represent tax already paid at the corporate level. For an Australian investor in the 30% marginal tax bracket, these credits reduce the personal tax owed on dividend income, effectively lifting the after-tax yield by an estimated 1.5-2 percentage points above the headline 4.6%.
| Metric | Value | Notes |
|---|---|---|
| FY26 Forecast DPS | A$1.68 | CommSec estimate |
| Implied Yield at A$37 | ~4.6% | Headline, pre-franking |
| Estimated Grossed-Up Yield (30% tax rate) | ~6.1-6.6% | Includes franking credit benefit |
The 3-year TSR of 86.1% further illustrates the compounding effect of reinvested dividends during a period of share price recovery. A smoothed payout ratio of approximately 84% (based on three-year data, though the FY26-specific figure remains unconfirmed) suggests ANZ has prioritised returning capital to shareholders over aggressive retained earnings growth.
For investors evaluating ANZ as an income holding, the distinction between headline yield and effective after-tax return is material. The raw 4.6% understates the income case for most Australian taxpayers.
Share prices move for two reasons: the company earns more profit, or the market decides to pay a higher multiple for the same profit. Separating these two levers reveals which force actually drove ANZ’s 27% capital gain.
Start with the profit comparison. In Q1 FY21, ANZ reported statutory net profit of A$1.6 billion and cash net profit of A$1.8 billion. By Q1 FY26, statutory profit had risen to A$1.87 billion and cash profit to A$1.94 billion.
| Metric | Q1 FY21 | Q1 FY26 |
|---|---|---|
| Statutory Net Profit | A$1.6B | A$1.87B (+16.9%) |
| Cash Net Profit | A$1.8B | A$1.94B (+5%) |
The 16.9% statutory profit growth over five years is real. It is also not extraordinary. Cash profit grew just 5% over the same period. Neither figure comes close to explaining a 27% share price gain on its own.
That leaves the second lever.
If the price-to-earnings (P/E) multiple had remained flat over the five-year period, the share price gain would have tracked somewhere in the 5-17% range, broadly matching the profit growth. The actual 27% capital appreciation exceeded that range, meaning the market became willing to pay more for each dollar of ANZ’s earnings.
CommSec estimates ANZ’s FY26 P/E at approximately 14x. This multiple reflects investor confidence in the earnings trajectory, particularly the Q1 FY26 uptick, even though FY25 statutory profit fell approximately 10% year-on-year. The market, in effect, looked through the FY25 dip and priced future earnings improvement.
Multiple expansion is the less visible of the two levers, yet for ANZ over this period, it was the more consequential one. Investors who attribute the full 27% gain to profit growth misread the source of their returns, and that misreading carries implications for how sustainable the gain may prove.
The price-to-earnings ratio measures what a shareholder pays for each dollar of a company’s annual profit. A P/E of 14x means the market values the stock at fourteen times its yearly earnings. It is the most commonly referenced valuation metric for bank stocks, and the most commonly misinterpreted.
Bank stocks typically trade at lower P/E multiples than technology or growth companies. Several structural characteristics explain the difference:
ANZ’s current 14x FY26 P/E estimate sits at a premium within this context. According to CommSec, the elevated multiple reflects investor confidence in the earnings trajectory rather than a reward for past performance. This reading is supported by the Q1 FY26 cash profit of A$1.94 billion and a CET1 ratio of 12.15%, which signals the regulatory capital strength that underpins earnings quality.
According to Simply Wall St analysis, ANZ trades at approximately a 6.6% discount to estimated intrinsic value at A$37.92, suggesting the current price may not fully reflect the earnings improvement trajectory.
Whether 14x represents fair value depends on whether the earnings trajectory that justified the re-rating actually materialises. The FY25 statutory profit decline of approximately 10% year-on-year serves as a counterpoint: the market is pricing future earnings, not rewarding the most recent full-year result. That distinction matters for anyone assessing whether the current multiple is sustainable.
The 11% average annual TSR was not earned in a straight line. The five-year measurement window beginning in April 2021 coincided with ANZ’s recovery to pre-COVID price levels, meaning the starting point already reflected a significant rebound driven largely by central bank intervention rather than bank-specific operational gains.
RBA rate policy and fiscal stimulus provided the macro tailwind beneath the chart. ANZ benefited alongside the entire banking sector, as lower provisioning requirements and recovering credit demand lifted earnings from their COVID trough.
What followed tested conviction:
The gap between A$27.85 and A$41.00 within a single 52-week window shows that even a recovery-phase bank stock carries meaningful price risk. Shareholders who sold at the trough captured none of the subsequent rally. The 11% average annual TSR rewarded patience, not timing, a pattern that tends to repeat across bank stock cycles.
The backward-looking decomposition explains how the 27% gain was built. The forward-looking question is whether the 14x FY26 P/E has room to hold, expand, or compress.
The market is pricing ANZ’s earnings improvement trajectory. The Q1 FY26 cash profit of A$1.94 billion and a CET1 ratio of 12.15% support that reading. FY25 revenue of A$21.75 billion (up 8.0% year-on-year) provides a top-line growth base, even as statutory profit declined.
Two unresolved variables sit beneath the multiple. The Suncorp Bank integration remains in progress, with enterprise agreement negotiations ongoing and the Finance Sector Union reporting member opposition to proposed terms. Until integration costs and earnings contribution are quantified, the market is pricing Suncorp’s value on expectation rather than evidence.
The second variable is the net interest margin (NIM), reported at approximately 1.56% for Q1 FY26. NIM direction will be shaped by RBA rate decisions, which remain a direct earnings lever for the Big Four.
According to Simply Wall St, ANZ trades at approximately a 6.6% discount to estimated intrinsic value at A$37.92, providing a third-party valuation anchor as investors assess the forward outlook.
The 13 May 2026 half-year results represent the next scheduled catalyst. Specific metrics to monitor:
These four data points will determine whether the 14x multiple is validated by execution or challenged by integration complexity and margin pressure. Past performance does not guarantee future results, and financial projections remain subject to market conditions and various risk factors.
ANZ’s five-year return decomposes cleanly into three forces: modest profit growth of 5-17% depending on the measure, meaningful multiple expansion that amplified the capital gain beyond earnings growth alone, and a fully franked dividend stream that bridged the gap between a 27% price gain and an 11% average annual TSR. That three-driver framework applies to any Big Four bank stock, not just ANZ.
The unresolved variables are specific: Suncorp integration execution, RBA rate trajectory, and NIM direction. None can be forecast with certainty, and these statements remain speculative and subject to change based on market developments and company performance.
What this analysis supports is a structured monitoring approach rather than a passive hold. The 13 May 2026 half-year results will either confirm or challenge the earnings trajectory the 14x multiple is pricing. Investors holding or evaluating ANZ now have a checklist of specific metrics to watch, rather than a generic sense of cautious optimism.
This article is for informational purposes only and should not be considered financial advice. Investors should conduct their own research and consult with financial professionals before making investment decisions.
A price-to-earnings (P/E) ratio measures how much investors pay for each dollar of a company's annual profit. ANZ's FY26 P/E of approximately 14x means the market values the stock at fourteen times its yearly earnings, and shifts in this multiple can amplify or reduce capital gains beyond what profit growth alone would deliver.
An investor who put A$10,000 into ANZ in April 2021 would have accumulated roughly 350 shares, which at the current price of approximately A$37.92 reflects a 27% capital gain, while the total shareholder return including dividends averaged approximately 11% per year over the five-year period.
ANZ's FY26 forecast dividend of A$1.68 per share implies a headline yield of approximately 4.6% at the A$37 price level, but fully franked dividends lift the effective grossed-up yield to an estimated 6.1-6.6% for investors in the 30% tax bracket, adding roughly 1.5-2 percentage points above the headline figure.
Investors should monitor four specific data points: the net interest margin trajectory from its current 1.56% level, progress and cost synergies from the Suncorp Bank integration, stability of the CET1 capital ratio at 12.15%, and any guidance on dividend sustainability or changes to dividends per share.
The capital gain exceeded ANZ's underlying profit growth because the market expanded the earnings multiple it was willing to pay, meaning investors assigned greater value to each dollar of earnings over the period. This multiple expansion, rather than profit growth alone, was the more consequential driver of the 27% capital appreciation.