KOSPI Drops 10% as Crowded AI Trade Unwinds Across Global Markets
6 hrs ago

The big four bank shares just posted their steepest weekly declines of 2026, and the sell-off has made their dividend yields more attractive than they have been in months. Over the five trading days to 30 April 2026, Commonwealth Bank fell 3.24%, ANZ dropped 2.6%, NAB shed 1.9%, and Westpac slipped 0.8%, all against a broader ASX 200 retreat of roughly 2%. The timing creates a tension that income-focused investors are already weighing: most broker coverage is cautious, with Morgans holding sell ratings on all four banks, yet the pullback has mechanically lifted entry yields at a moment when the RBA cash rate sits at 4.10%. This analysis cuts through the sell ratings to identify which of the big four currently offers the strongest case for income investors, comparing dividend yields, franking credits, grossed-up returns, and the one bank still attracting bullish analyst targets.
The declines were sector-wide rather than stock-specific. All four banks sold off alongside the ASX 200’s roughly 2% retreat, with CBA leading the fall at -3.24% and Westpac holding up best at -0.8%.
Five-day price performance to 30 April 2026:
For income investors, the arithmetic works in a specific way when prices fall. A bank paying the same dividend at a lower share price delivers a higher yield on entry. That is not a guarantee of value, but it is the mechanism that makes the current pullback worth examining rather than dismissing.
The structural context matters here too. The big four collectively hold more than 75% of the Australian domestic banking market, giving them a concentration of deposit funding and mortgage origination that smaller income plays cannot replicate. Price weakness across banks of this scale is a yield-entry question before it is a capital-risk question.
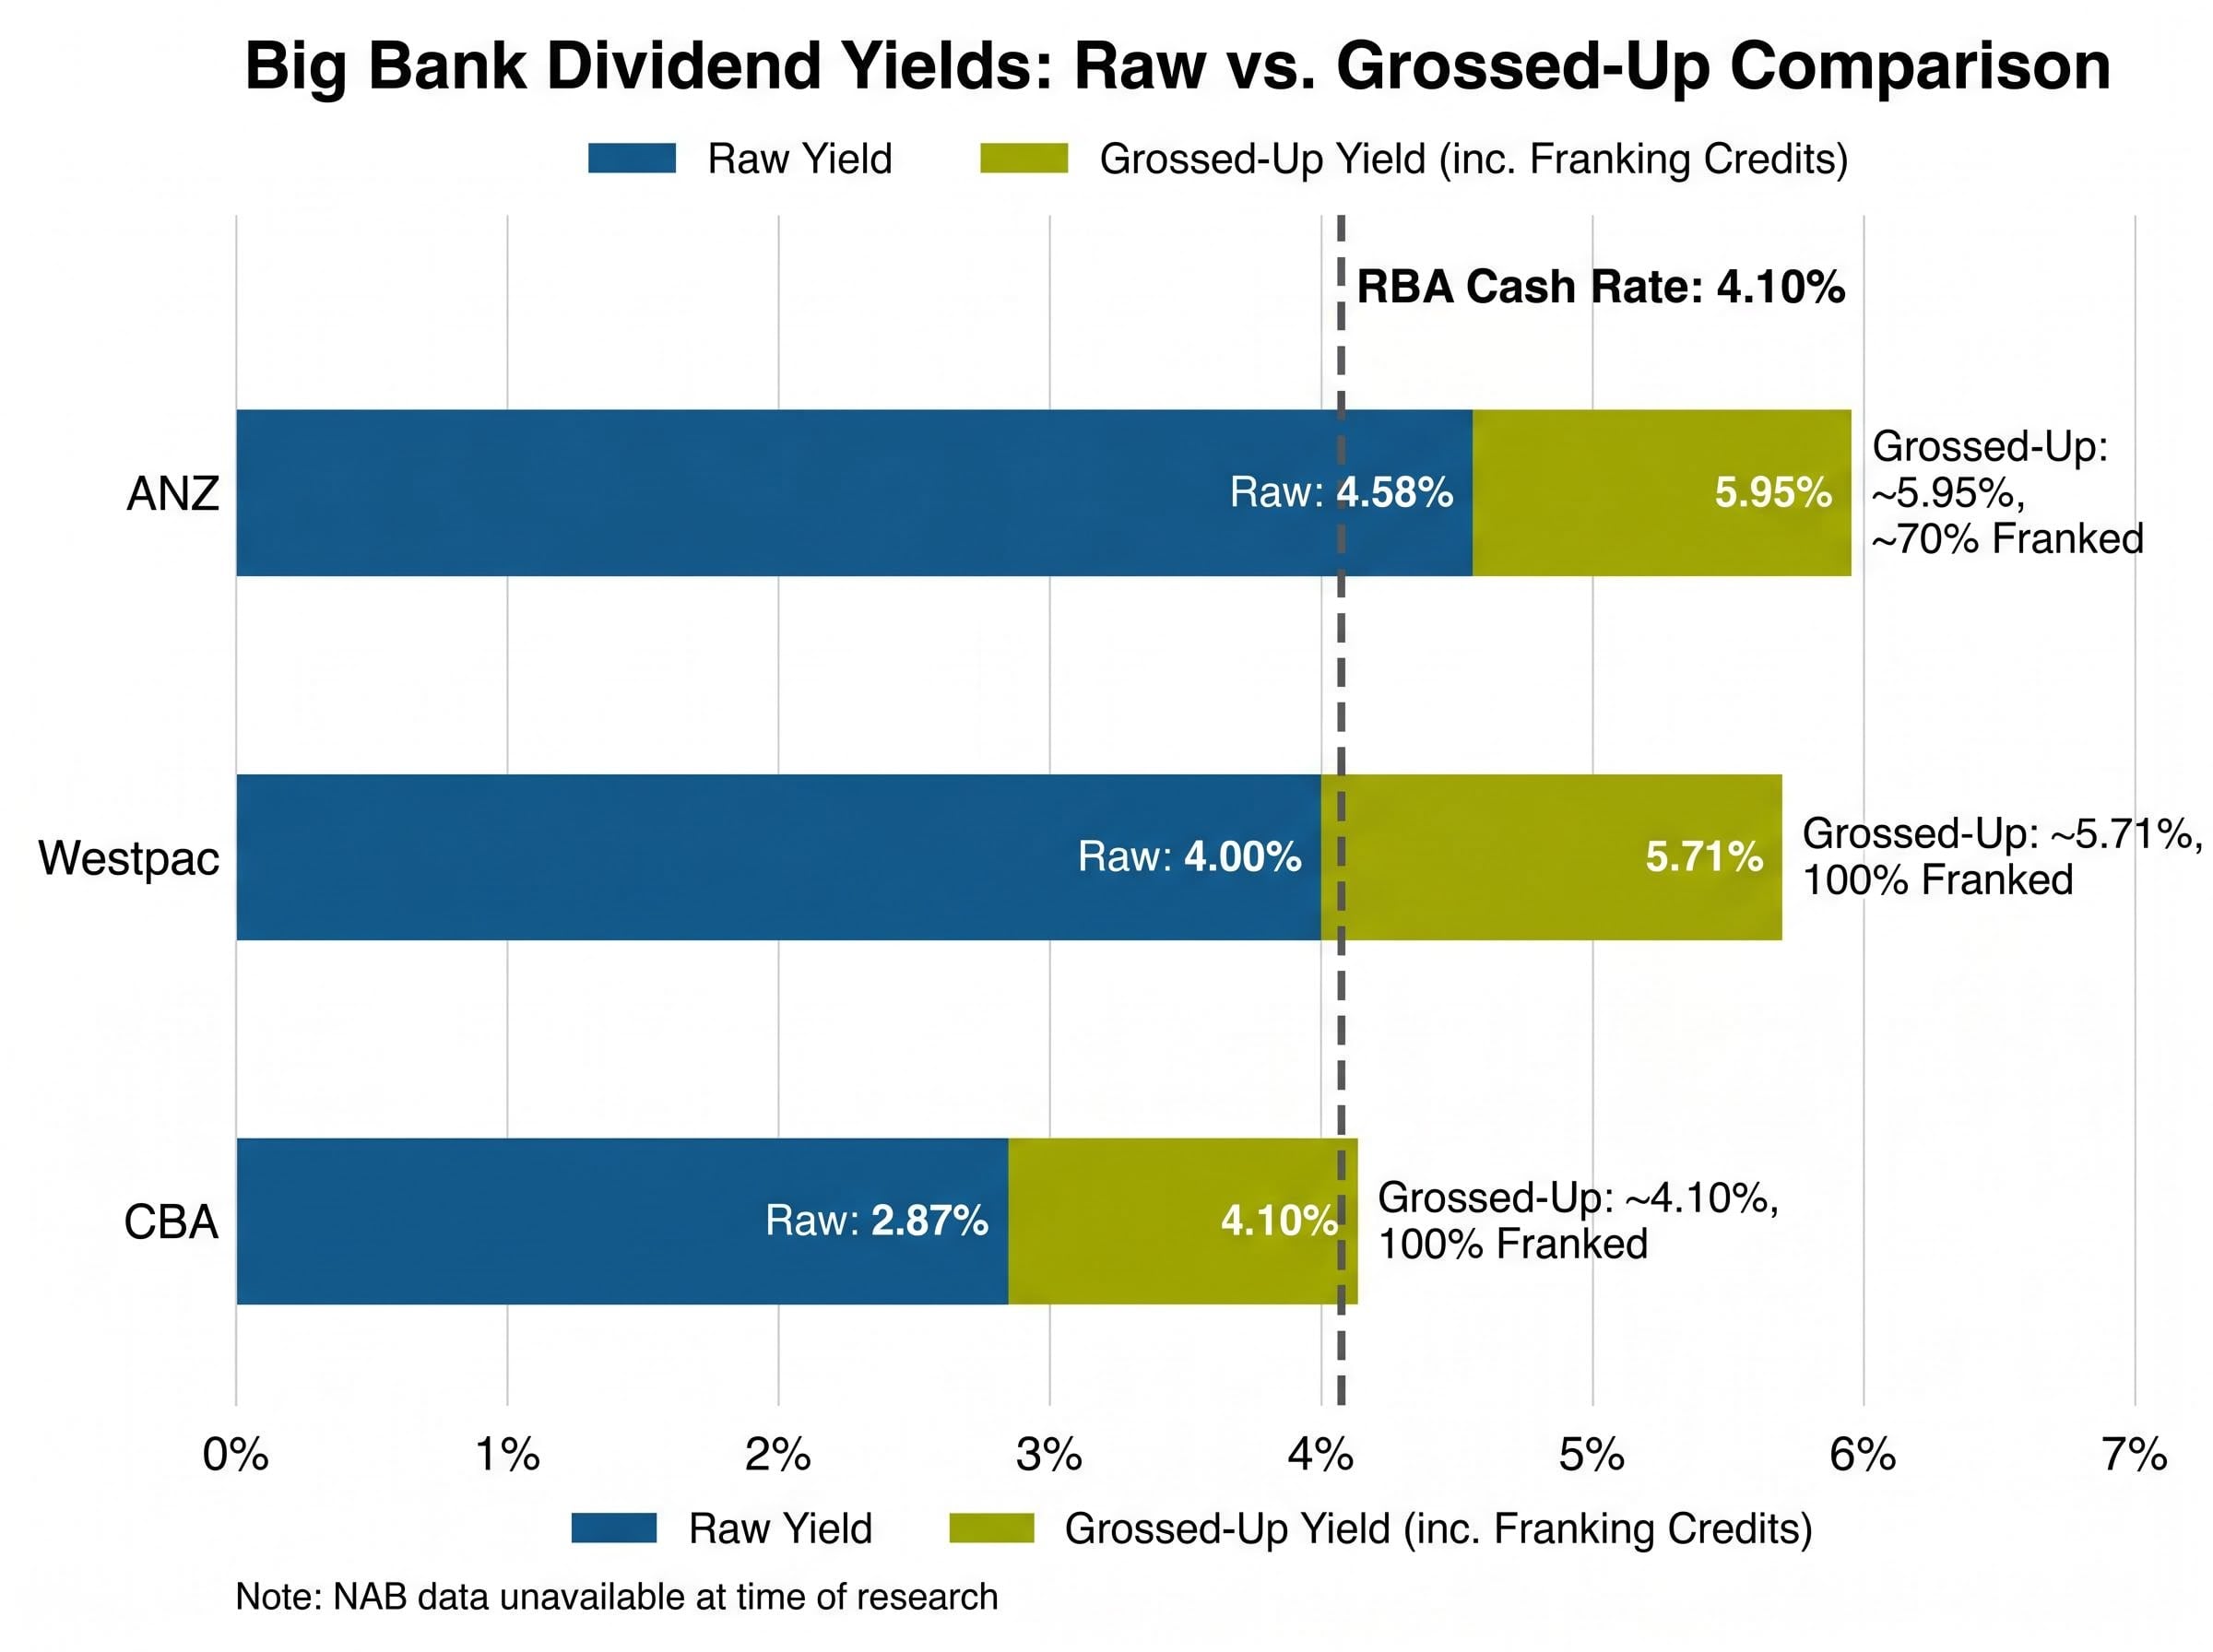
Raw dividend yields tell part of the story. For Australian tax-resident investors, the franking credit attached to each dividend changes the real income comparison materially.
The table below presents the confirmed yield and franking data for three of the four banks. NAB data was unavailable at the time of writing.
| Bank | Share Price | Raw Yield | Franking Level | Grossed-Up Yield |
|---|---|---|---|---|
| ANZ | $36.74 | 4.58% | ~70% | ~5.95% |
| CBA | $173.42 | 2.87% | 100% | ~4.10% |
| Westpac | $38.38 | 4.00% | 100% | ~5.71% |
| NAB | Data unavailable at time of research | |||
ANZ leads on raw yield at 4.58%, though its approximately 70% partial franking means a portion of the dividend carries no franking credit. The grossed-up yield of roughly 5.95% reflects this blend. Westpac yields 4.00% raw, but its 100% franking level lifts the grossed-up figure to approximately 5.71%, making it more competitive on an after-tax basis than the raw number suggests. CBA trails at 2.87% raw, grossing up to around 4.10%.
For context, Westpac’s FY25 final dividend of 77 cents per share (fully franked) is confirmed. The commonly cited total annual figure of $1.54 should be treated with caution, as only the final dividend has been verified against live data.
Income benchmark: At a grossed-up yield of approximately 4.10%, CBA’s income return currently matches the RBA cash rate of 4.10%. Both ANZ and Westpac offer grossed-up yields that sit meaningfully above the risk-free rate, at 5.95% and 5.71% respectively.
The franking distinction matters most for investors in lower marginal tax brackets, where the full franking credit can offset tax owed on other income. Partially franked dividends, such as ANZ’s, still carry a credit on the franked portion but deliver less tax benefit per dollar of income received.
The compounding effect of franking credits on total return is more pronounced for CBA than its headline yield suggests; a two-year holding period to April 2026 produced an estimated 72% total return against a 52.5% price gain, with fully franked dividends and reinvestment accounting for the gap.
The ATO guidance on franking credit refunds confirms that eligible Australian resident individuals can receive the full value of attached franking credits as a tax offset or cash refund, which is the mechanism that lifts ANZ’s and Westpac’s grossed-up yields materially above their headline cash figures.
A price-to-earnings (P/E) multiple measures how much investors are paying for each dollar of a company’s annual profit. A stock trading at 18x earnings costs $18 for every $1 of profit the company generates, while a stock at 28x costs $28 for the same dollar. For income investors, a lower P/E can indicate that the entry price leaves more room for the dividend yield to compound over time, though it does not guarantee value on its own.
On this measure, the gap between the big four is wide. ANZ trades at 18.38x earnings. Westpac sits at 19.38x. CBA commands 28.11x, a premium of more than 50% over ANZ on a P/E basis. NAB data remains unverified.
CBA’s 28x multiple reflects its position as Australia’s largest bank by market capitalisation, its digital infrastructure lead, and the market’s confidence in its earnings consistency. That premium is a quality signal, not an income signal. On a grossed-up basis, CBA’s yield of approximately 4.10% sits level with the current RBA cash rate, meaning risk-free alternatives are currently competitive with CBA’s income return.
P/E should not be used as a standalone buy signal. Three factors require scrutiny beyond the multiple:
The absence of NAB from this comparison is a genuine analytical limitation. A full four-bank valuation picture is not possible with the data currently available.
The dominant broker position on ANZ is not encouraging.
Morgans holds a sell rating on ANZ with a price target of $30.72, implying approximately 14% downside from the current price of $36.74.
That is not a fringe call. Morgans has sell ratings across the sector, with targets of $124.26 on CBA (approximately 28% downside) and $34.06 on Westpac (approximately 12% downside):
Yet the range of analyst opinion on ANZ is wider than on the other three. According to TradingView data, among 14 analysts covering ANZ, the highest price target is $43, implying approximately 19% upside from $36.74. That spread, from $30.72 to $43, signals that the market has not settled on a verdict.
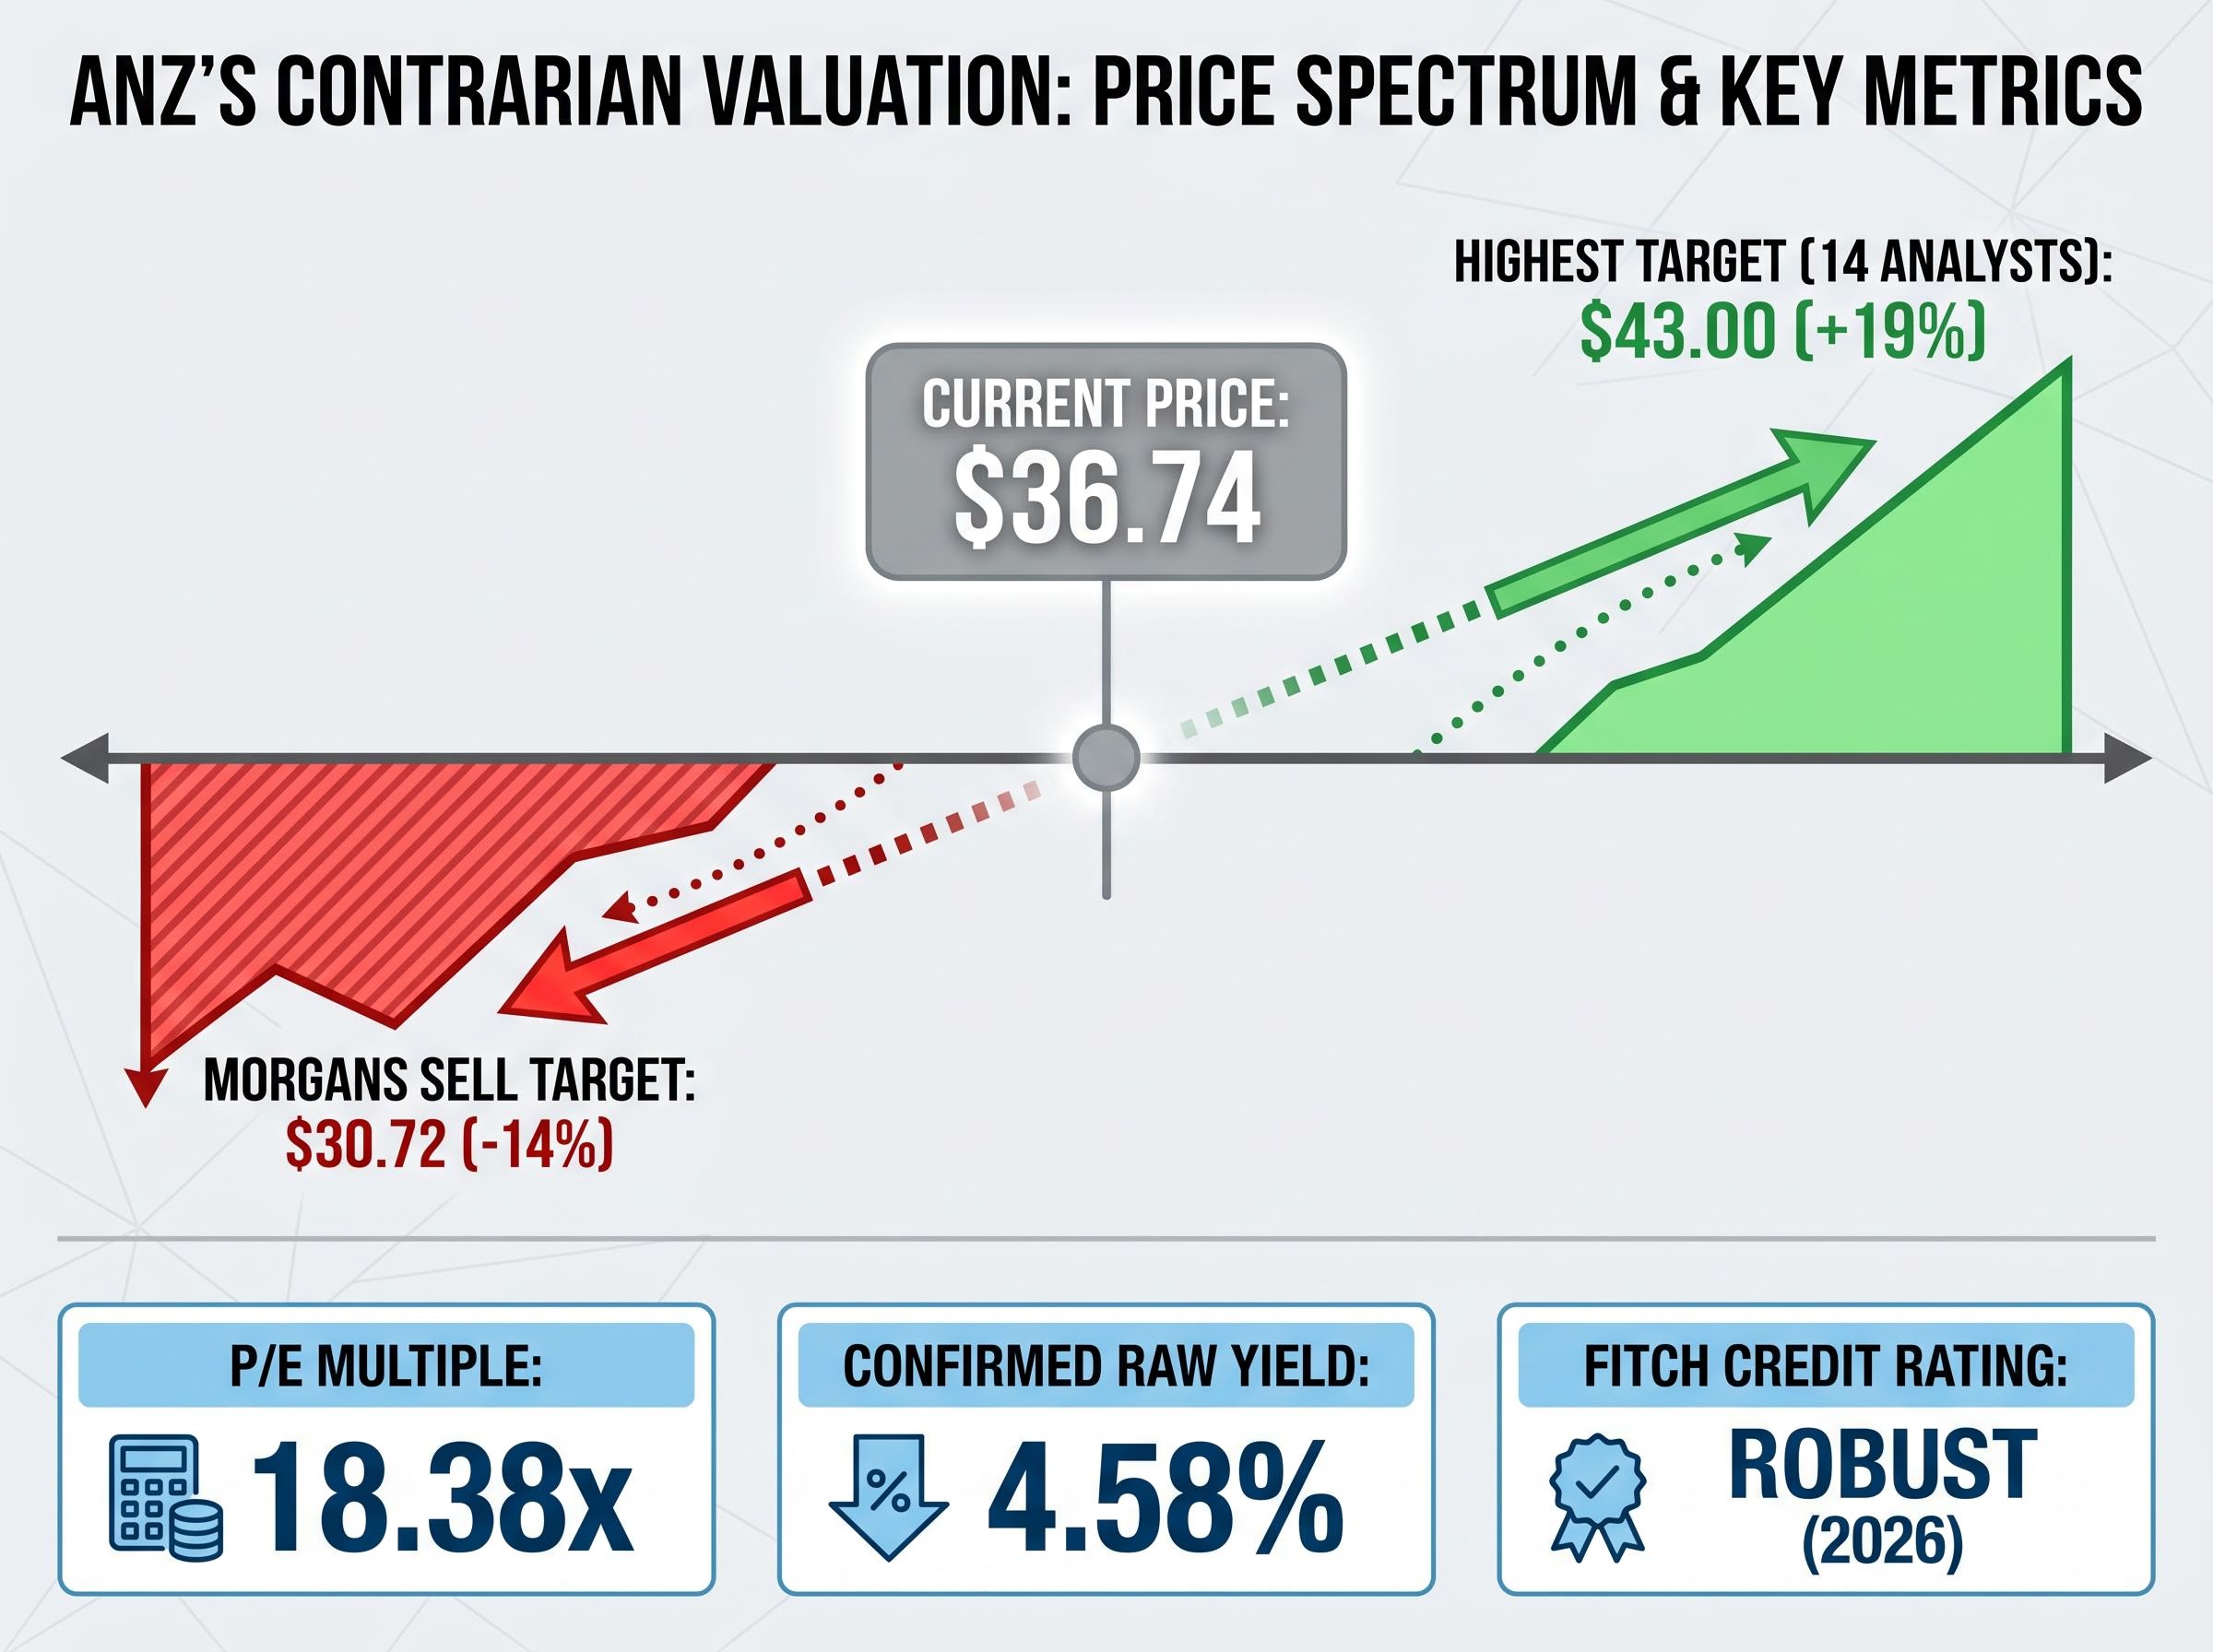
ANZ’s combination of the highest confirmed raw yield (4.58%), the lowest confirmed P/E (18.38x), and the widest analyst upside target makes it the most differentiated income-plus-value proposition among the big four. Fitch Ratings affirmed a robust credit rating for ANZ in 2026, providing a counterweight to the Morgans downside case. The contrarian opportunity is real, but so is the risk embedded in that $30.72 target.
ANZ’s net interest margin expanded 2 basis points to 1.56% in Q1 2026, a directionally positive signal for income sustainability that partially explains why the bullish end of the 14-analyst range holds a $43 target even as Morgans anchors the bear case at $30.72.
Where ANZ offers a single-year yield and valuation argument, Westpac’s income case unfolds over a longer horizon. The appeal is not the current 4.00% yield alone; it is the projected growth path for the dividend itself.
Forward estimates point to Westpac paying $1.605 per share in FY26 and $1.64 per share in FY27. At the current share price of $38.38, those projections imply rising yields year on year, with each payment expected to carry 100% franking.
| Period | Dividend Per Share | Implied Yield at $38.38 | Note |
|---|---|---|---|
| FY25 Final | $0.77 | N/A (half-year only) | Confirmed, fully franked |
| FY25 Total | $1.54 | ~4.01% | Cited in source data; total unconfirmed |
| FY26 (Projected) | $1.605 | ~4.18% | Forward estimate |
| FY27 (Projected) | $1.64 | ~4.27% | Forward estimate |
Westpac reported FY25 net profit of $6.91 billion, and the bank has reportedly extended its share buyback programme through November 2026. A growing dividend supported by buyback activity signals confidence in capital generation.
Westpac’s Q1 FY26 profit of $1.9 billion, representing 5% growth on the H2 FY25 average, provides the underlying earnings support for the projected dividend path, though the authoritative confirmation point for the FY26 interim dividend and updated NIM trajectory is the 5 May 2026 half-year results announcement.
Two caveats apply to this data:
Morningstar holds a neutral outlook for the big four in FY2026, which tempers any aggressive growth assumptions. For income investors planning to hold for two to three years, however, a fully franked dividend on a rising path compounds the income case in a way that a single-year yield snapshot cannot capture.
The income case for ANZ and Westpac rests on current yields, franking benefits, and forward dividend projections. Those figures do not exist in isolation. Four risk dimensions are directly relevant to big four bank income investors in the current macro environment:
The APRA capital adequacy standards require authorised deposit-taking institutions to maintain minimum capital ratios and operate within buffer ranges, and a deterioration in credit conditions could activate those buffers in ways that restrict dividend distributions or curtail buyback programmes across the sector.
Fitch Ratings affirmed robust credit ratings for ANZ, NAB, and Westpac in 2026, providing a baseline of institutional confidence. A KPMG analysis expected around 5 May 2026 may offer additional comparative insight for investors tracking the sector.
This analysis works with verified data for three of the four banks. A complete comparative picture requires NAB yield, franking, and valuation data, alongside broader broker consensus from sources such as Bloomberg Terminal or FactSet.
This article is for informational purposes only and should not be considered financial advice. Investors should conduct their own research and consult with financial professionals before making investment decisions. Past performance does not guarantee future results. Financial projections are subject to market conditions and various risk factors.
The data points in different directions depending on what an income investor prioritises. ANZ offers the highest confirmed raw yield (4.58%), the lowest confirmed P/E (18.38x), and the widest analyst price target range, making it the strongest contrarian income-plus-value case. Westpac offers 100% franking, a growing dividend trajectory through FY27, and $6.91 billion in underlying profit to support that path.
Both sit well above CBA on an income basis. At its current premium valuation, CBA’s grossed-up yield matches the risk-free rate rather than exceeding it.
Four developments will either confirm or challenge these income theses in the months ahead:
For income investors who can tolerate the risk dimensions outlined above, the current pricing of ANZ and Westpac delivers a higher entry yield than the CBA premium valuation affords. The question is not whether the income is attractive. It is whether the macro risks justify the entry.
A grossed-up yield adds the value of franking credits to the raw cash dividend, showing the true pre-tax income return for Australian resident investors who can use those credits to offset tax owed or receive a cash refund from the ATO.
ANZ leads on raw yield at 4.58% and grosses up to approximately 5.95%, though its roughly 70% franking means a portion of the dividend carries no credit; Westpac offers a slightly lower raw yield of 4.00% but grosses up to approximately 5.71% with 100% franking.
The declines were sector-wide rather than stock-specific, with all four banks selling off alongside the broader ASX 200 retreat of roughly 2%; CBA led the fall at 3.24% while Westpac held up best at 0.8%.
At its current valuation, CBA's grossed-up yield of approximately 4.10% matches the RBA cash rate rather than exceeding it, meaning risk-free alternatives are currently competitive with CBA's income return despite its 100% franking.
Key risks include rising mortgage arrears under a 4.10% RBA cash rate, significant residential mortgage book exposure across all four banks, APRA capital adequacy rules that could constrain dividends, and net interest margin sensitivity to any future rate movements.