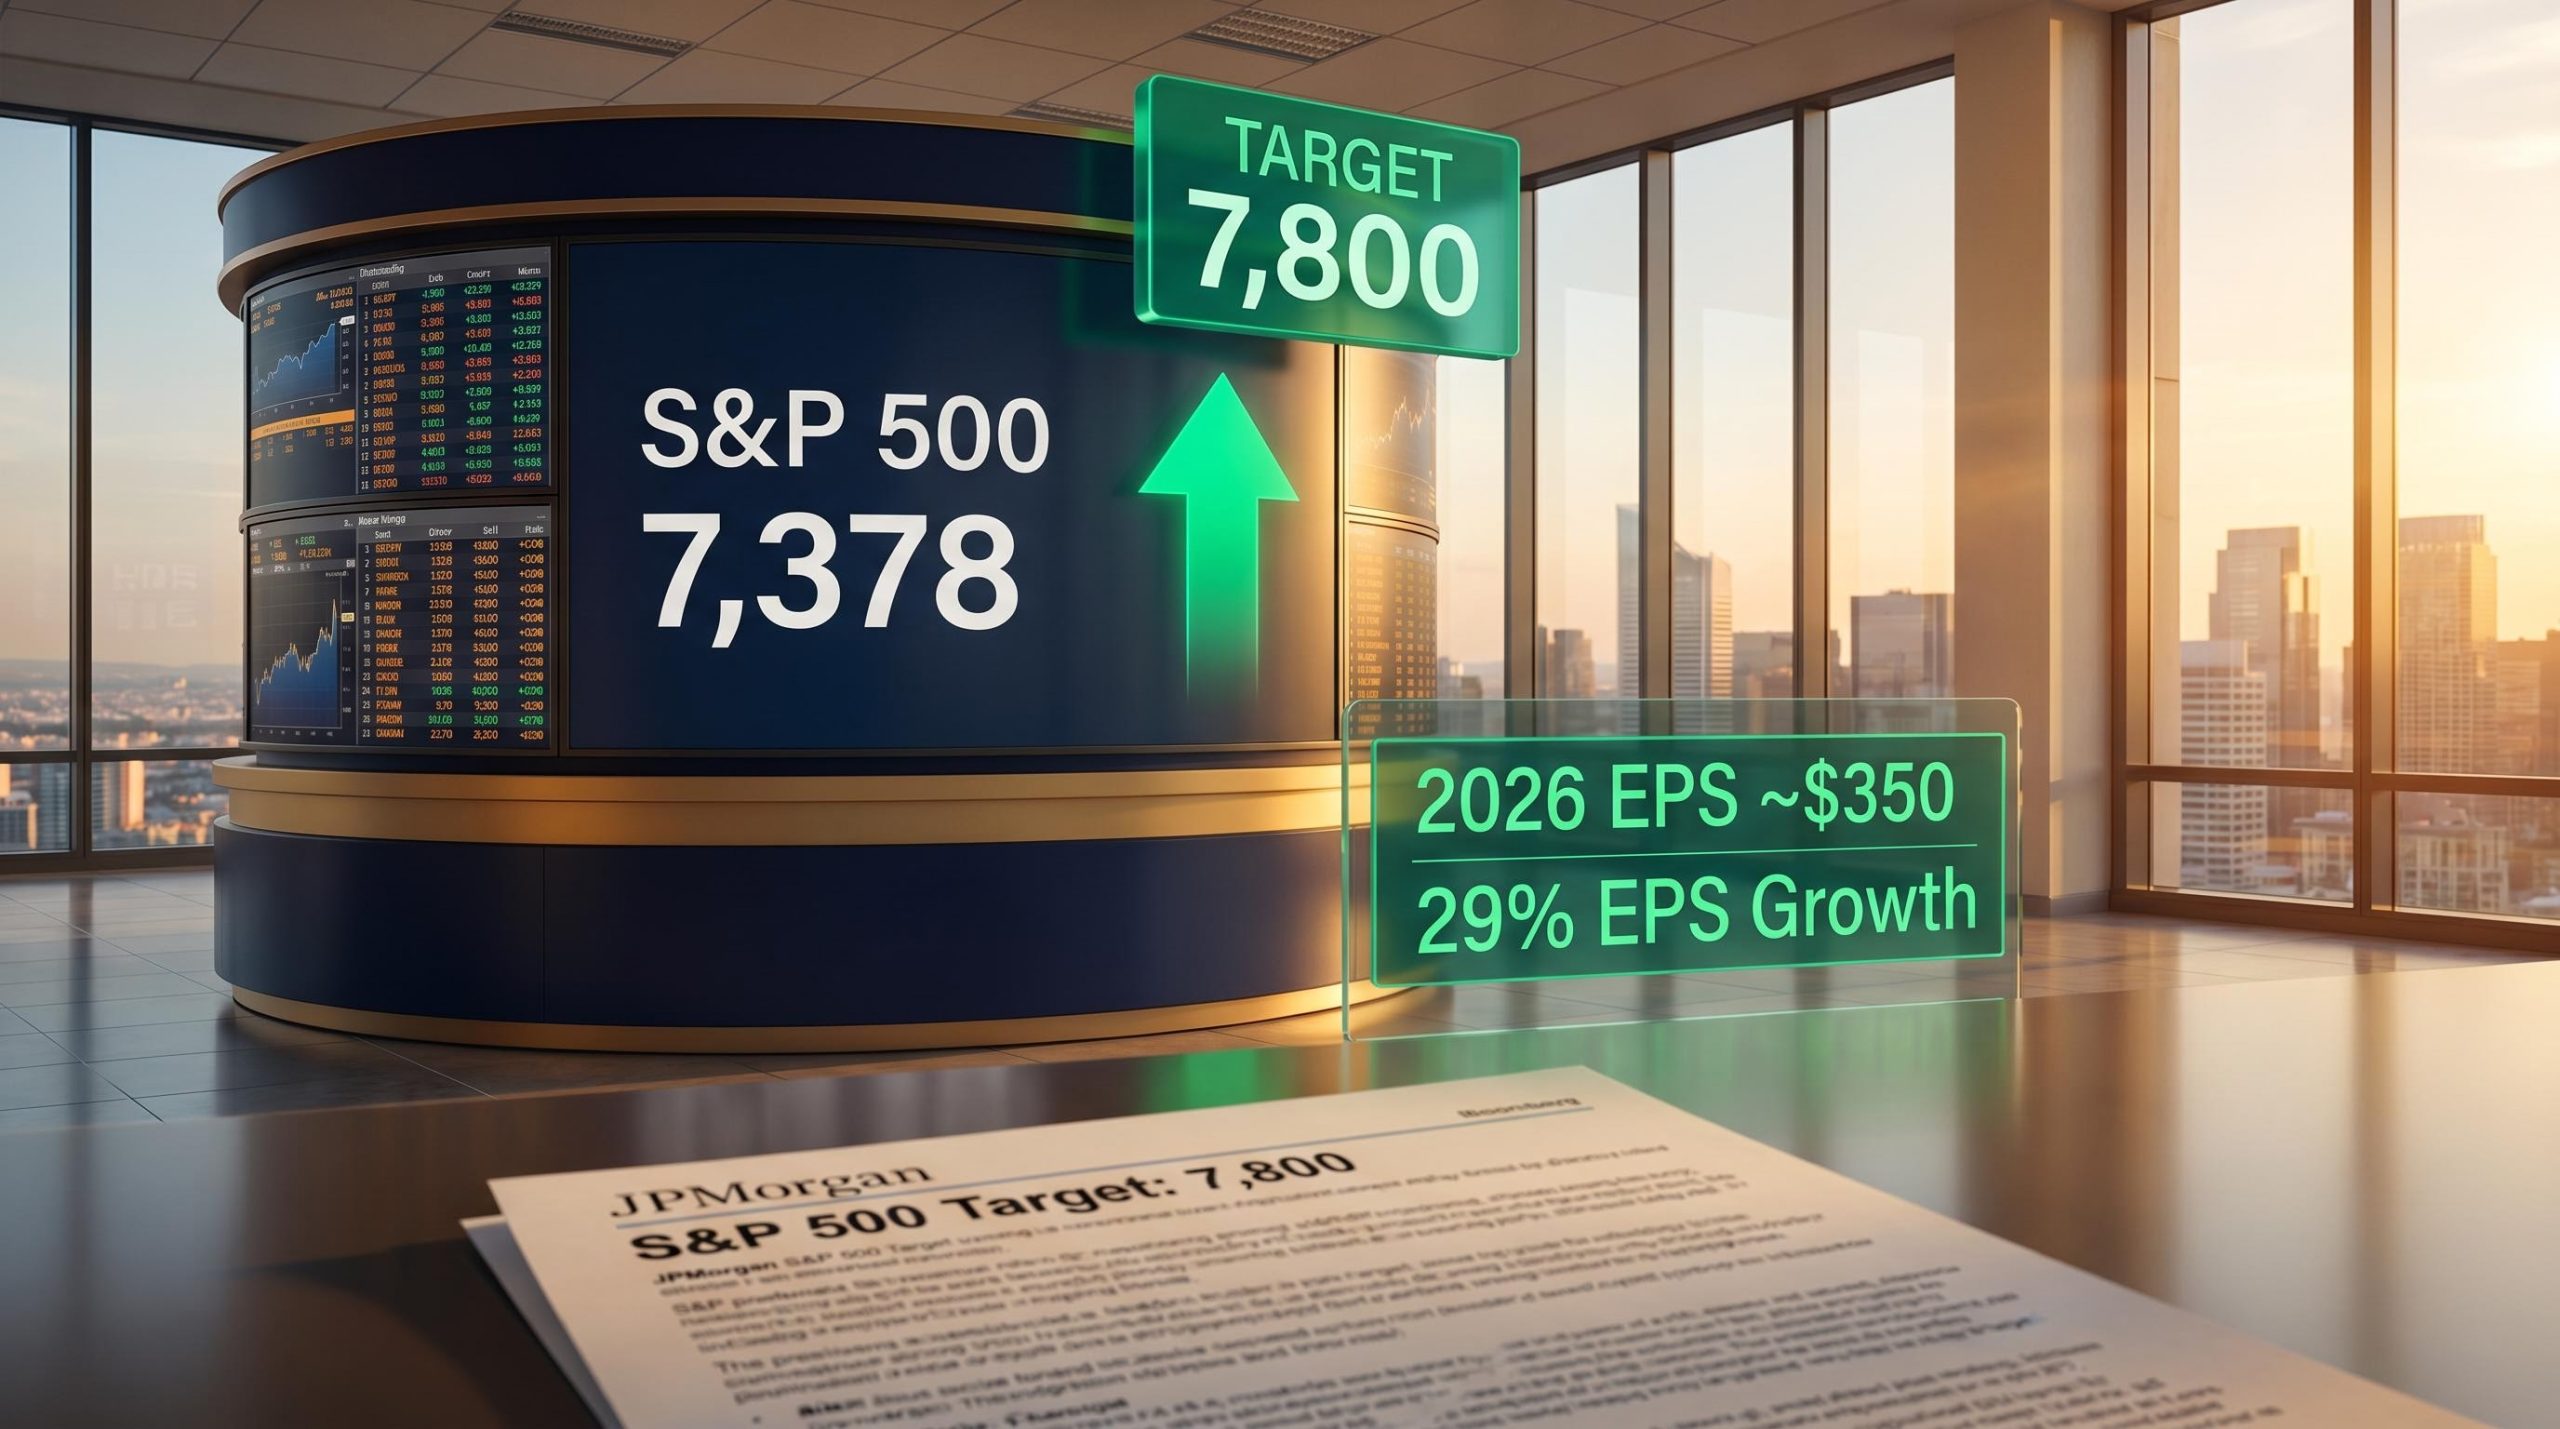
JPMorgan Raises S&P 500 Forecast to 7,800, Citing AI Earnings Boom
2 hrs ago

Goldman Sachs’s U.S. Equity Sentiment Indicator has climbed to 1.7, a reading the firm historically associates with below-average S&P 500 returns over the following two to eight weeks. The signal arrives at an unusual moment. With 63% of S&P 500 companies reported, Q1 2026 earnings per share growth (excluding one-time items) is tracking at 16%, and mega-cap technology names have posted revenue growth of 20% alongside profit growth of 61%. Yet Goldman Sachs strategists, led by chief U.S. equity strategist Ben Snider, are flagging that strong results may have already been absorbed by the market, leaving positioning stretched at a point when the reward for beating expectations has been atypically modest. What follows explains what the 1.7 reading means, why strong earnings and elevated stock market sentiment can coexist as a warning sign, and what specific risks investors should weigh in the weeks ahead.
Goldman’s downside risk framework assigns a 25% probability to a 2026 recession, and with geopolitical variables carrying more weight in a market with limited margin for error, the current positioning environment amplifies the cost of any macro surprise.
As of 4 May 2026, Goldman Sachs’s U.S. Equity Sentiment Indicator stands at 1.7. In the firm’s historical framework, readings at or above this level have preceded below-average S&P 500 returns over the subsequent two to eight weeks, a pattern observed consistently since 2009.
Goldman Sachs Sentiment Signal A reading of 1.7 on the U.S. Equity Sentiment Indicator has historically been associated with below-average S&P 500 returns over a two-to-eight-week horizon, according to Goldman Sachs data since 2009.
The indicator’s weight comes from what it measures. Unlike single-source surveys, Goldman’s composite aggregates multiple inputs:
Goldman’s internal framing places the current reading near the 73rd percentile since 2009. That suggests the market is elevated but not in bubble territory, a distinction that matters. The signal is probabilistic, not deterministic. It does not predict a correction. It indicates that the pool of marginal buyers willing to push prices higher has thinned.
The Q1 2026 earnings season has been, by most measures, exceptional. With 63% of S&P 500 constituents reported, aggregate EPS growth sits at 25%. Strip out non-recurring items, and the figure is 16%, according to Goldman Sachs’s Ben Snider.
That distinction matters more than it might appear. Goldman flags the gap between the two numbers as evidence that headline growth is being distorted by one-time gains that will not repeat. And even the genuinely strong underlying growth has not translated into the kind of post-earnings stock moves investors might expect.
Robinhood illustrates the dynamic. The company reported strong revenue results for Q1 2026 and fell approximately 13% in the sessions that followed. The stock had run up ahead of the print, and when the results confirmed what the market had already priced, there was no incremental buyer left.
Goldman’s strategists have noted that the reward for beating expectations this season has been atypically modest, a signal that much of the good news was already embedded in share prices before the reports arrived.
| Earnings Metric | Goldman’s Caution |
|---|---|
| Aggregate EPS growth: 25% | Non-recurring items distort headline figure |
| EPS growth ex-one-time items: 16% | Strong, but already reflected in positioning |
| Beat rates near record highs | Atypically modest stock price reward for beats |
The numbers from Amazon, Alphabet, Meta, and Microsoft in Q1 2026 are genuinely outstanding. Combined, the four companies delivered 20% revenue growth and 61% profit growth. By any historical standard, these are results that justify investor attention.
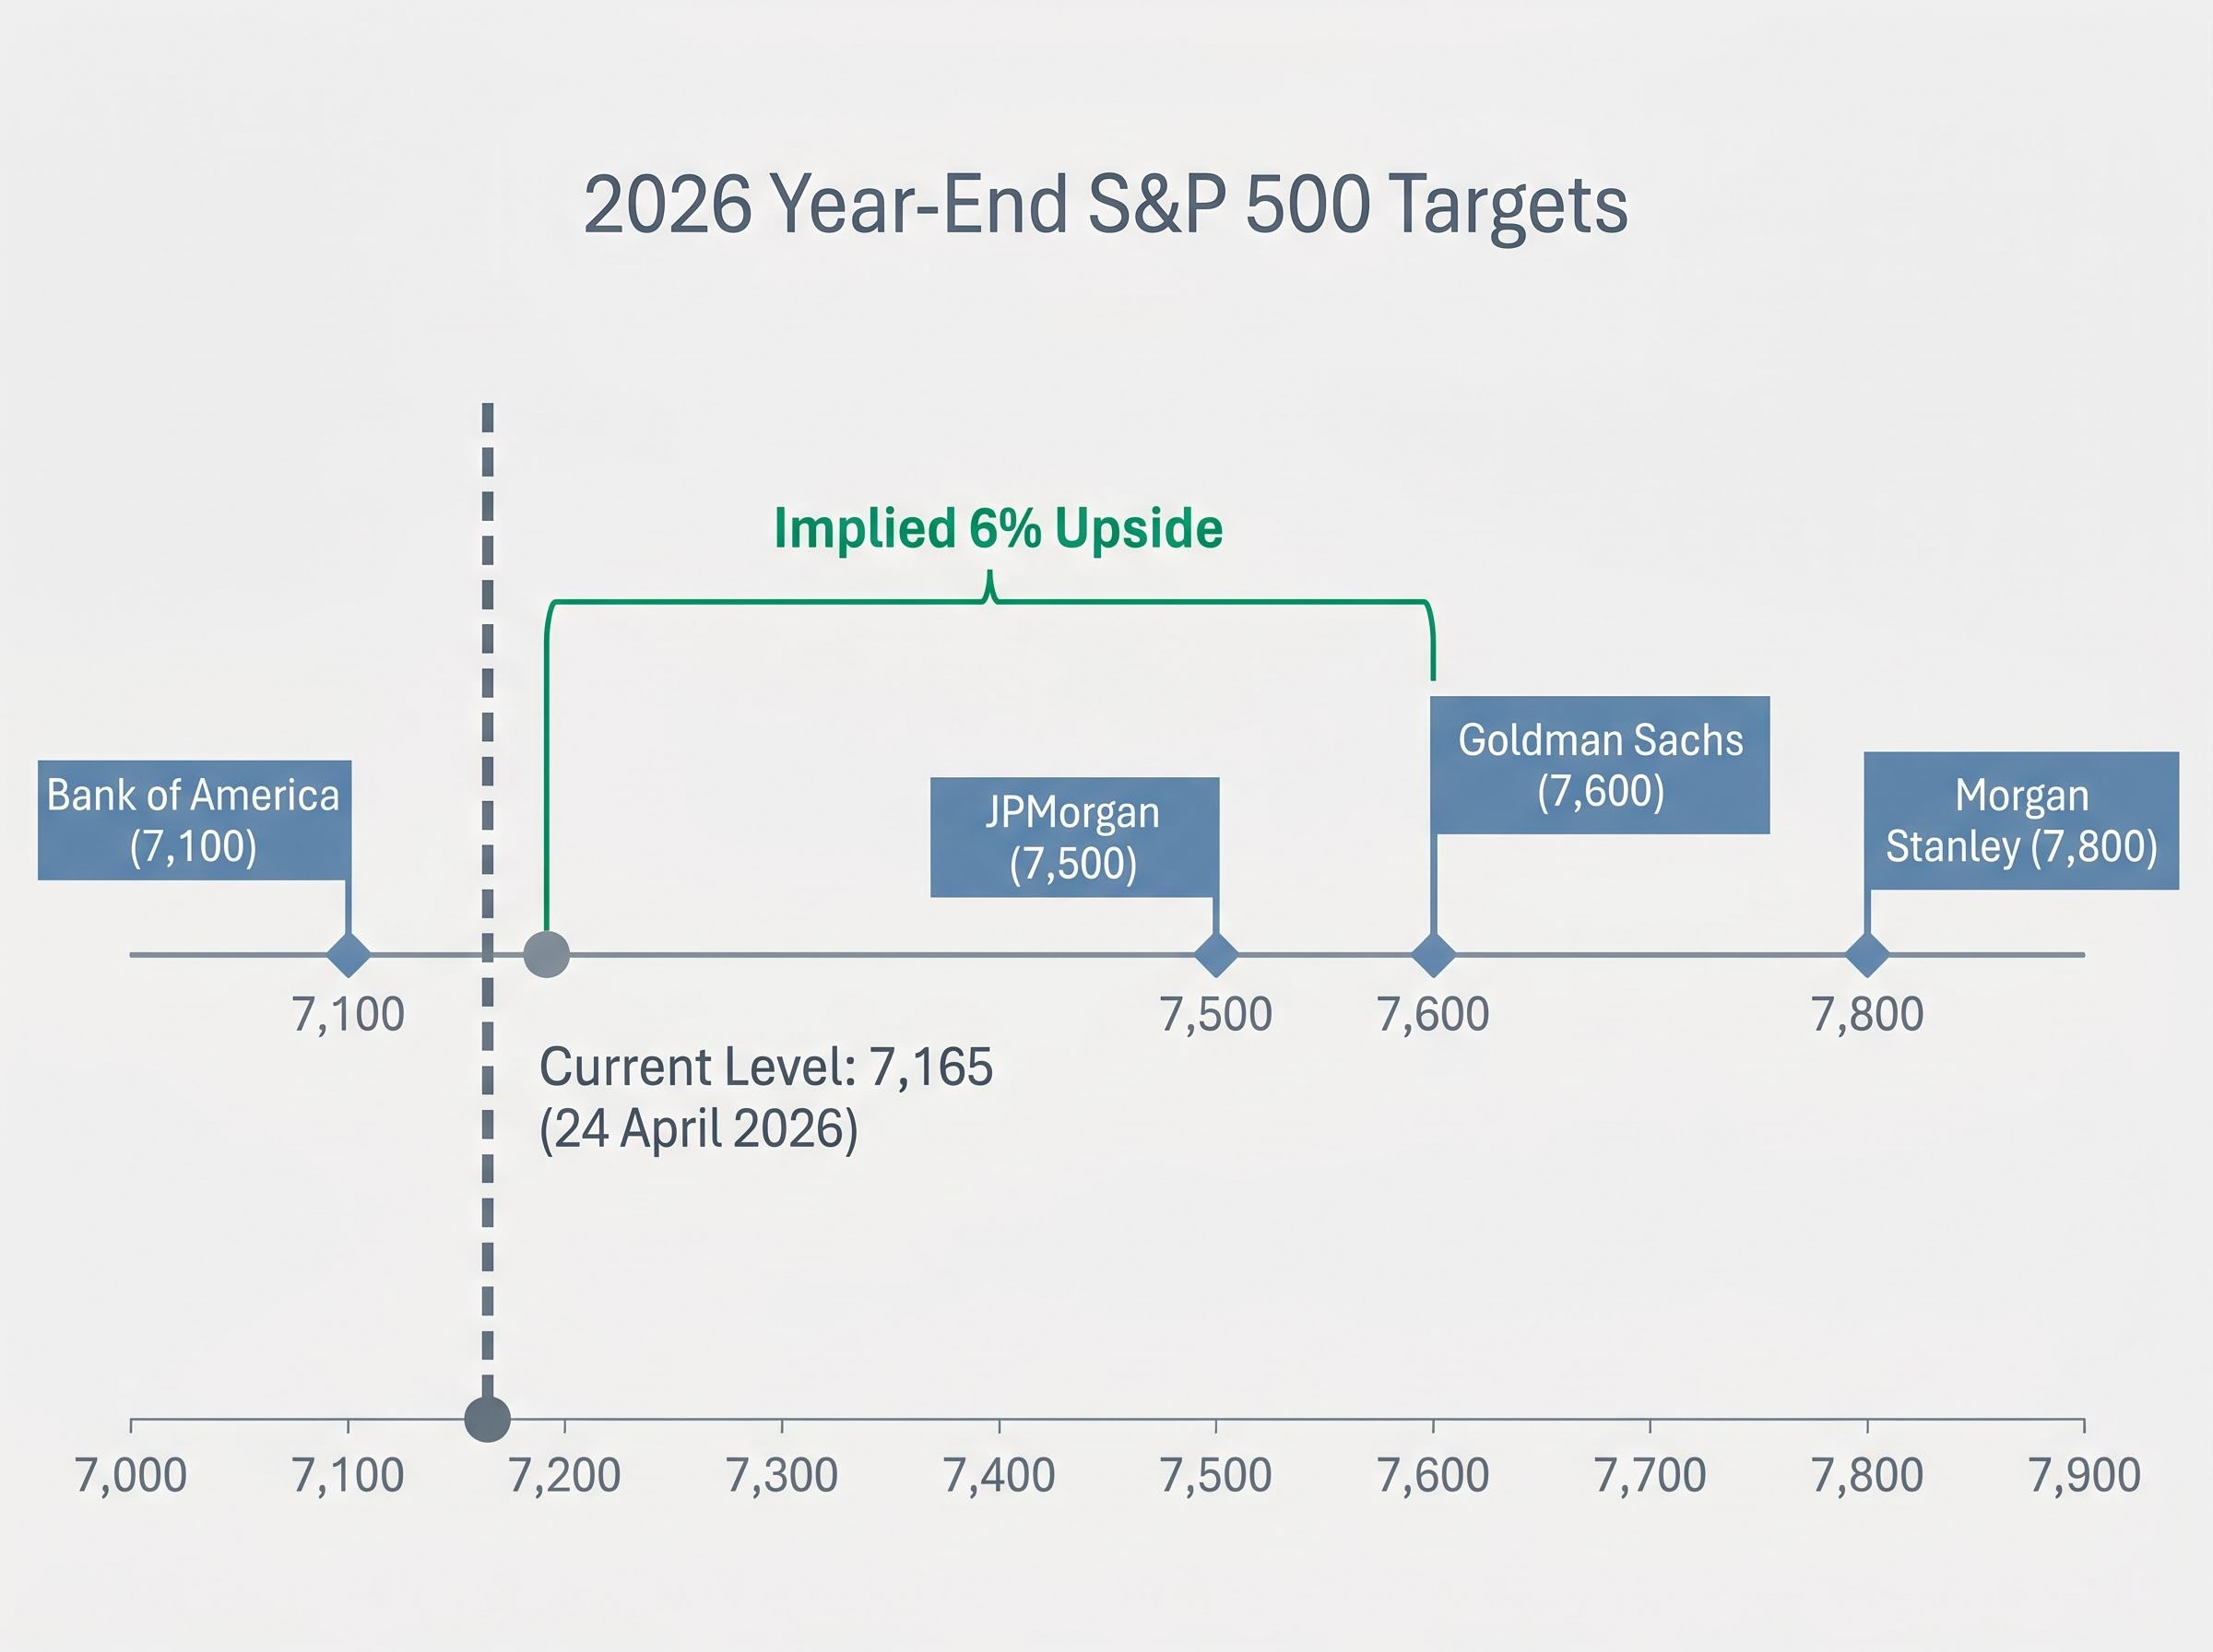
They also concentrate that attention on a dangerously narrow foundation. Goldman Sachs’s Ben Snider has noted that market breadth has narrowed to levels not seen since the dot-com era. The S&P 500, which closed at approximately 7,165 on 24 April 2026, appears healthy at the index level. Beneath the headline, participation in the rally has been limited.
S&P 500 market concentration data shows the top ten stocks now account for a record 42% of index weight, surpassing the peak concentration levels recorded during the dot-com era and giving the narrow-breadth warning from Goldman Sachs a quantifiable dimension.
The concentration carries a specific mechanical risk. When positioning clusters around a small number of names, any sentiment unwind tends to be faster and sharper than when gains are broadly distributed.
Goldman’s year-end S&P 500 target of 7,600 implies approximately 6% upside from current levels. Whether the broader market participates in that move, or mega-cap tech carries the index alone, will determine how sustainable the gains prove to be.
A contrarian sentiment indicator measures a simple but powerful dynamic: when investor positioning becomes crowded on one side of a trade, fewer marginal buyers remain to push prices higher. The asymmetry tilts toward the downside, not because fundamentals have deteriorated, but because the buying that would ordinarily absorb selling pressure has already occurred.
Goldman’s U.S. Equity Sentiment Indicator differs from purely survey-based measures. The American Association of Individual Investors (AAII) survey, for instance, captures what investors say they feel. Goldman’s composite incorporates what investors are actually doing, through positioning and flow data, alongside survey readings.
CNN Fear and Greed Index: 66.60 As of 1 May 2026, the CNN Fear and Greed Index reads 66.60, placing it in “Greed” territory, consistent with improving but not extreme optimism.
Corroborating data supports the “elevated but not bubble” framing:
The distinction between survey-based and positioning-based measures matters:
Bank of America’s Sell Side Indicator, sitting at 55.6% in April 2026 and just 1.9 percentage points from its historic sell signal threshold, reaches a similar conclusion from a different methodology: implied 12-month returns remain positive, but the asymmetry of the setup tilts toward caution when breadth is this narrow.
The 1.7 reading is best understood as a probabilistic caution signal. It indicates that the odds of below-average returns have increased over the next two to eight weeks. It does not predict a crash, and treating it as one would be a misreading of what the indicator is designed to show.
The structural case for U.S. equities rests on a tangible foundation. Hyperscaler capital expenditure projections for 2026 have risen to $751 billion, according to Goldman Sachs’s Ben Snider, an $80 billion upward revision from the start of earnings season and an 83% increase from 2025 actuals. Goldman attributes approximately 40% of 2026 S&P 500 EPS growth to AI-driven factors.
Hyperscaler capital expenditure of $130 billion in Q1 2026 alone, with Microsoft reporting an annualised AI revenue run rate surpassing $37 billion and AWS posting its fastest quarterly growth in over three years, provides the commercial underpinning that Goldman Sachs uses to justify attributing approximately 40% of 2026 S&P 500 EPS growth to AI-driven factors.
Corporate buyback estimates reinforce the picture. Full-year 2026 buyback projections sit at approximately $1.2 trillion, a signal that management teams are willing to commit capital at current valuations.
Goldman’s own forecasts remain constructive: 12% EPS growth for 2026, 10% for 2027, and a year-end S&P 500 target of 7,600. The firm is not bearish. The sentiment indicator and the medium-term outlook operate on different time horizons, and neither cancels the other.
| Firm | Year-End S&P 500 Target (2026) |
|---|---|
| Bank of America | 7,100 |
| JPMorgan | 7,500 |
| Goldman Sachs | 7,600 |
| Morgan Stanley | 7,800 |
The range of Wall Street targets, from 7,100 to 7,800, reflects broad agreement on continued upside tempered by varying caution on valuation and concentration. The distinction that matters for investors is temporal: the AI capex thesis and EPS growth forecasts support the second half of 2026 and beyond. The sentiment indicator speaks to the next two to eight weeks.
The core tension is now clearly defined. A structurally sound earnings environment with genuine AI-driven growth sits alongside near-term positioning risk that has historically produced below-average returns over a two-to-eight-week window.
Goldman’s near-term risk list reinforces the caution: narrow breadth at dot-com era levels, potential forward P/E multiple compression from the current approximately 20.9x (down from 22x in January 2026 but still near the five-year average), and ongoing geopolitical volatility.
The core tension: Q1 2026 earnings are strong, AI capex is accelerating, and Wall Street year-end targets point higher, but Goldman’s positioning data suggests the market has already priced much of that good news into current levels.
The 1.7 reading argues for calibration, not capitulation. Three considerations, in priority order:
For investors wanting to understand the bull case that runs in the opposite direction, our full explainer on the S&P 500 melt-up scenario examines why BCA Research sees a potential 27% rally toward 9,200, what latent capital conditions would need to align for that outcome, and which specific catalysts — including guidance disappointments and Federal Reserve signals — could abort the move.
Goldman’s sentiment indicator does not signal that the rally is over. It signals that the margin for error has narrowed.
With the year-end target at 7,600 and the S&P 500 near 7,165, approximately 6% of upside remains in Goldman’s base case. Realising that upside depends on continued execution: EPS delivery through the remainder of earnings season, AI capex translating into revenue growth, and no geopolitical shock disrupting the trajectory.
The variables to monitor in the coming weeks are specific. Beat rates and forward guidance revisions will determine whether the earnings picture holds. Breadth expansion, or its absence, will reveal whether the rally can widen beyond mega-cap technology. And positioning data will show whether the 1.7 reading persists or begins to normalise.
The market is not broken. It is priced for a lot to go right, and the window in which anything going wrong would hurt most is the next two to eight weeks.
This article is for informational purposes only and should not be considered financial advice. Investors should conduct their own research and consult with financial professionals before making investment decisions. Past performance does not guarantee future results, and forward-looking statements regarding earnings growth, sentiment readings, and price targets are subject to market conditions and various risk factors.
Goldman Sachs's U.S. Equity Sentiment Indicator is a composite measure that aggregates institutional positioning data, fund flows, and investor survey readings to gauge how crowded the market is. A reading of 1.7, near the 73rd percentile since 2009, has historically been associated with below-average S&P 500 returns over the following two to eight weeks.
Strong earnings can already be priced into stocks before the results are published, meaning there are few new buyers left to push prices higher after the reports arrive. Goldman Sachs noted that the reward for beating expectations in Q1 2026 has been atypically modest, suggesting the good news was embedded in share prices before earnings season began.
The top ten S&P 500 stocks now account for a record 42% of index weight, meaning the headline index level can appear healthy while the median stock lags significantly. Goldman Sachs has flagged that market breadth has narrowed to levels not seen since the dot-com era, and when positioning clusters around a small number of names, any sentiment unwind tends to be faster and sharper.
Goldman Sachs frames the 1.7 reading as a signal for calibration rather than an exit call. Investors are advised to review concentration in mega-cap technology names, assess whether entry prices already reflect strong Q1 results, and weigh the two-to-eight-week caution window against their own holding period before adjusting positions.
No. Goldman Sachs maintains a year-end S&P 500 target of 7,600, implying roughly 6% upside from late April 2026 levels, alongside forecasts of 12% EPS growth for 2026. The sentiment indicator addresses near-term positioning risk over two to eight weeks, while the firm's medium-term outlook remains constructive.