Brent crude has climbed 13% in three weeks. The national average for U.S. gasoline sits at $4.25 per gallon. The Strait of Hormuz remains effectively blocked as of 29 April 2026, and the S&P 500 is trading within reach of its all-time high.
The mid-April equity rebound was built on one catalyst: the 8 April ceasefire announcement and the expectation that energy costs would ease. That catalyst has since come apart. The Strait remains closed, oil has retraced most of its post-ceasefire decline, and Goldman Sachs has assigned a 25% probability to a 2026 recession. The market, however, has not fully repriced.
What follows is the specific data, historical patterns, and analyst projections that form a coherent case for why the current equity rally may be ahead of the underlying reality, and what that means for U.S. investors watching the situation develop.
The ceasefire that didn’t clear the way
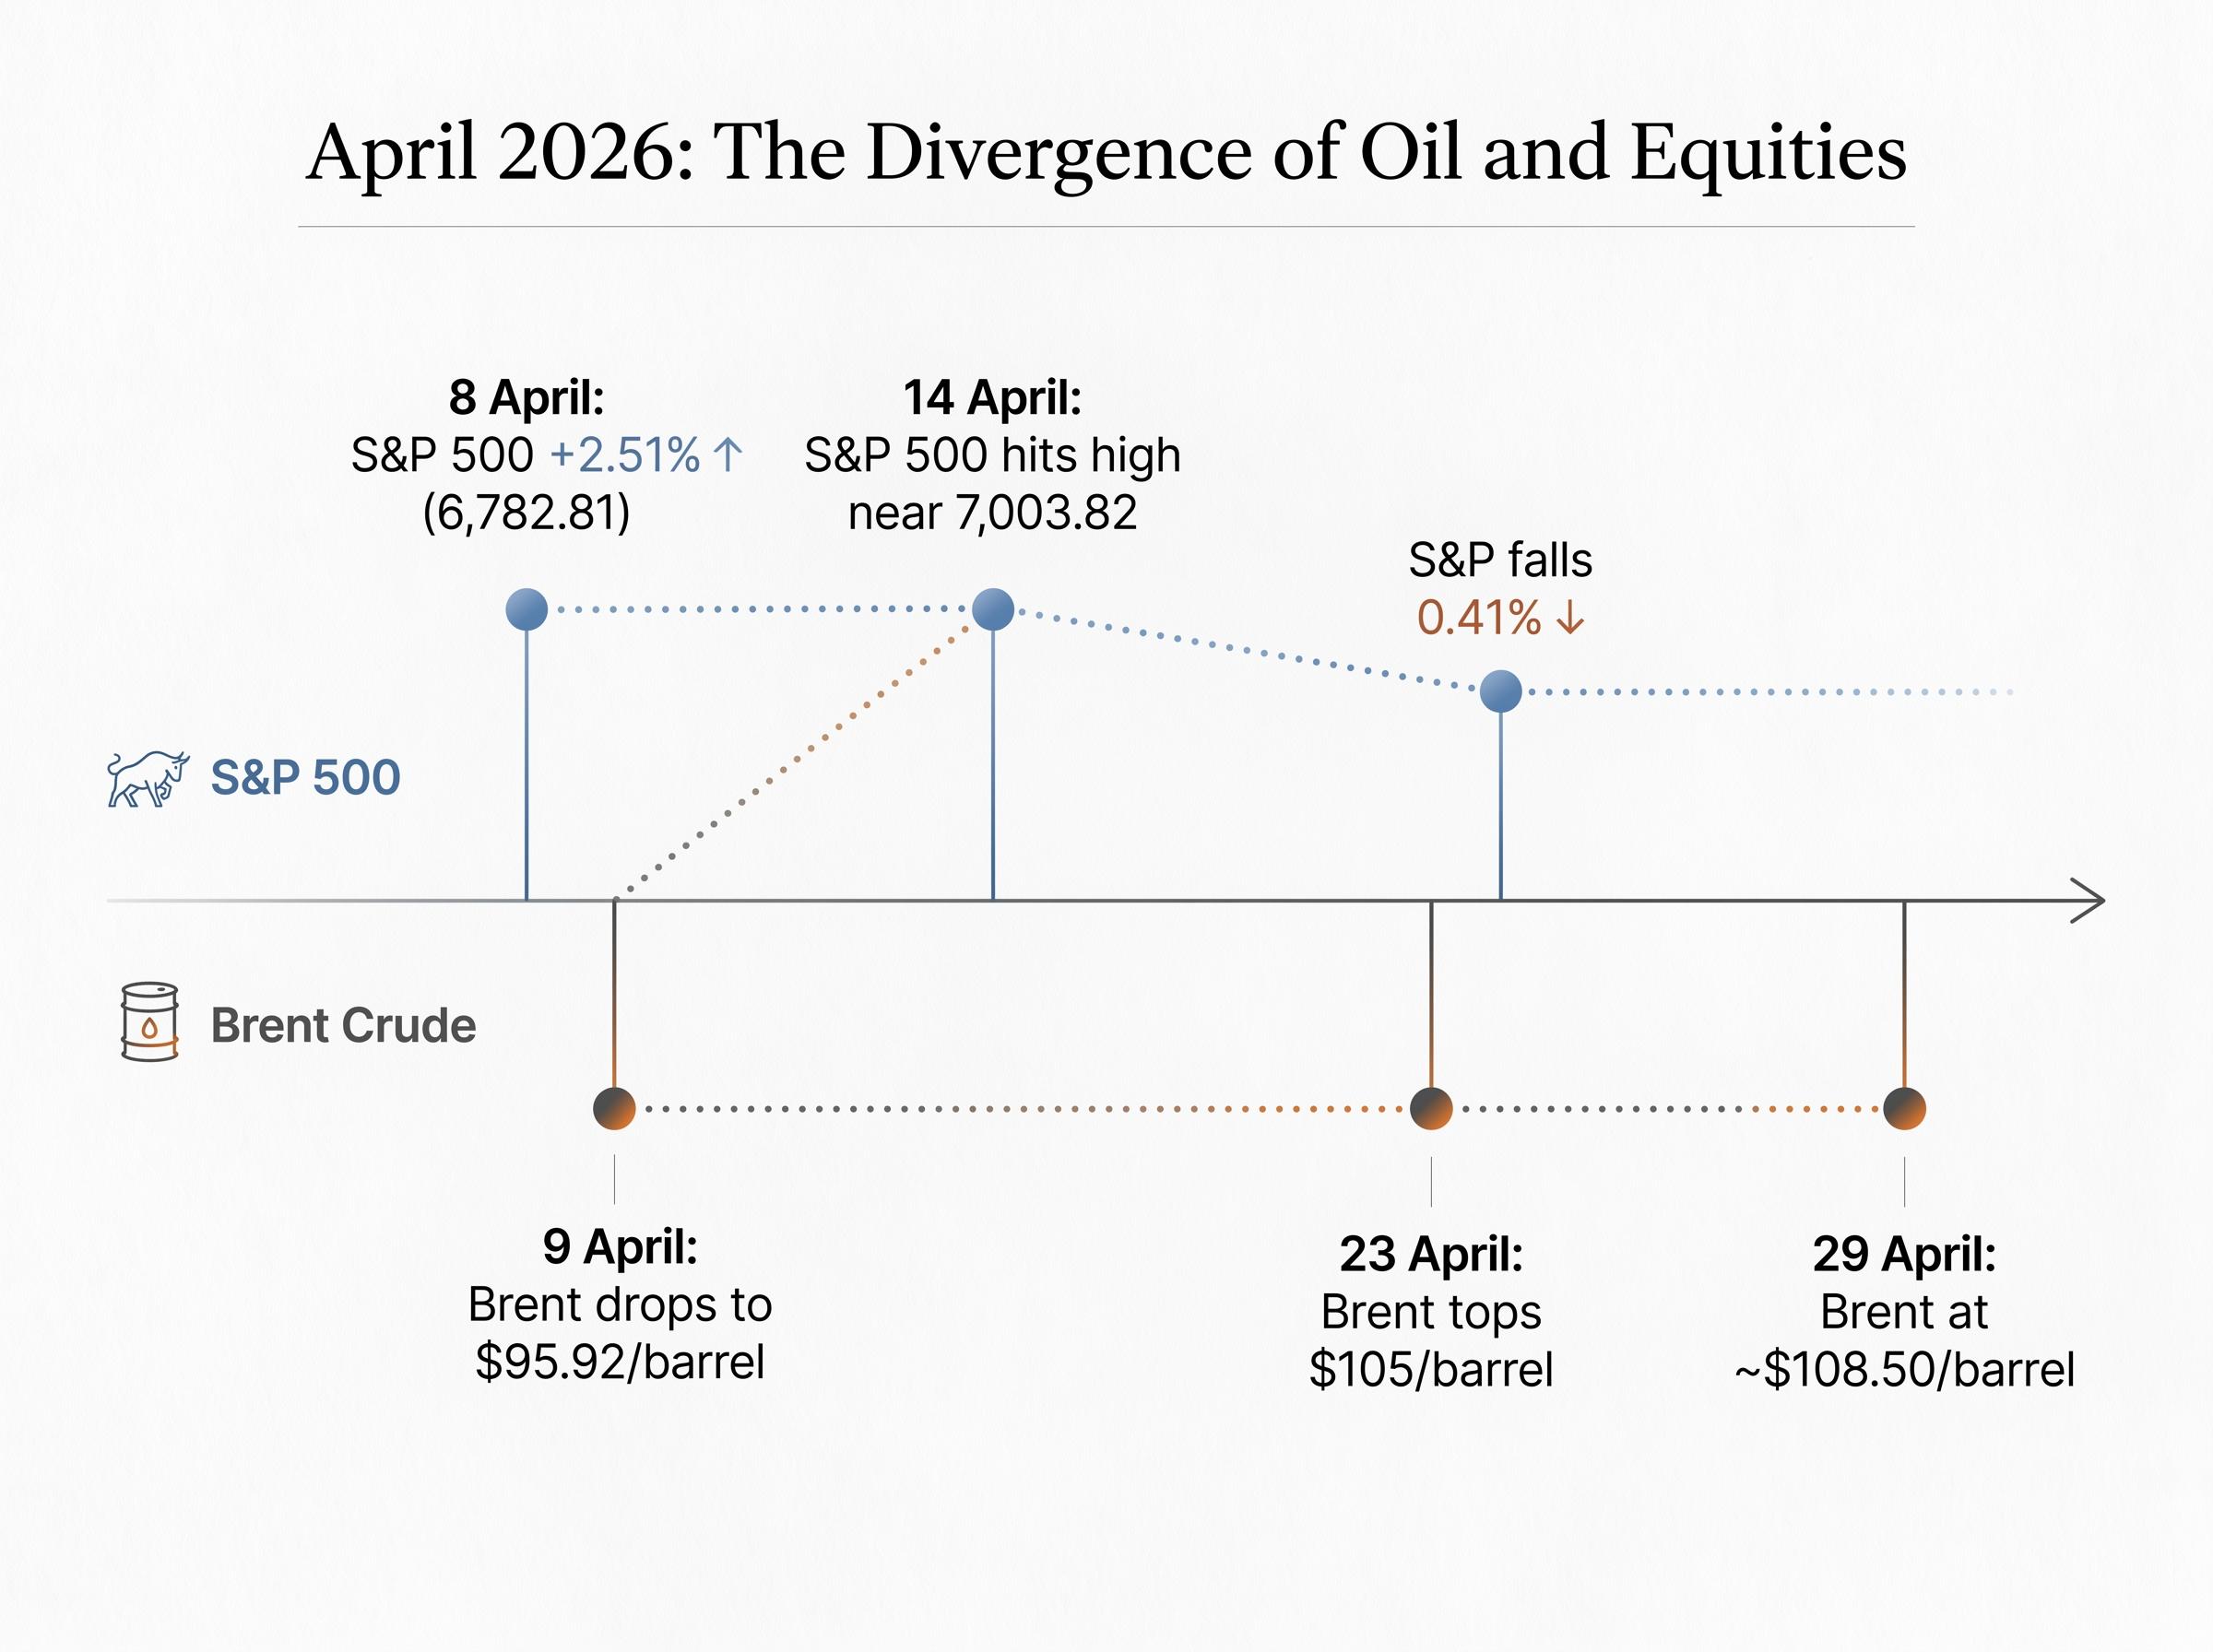
On 8 April 2026, the S&P 500 surged 2.51% to close at 6,782.81. The catalyst was a conditional two-week ceasefire that included a temporary reopening of the Strait of Hormuz. By 14 April, the index had climbed to an intraday high near 7,003.82, briefly surpassing its 27 January all-time high.
The rally was driven by one assumption: energy costs were about to ease. Three weeks later, that assumption looks increasingly unfounded.
The timeline tells the story:
- 8 April: Conditional ceasefire agreed; S&P 500 jumps 2.51%
- 14 April: S&P 500 reaches intraday high near 7,003.82
- 23 April: Renewed Hormuz standoff pushes oil back above $105/barrel; S&P 500 falls 0.41%
- 27 April: Reuters reports Iran’s conditional proposal for Strait reopening, contingent on the U.S. ending the war and lifting the blockade
What Iran’s reopening conditions actually mean
Iran’s offer, reported by Reuters on 27 April, requires two conditions: the end of hostilities and the lifting of the U.S. blockade. Neither condition has been met as of 29 April. The U.S. has not accepted the proposal.
This is a diplomatic impasse, not a near-term resolution. Investors who bought the ceasefire news are holding positions priced for an outcome that remains, at best, speculative.
When big ASX news breaks, our subscribers know first
How oil prices tell a different story than the stock chart
The Brent crude price arc since late February traces a pattern the equity market has largely ignored. When Operation Epic Fury launched on 28 February 2026, Brent briefly surged to $119.50/barrel. The ceasefire on 8 April brought sharp relief, with Brent settling at $95.92/barrel the following day. That relief did not last.
By 23 April, Brent had climbed back above $105/barrel as the Strait standoff resumed. As of 29 April, it sits at approximately $108.50/barrel, with WTI at approximately $104.20/barrel.
| Date | Brent Crude ($/barrel) | Event |
|---|---|---|
| Early March 2026 | $119.50 | Operation Epic Fury launches |
| 9 April 2026 | $95.92 | Post-ceasefire low |
| 23 April 2026 | $105+ | Renewed Hormuz standoff |
| 29 April 2026 | ~$108.50 | Strait remains blocked |
That $108.50 figure carries specific significance. Goldman Sachs warned in its 20 April report that if oil exceeds $110/barrel, the S&P 500 faces a projected 5-10% decline. Brent is approximately $1.50 below that threshold.
The gap between where oil is trading and where equities are priced suggests the stock market has not absorbed what the oil market is signalling.
Why $4 gasoline has historically preceded market declines
The U.S. Energy Information Administration (EIA) reported a national average gasoline price of $4.25 per gallon for the week ending 27 April 2026. That figure represents a rise of approximately 45% since 1 January 2026. The last time gasoline was at this level was August 2022.
The EIA weekly gasoline price data covering the period from 1993 forward shows that national average prices have exceeded $4 per gallon in fewer than 3% of all weeks, placing the current $4.25 reading in a historically rare and historically negative category for subsequent equity returns.
The transmission mechanism from pump prices to equity performance operates through three channels:
- Direct consumer cost: Elevated fuel prices reduce household discretionary spending immediately, pulling money from retail, dining, and services
- Indirect cost pass-through: Businesses absorb higher transportation and logistics costs, then pass them on through price increases that further compress consumer purchasing power
- Consumer spending drag on GDP: Consumer spending accounts for roughly two-thirds of U.S. economic output; when it contracts, earnings follow
The historical record is stark. Since 1993, only 44 weeks have seen national gasoline prices exceed $4 per gallon, representing under 3% of all weeks in that span.
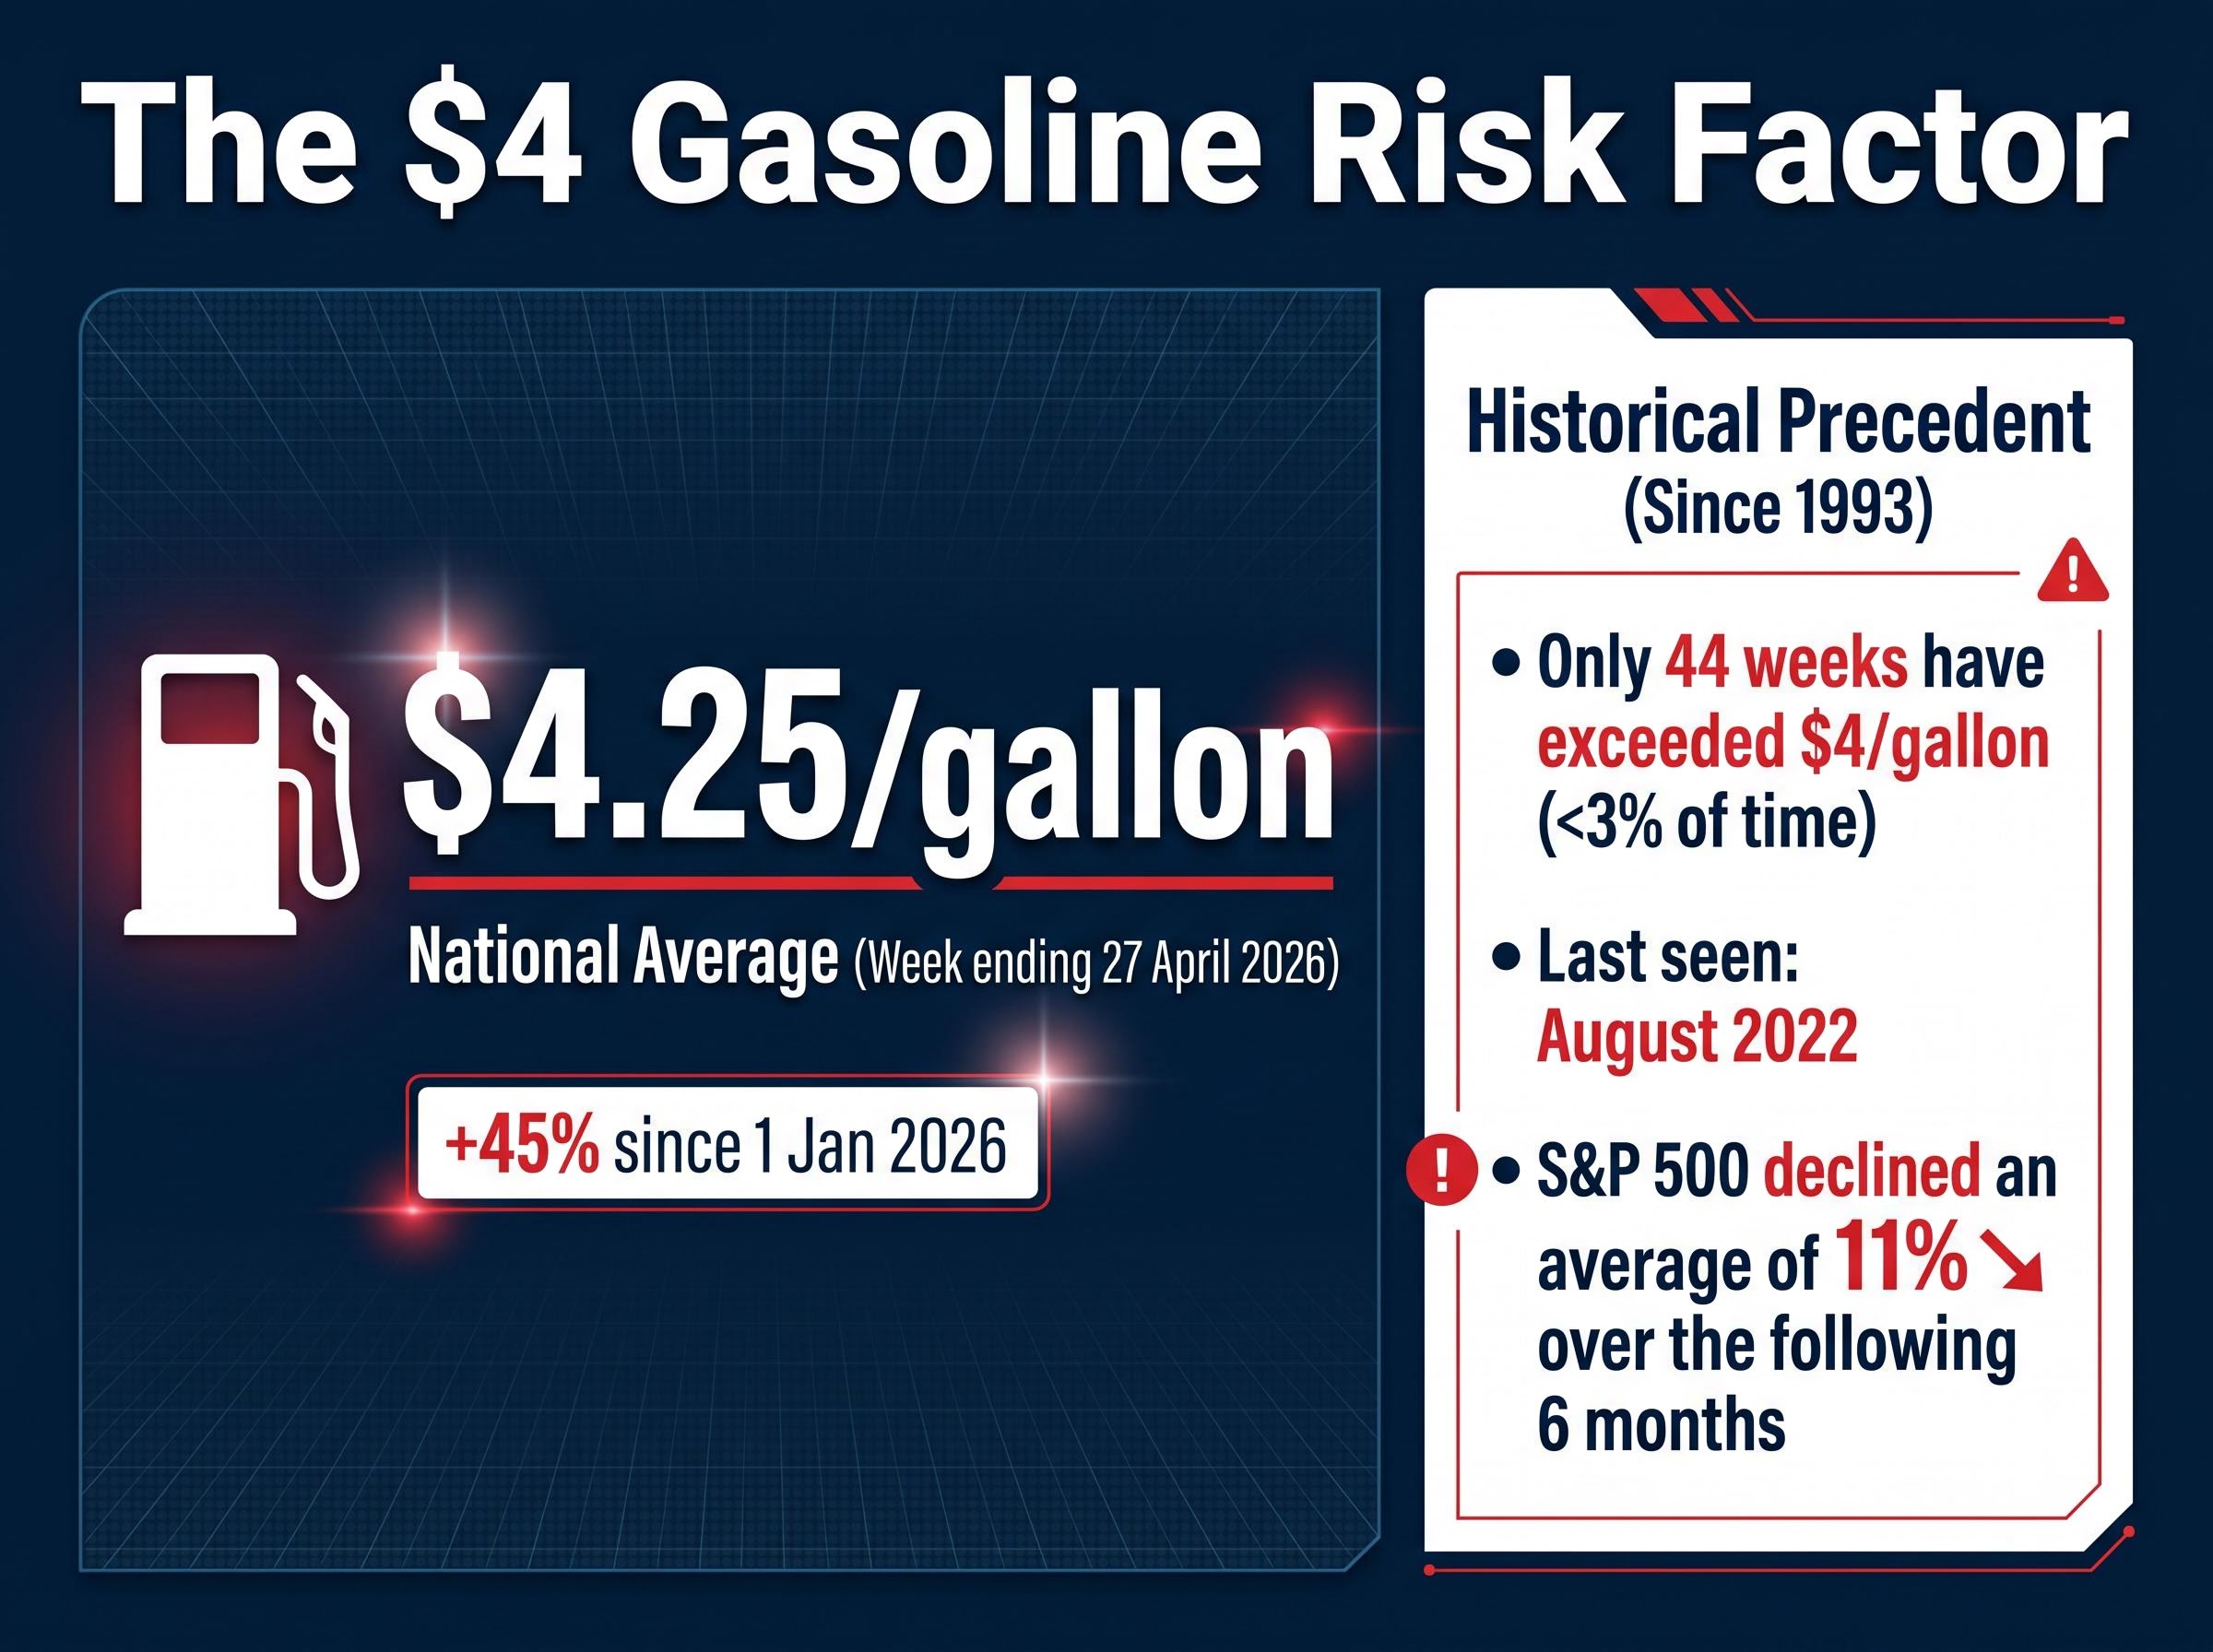
In the 44 weeks since 1993 when gasoline exceeded $4/gallon, the S&P 500 declined an average of 11% over the following six months.
The current gasoline price is not an isolated data point. It sits within a historically narrow, historically negative category for equity returns.
High gasoline price equity outcomes diverge sharply depending on how long elevated pump prices persist: the 11% average S&P 500 decline across all post-$4 episodes extends toward a 41% worst-case when the supply disruption sustains long enough to become self-reinforcing through consumer and corporate damage.
This article is for informational purposes only and should not be considered financial advice. Investors should conduct their own research and consult with financial professionals before making investment decisions.
What analysts are saying about where oil and recession risk go next
The range of institutional projections runs from manageable to severe, and the distance between the two scenarios is wide enough to matter.
Morgan Stanley’s Martijn Rats outlined a two-track framework: a best-case 2026 average of $80-$90/barrel if the conflict de-escalates, versus a sustained Strait closure scenario projecting $150-$180/barrel. The structural supply argument underpins the bearish end of that range. Damaged infrastructure and storage constraints mean that even a conflict resolution would not restore prior output levels quickly.
Goldman Sachs’s 20 April report placed recession probability at 25% for 2026 and identified the $110/barrel Brent threshold as the point at which the S&P 500 faces 5-10% downside. Oil started 2026 at approximately $65/barrel, meaning current levels represent a gain of over 50% year-to-date.
| Institution | Projection Type | Base Case | Adverse Scenario |
|---|---|---|---|
| Goldman Sachs | Recession probability / S&P 500 risk | 25% recession probability | 5-10% S&P 500 decline if oil exceeds $110/barrel |
| Morgan Stanley | Oil price forecast | $80-$90/barrel (2026 average) | $150-$180/barrel (sustained Strait closure) |
| Moody’s | Economic damage assessment | Recession risk already considerable | Lasting damage even under swift de-escalation |
Mark Zandi of Moody’s assessed that recession risk is already considerable and that even a swift de-escalation would leave lasting economic damage.
The oil price surge recession transmission operates through four simultaneous channels: reduced consumer disposable income, rising business input costs, Federal Reserve rate pressure as inflation re-accelerates, and a pullback in corporate investment and hiring that compounds the demand destruction before any single channel becomes decisive.
According to Zandi, even a rapid resolution of the conflict would not prevent meaningful economic damage, with joblessness expected to rise further and GDP recovery unlikely for the remainder of 2026.
These are not fringe bearish voices. The convergence of a 25% recession probability, a proximate downside trigger, and a tail-risk scenario reaching $150-$180/barrel represents a meaningful alignment of institutional caution.
Past performance does not guarantee future results. Financial projections are subject to market conditions and various risk factors.
The bear case the equity rally is ignoring
The S&P 500’s April recovery was built on three assumptions. Each has been partially or fully undermined since:
- Ceasefire holding: The Strait remains blocked as of 29 April; Iran’s reopening conditions have not been met
- Energy costs easing: Brent has risen from $95.92 to $108.50 since 9 April, a 13% rebound in three weeks
- Earnings momentum sustaining valuations: While S&P 500 EPS growth of approximately 13.2% year-over-year is genuine, forward earnings estimates have not yet absorbed a potential sustained oil shock
The recession arithmetic compounds the picture. Since the S&P 500’s inception in 1957, the index has declined an average of approximately 32% during recessions. Goldman Sachs’s 25% probability estimate makes this historical average more than an academic figure.
Historical S&P 500 drawdowns during recessions have averaged roughly 30% across the past eleven economic contractions, a figure that contextualises the Goldman Sachs 25% recession probability as a live quantitative risk rather than a distant tail event.
The 23 April S&P 500 decline of 0.41% on the Hormuz standoff news confirmed that the market remains sensitive to escalation. A single headline moved the index. A sustained deterioration in the Strait situation could move it considerably further.
The case for staying invested, and its limits
The bull case carries genuine weight. S&P 500 EPS growth of 13.2% year-over-year is real fundamental support. Fidelity’s April 2026 outlook noted the drawdown remained below 10%, and State Street observed on 6 April that markets have historically recovered from geopolitical shocks.
These observations are accurate. They are also backward-looking. Historical recovery data does not account for the specific combination of a proximate Goldman Sachs downside trigger $1.50 away, a 25% recession probability from the same institution, and a shipping chokepoint handling roughly 20% of global oil supply remaining shut with no confirmed reopening timeline.
The trap springs only if the Strait stays shut, and that depends on diplomacy, not data
Every data point in this analysis traces back to a single unresolved variable: the status of the Strait of Hormuz. Oil prices, inflation trajectory, recession probability, and equity performance all flow downstream from whether, and when, that waterway reopens.
As of 29 April, according to Reuters, the Strait remains effectively blocked. Iran’s 27 April proposal ties reopening to conditions the U.S. has not accepted. There is no confirmed reopening timeline.
“Brent crude is approximately $1.50 below the threshold Goldman Sachs identifies as triggering a 5-10% S&P 500 decline.”
For U.S. investors, three signals warrant close monitoring:
- Brent crude crossing $110/barrel: the Goldman Sachs threshold for projected 5-10% S&P 500 downside
- Strait of Hormuz reopening confirmation: the single most consequential de-escalation signal for the entire risk chain
- EIA weekly gasoline data: sustained readings above $4/gallon would indicate a deteriorating consumer spending backdrop with historical precedent for equity declines
The answer to whether the current equity rally holds cannot be found in any earnings report or price chart. It sits in a diplomatic negotiation between two governments, and the market has priced in a resolution that has not arrived.
The data does not support the all-clear
The S&P 500’s April recovery was built on a ceasefire that has not resolved the Strait of Hormuz closure. Oil has retraced most of its post-ceasefire decline, gasoline prices sit at levels historically associated with double-digit equity declines, and three major institutions have issued forecasts that range from cautious to alarming. The compound signal is coherent.
The counterweight is real. EPS growth of 13.2% is not manufactured, institutional confidence has not fully collapsed, and geopolitical shocks do not always produce sustained equity declines. The argument here is not certainty; it is mispriced risk.
The indicators that will resolve the uncertainty are specific and observable: Strait reopening news, the Brent $110 threshold, and EIA weekly gasoline data. These are the clearest real-time signals to watch as this situation develops.
These statements are speculative and subject to change based on market developments and company performance.
For ongoing analysis of energy market dynamics and U.S. recession indicators as this situation evolves, explore related coverage and subscribe for updates.