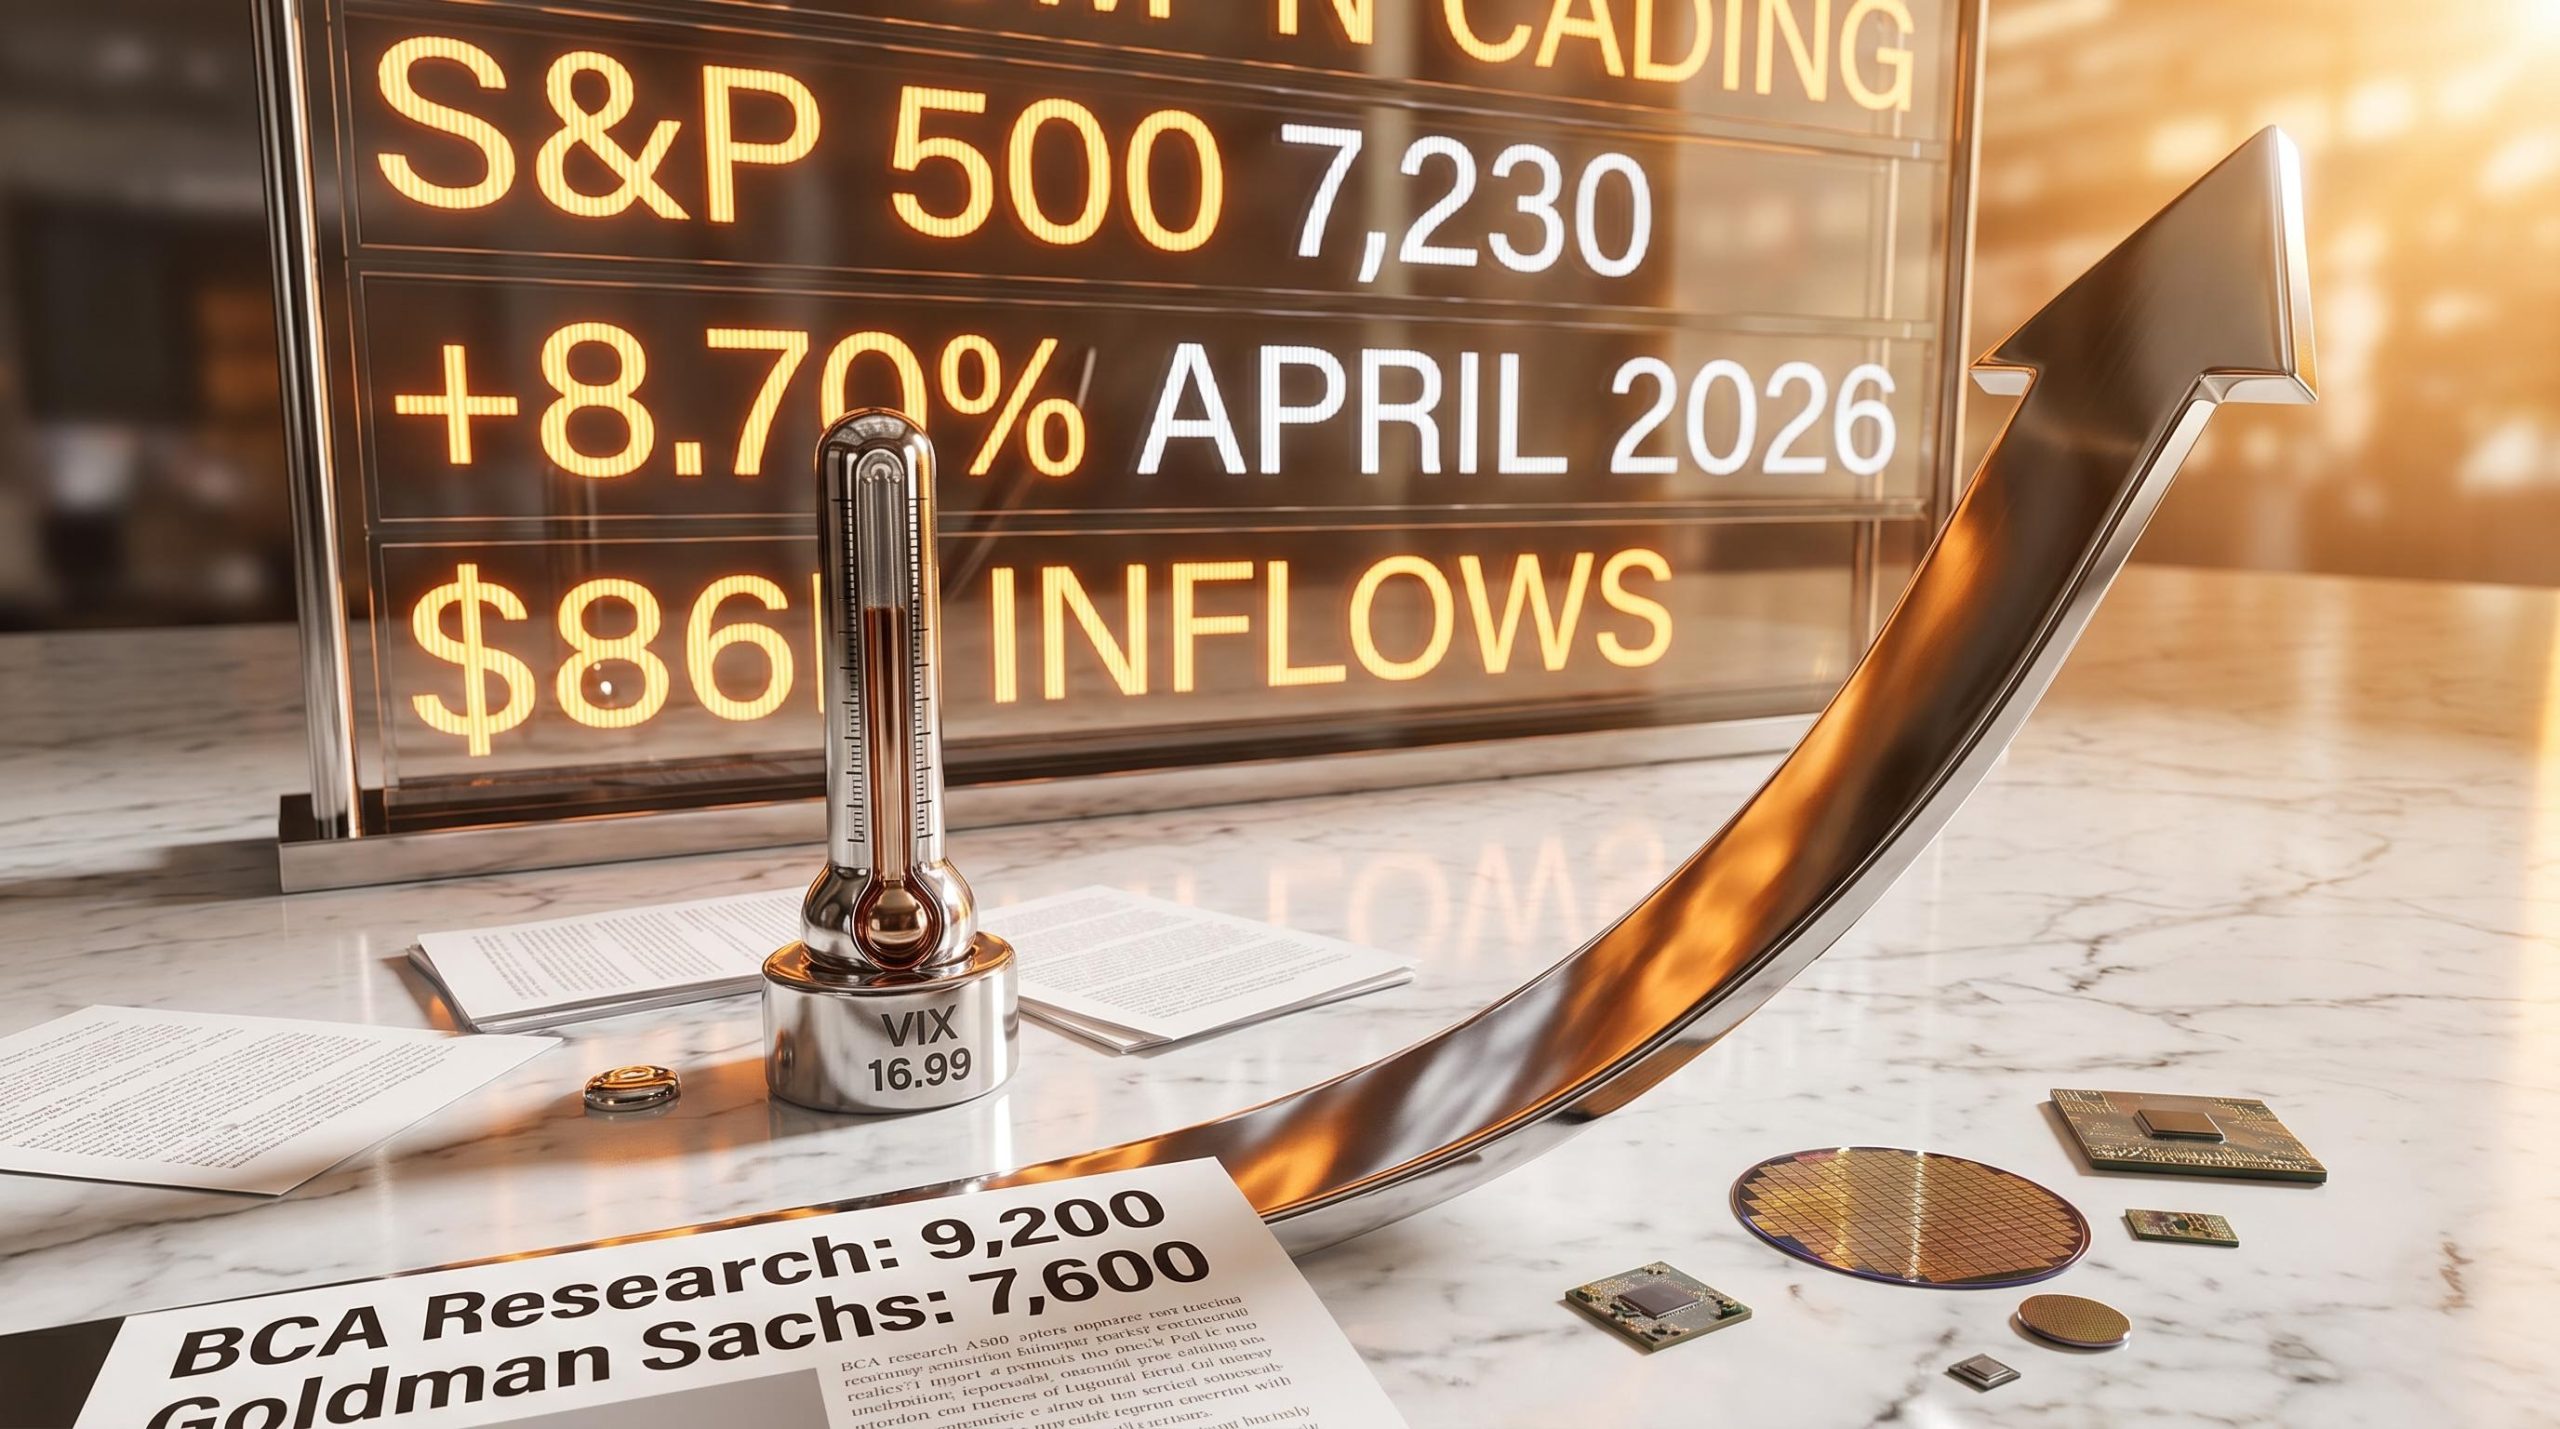
The S&P 500 gained 8.70% in April 2026 alone, its strongest single-month performance in years, while $86 billion flooded into global equities and retail traders piled back into leveraged semiconductor ETFs. That is not a quiet bull market. That is a market showing signs of overheating.
With the VIX sitting at 16.99, the S&P 500 at 7,230, and put/call ratios falling steadily, the conditions that historically precede a stock market melt-up are visible in the data now. The debate among investors is no longer whether the AI rally is real. It is whether the current momentum can sustain itself, or whether it is building toward a sharp, disorderly acceleration that eventually corrects hard.
What follows maps the specific mechanics behind the April rally, explains what a melt-up means for positioning decisions, and identifies the data points investors should watch to distinguish a durable trend from a fear-of-missing-out-driven overshoot.
How the AI trade became the engine of an $86 billion surge
The chain reaction started on 16 April 2026, when TSMC raised its AI demand outlook, catalysing a synchronised rally across Nvidia, Microsoft, Tesla, and Intel. That same day, the S&P 500 closed above 7,000 for the first time, finishing at 7,041.28.
What followed was not a single catalyst but a self-reinforcing loop:
- TSMC’s revised AI demand outlook on 16 April triggered a broad semiconductor rally, pushing the S&P 500 above 7,000
- Magnificent Seven earnings beats through late April validated the AI spending thesis, drawing institutional capital
- Retail inflows into leveraged ETFs (SOXL, QQQ) amplified upward momentum as traders chased semiconductor exposure
- The S&P 500 reached a record close of 7,165.08 on 24 April, locking in the 8.70% monthly gain
The April gain of 8.70% in a single month placed the S&P 500’s year-over-year return at 29.68%, a pace that has historically preceded either sustained acceleration or sharp reversal.
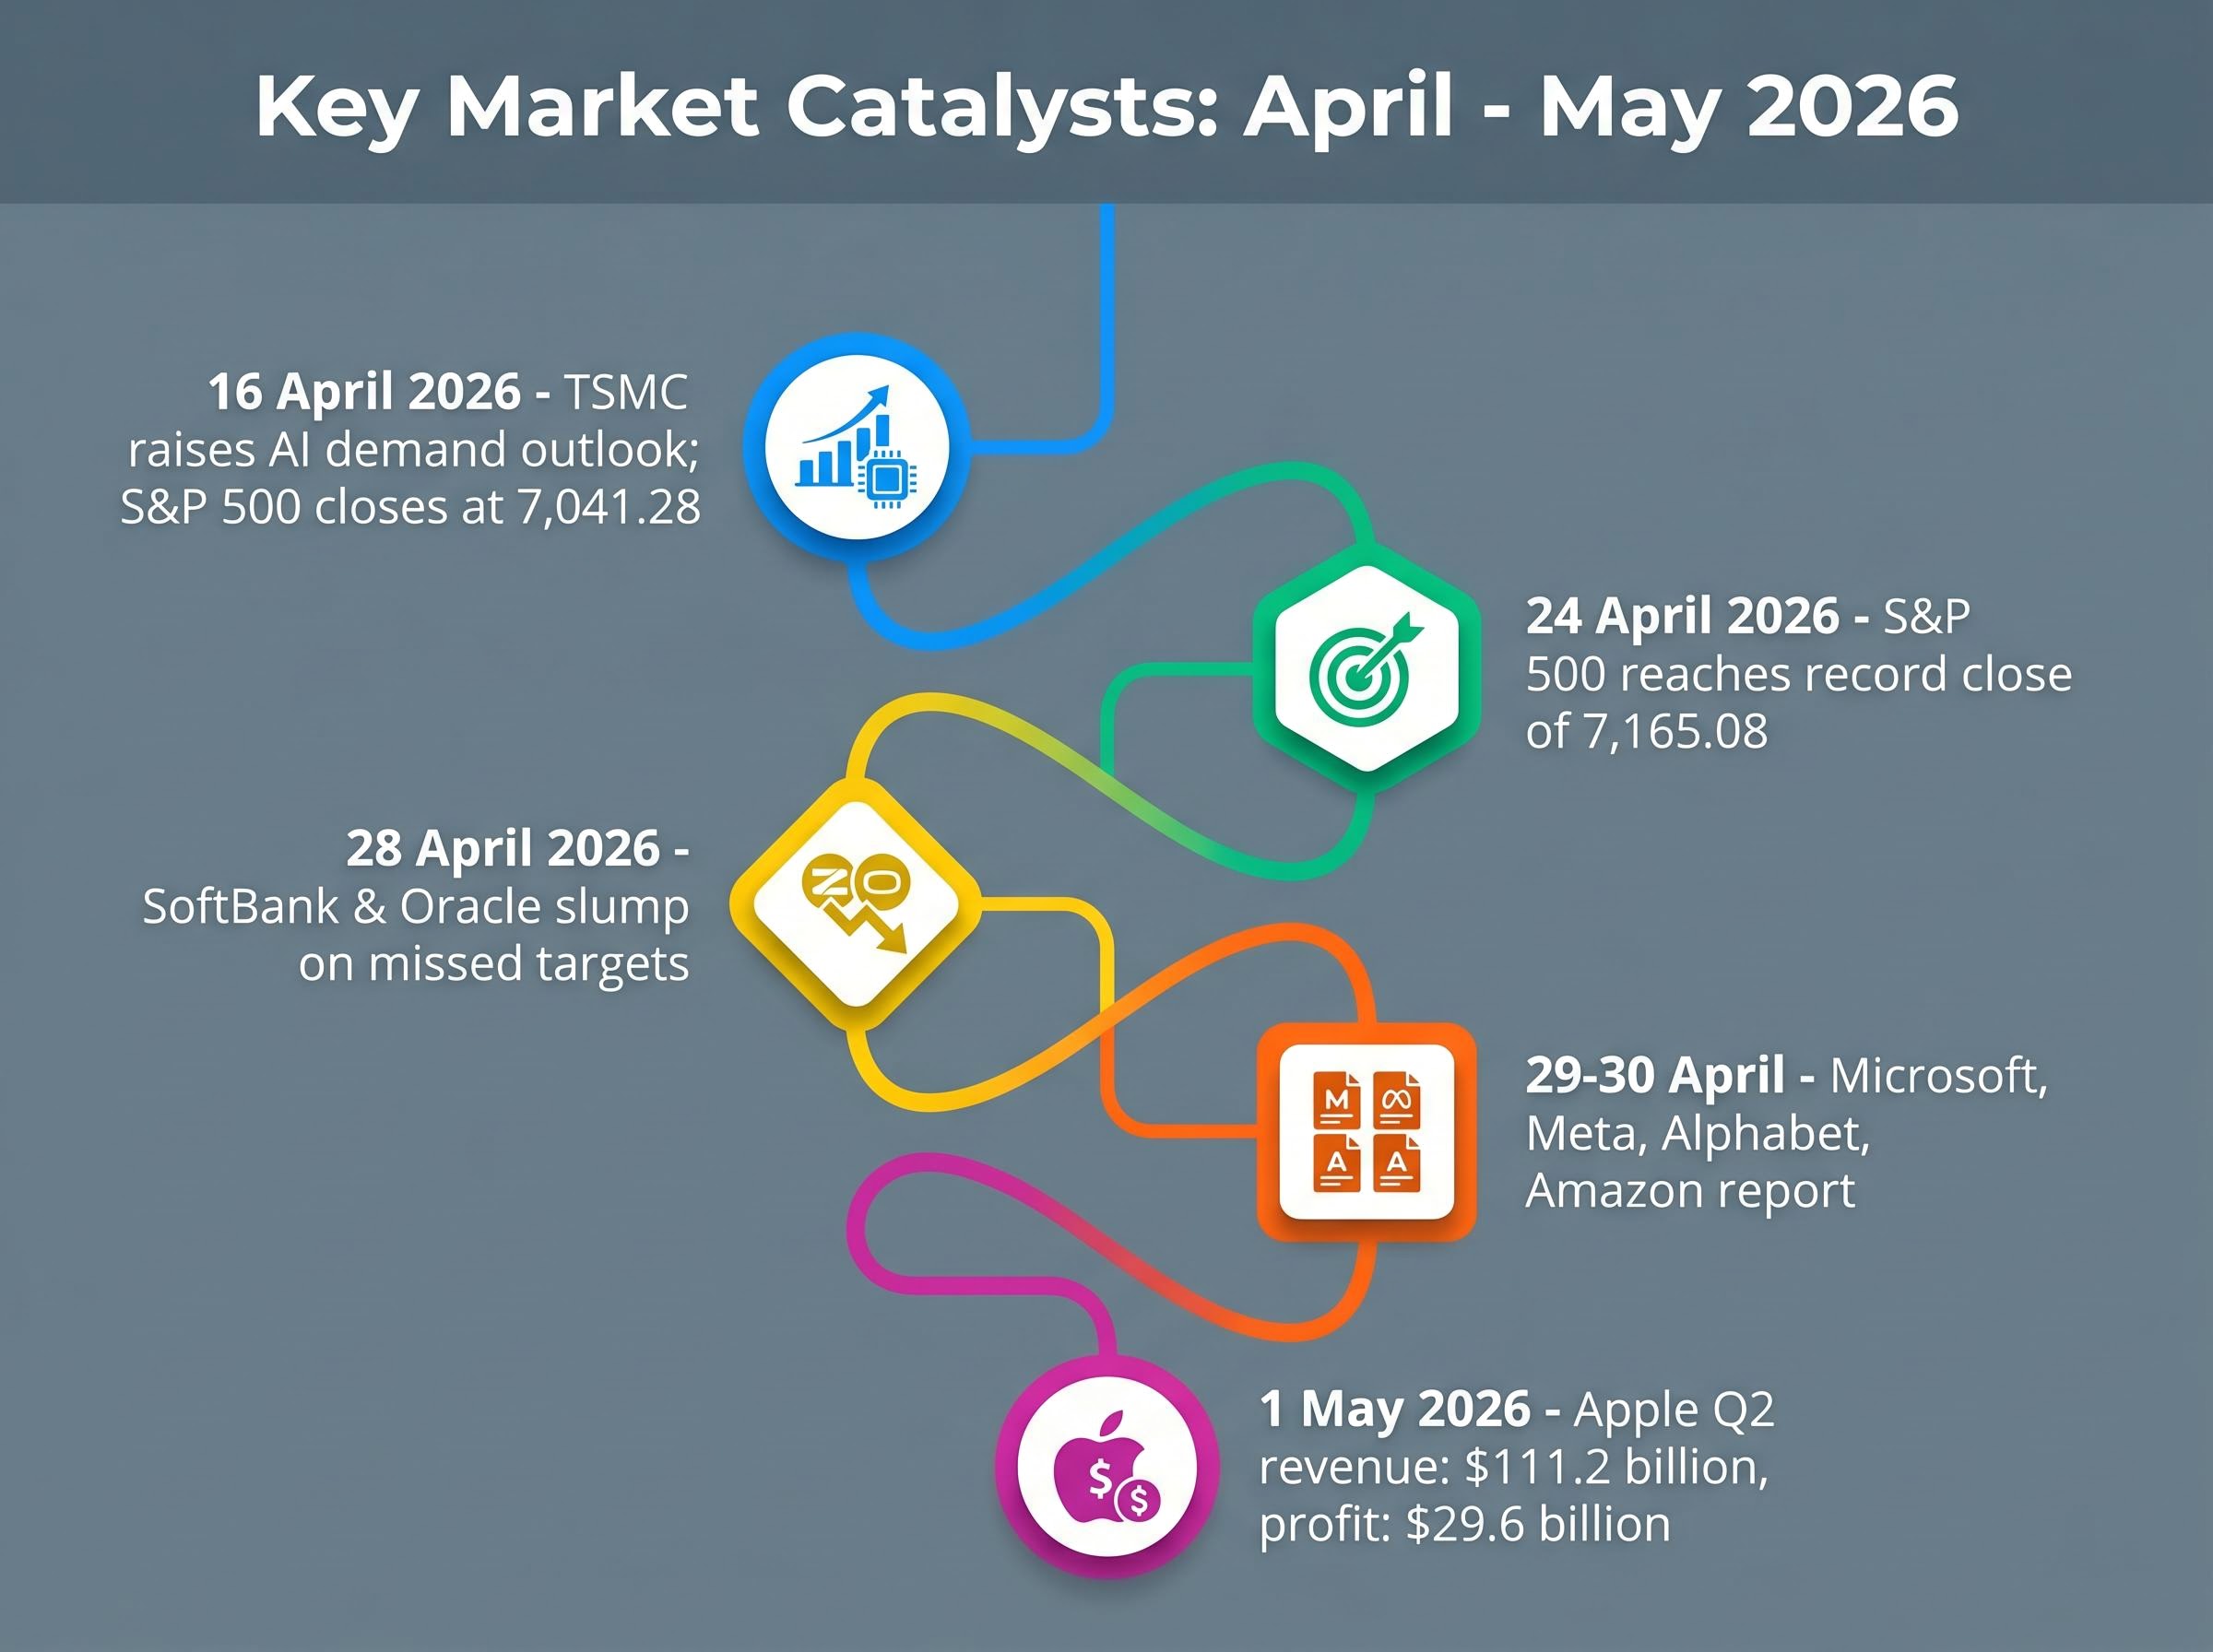
The $86 billion in total April inflows was predominantly institutional, but it was the feedback between institutional deployment, retail re-entry, and ETF inflows that gave the move its compounding character. Alphabet’s planned AI capital expenditure of $175-$185 billion signalled that the structural spending underpinning the trade is not slowing.
SMH, the VanEck Semiconductor ETF, rose over 50% year-to-date; SOXL and QQQ saw strong inflows tied directly to earnings beats. The sequencing matters: remove TSMC’s catalyst or the earnings validation that followed, and the reflexive momentum that carried the index to record highs would not have materialised in the same way.
When big ASX news breaks, our subscribers know first
What a melt-up actually means, and why the term matters now
A melt-up is a rapid, sentiment-driven price acceleration that decouples from fundamental valuation. It typically occurs in the final phase of a bull cycle, when fear of missing out overwhelms disciplined positioning, before a sharp reversal resets prices.
This is not the same as a healthy bull market. A sustained rally built on earnings growth and economic expansion can persist for years. A melt-up compresses months or years of potential gains into weeks, creating a price structure that depends on continued momentum rather than underlying value. The distinction matters because a melt-up does not guarantee a crash, but it substantially raises the probability of a severe correction when the acceleration ends.
BCA Research has drawn this distinction explicitly, warning that an AI-fuelled rally could produce a 30% surge analogous to the 1999 dot-com era, with the S&P 500 potentially exceeding 9,200. From the current level of 7,230, that implies approximately 27% additional upside. Goldman Sachs, by contrast, forecasts a year-end 2026 target of 7,600, roughly 6% from current levels.
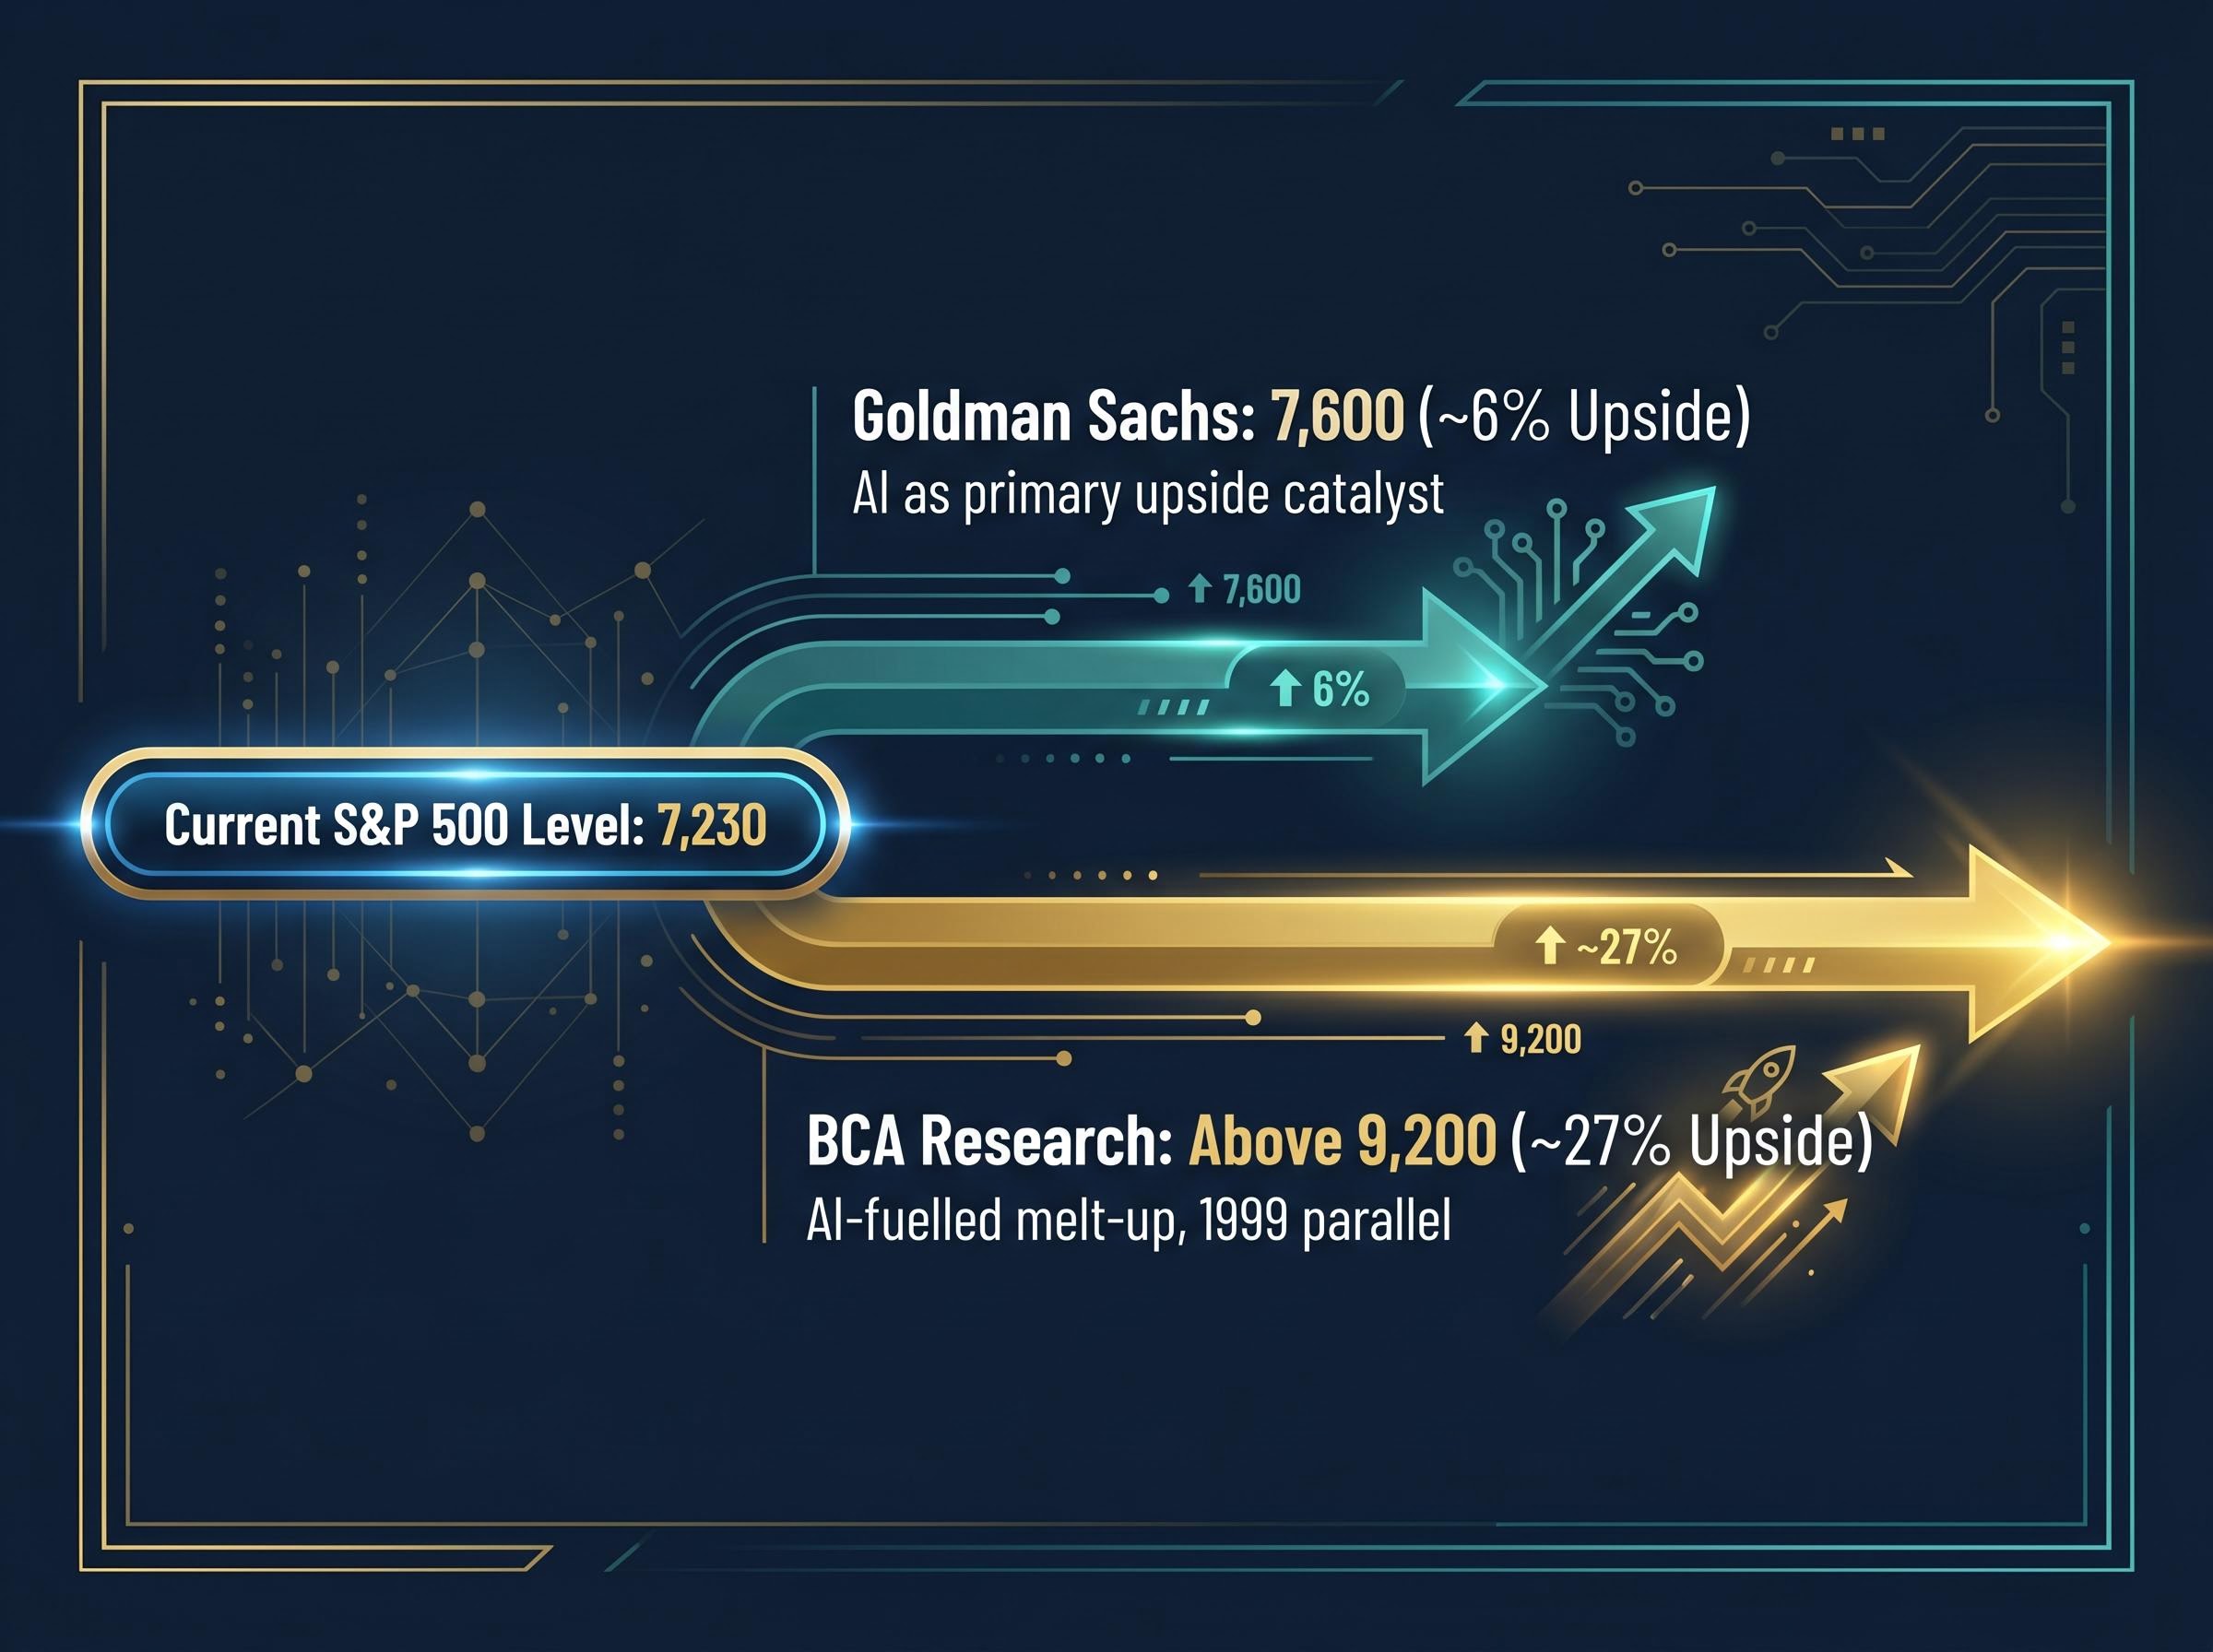
| Analyst / Firm | S&P 500 Target | Implied Upside from 7,230 | Key Driver |
|---|---|---|---|
| BCA Research | Above 9,200 | ~27% | AI-fuelled melt-up, 1999 parallel |
| Goldman Sachs | 7,600 | ~6% | AI as primary upside catalyst |
The 1999 parallel: similarities and where the analogy breaks
The 1999 dot-com melt-up was defined by retail mania, PE multiple expansion, and extreme tech concentration. Each of those characteristics is visible today: retail inflows into leveraged semiconductor ETFs are surging, the Magnificent Seven dominate index-level returns, and valuations have stretched well above historical averages.
The difference is in the substance of the spending. In 1999, much of the capital deployed into technology companies funded speculative ventures with no revenue pathway. In 2026, AI capital expenditure from hyperscalers like Alphabet represents real infrastructure investment, with measurable demand from enterprise customers. That distinction does not eliminate melt-up risk, but it suggests the floor beneath current prices may be higher than the floor beneath 1999’s peak.
AI stock valuations have stretched into territory where the thesis depends on earnings acceleration being confirmed this season, not just implied by capex plans: Nvidia’s trailing P/E of approximately 40-41 prices in a compounding growth trajectory that leaves little margin for execution shortfalls across the Magnificent Seven.
The capital flow map: where money moved and what it signals
The $86 billion April inflow into global equities was not evenly distributed. U.S. equities absorbed the vast majority, while other regions experienced outflows or marginal gains that underscore just how concentrated the current rally has become.
Europe recorded its worst fund redemptions in approximately two years. Sluggish growth and elevated energy costs, with Brent crude trading at $102-$105 per barrel around 28 April 2026, created a structural deterrent for capital that had alternatives in dollar-denominated assets.
The U.S. dollar reached its strongest level since late 2022, driven in part by semiconductor equity demand. That strength simultaneously attracts global capital into U.S. markets and complicates the emerging market picture.
| Region | Flow Direction | Key Driver | Risk Flag |
|---|---|---|---|
| United States | Strong inflows | AI/semiconductor earnings, institutional deployment | Geographic concentration of global capital |
| Europe | Net redemptions (worst in ~2 years) | Sluggish growth, elevated energy costs | Structural underperformance versus dollar assets |
| China / India | Net selling | Domestic economic pressures | Capital flight to dollar assets |
| South Korea / Taiwan | Moderate gains | Semiconductor supply chain positioning | Dependent on continued AI capex cycle |
Global capital is actively rotating into dollar assets and away from alternatives. For U.S. investors, this amplifies returns but also concentrates systemic risk in a single geography and a single sector theme.
The technical signals that worry experienced investors
The put/call ratio decline is the most structurally significant signal in the current environment. When protection buying drops, it reflects a market where portfolio managers are compelled to add equity exposure to match benchmark performance, creating self-reinforcing upward pressure. Managers who underweight the S&P 500 in a month that delivers 8.70% face career risk, and that career risk translates directly into buying pressure.
Declining cross-asset correlations reinforce the picture. The market has shifted from macro-driven (where interest rate expectations move everything in unison) to earnings-driven (where individual company results determine price direction). This transition makes stock selection matter more but also makes broad portfolio hedges less effective, precisely when the rally’s concentration makes hedging most desirable.
The market breadth divergence beneath April’s headline gain is structurally significant: only 23% of S&P 500 constituents outperformed the benchmark they compose, producing the fourth-narrowest breadth reading in nearly four decades and a 5-percentage-point gap between the cap-weighted and equal-weighted index.
The five signals forming a coherent pattern:
- VIX at 16.99 as of 3 May 2026, well below stress thresholds
- Put/call ratios falling, signalling increasing bullish positioning and reduced demand for downside protection
- Volatility declining across nearly all asset classes except crude oil
- Equity correlations meaningfully lower, shifting the market to stock-specific price action
- Hedge fund equity exposure below all-time peaks, implying latent capital available for further deployment
“Exposure remains below all-time peaks, leaving capital available that could extend the rally if performance pressure intensifies.”
These signals are not predictions. They are pressure gauges. A falling put/call ratio combined with underweight hedge fund positioning and a low VIX describes a market where upside momentum becomes self-perpetuating, until an external shock resets the entire complex simultaneously.
The risks that could stall or end the momentum
Near-term earnings risks:
- The Magnificent Seven’s combined Q1 earnings growth of approximately 19% has set a high bar. Microsoft, Meta, Alphabet, and Amazon reported between 29-30 April; Apple delivered record fiscal Q2 revenue of $111.2 billion and profit of $29.6 billion on 1 May 2026. Any guidance disappointment on AI monetisation would directly challenge the rally’s foundation.
- OpenAI-linked stocks including SoftBank and Oracle slumped on 28 April 2026 after reports of missed sales and user targets, a real-time signal that AI monetisation timelines face scrutiny even as infrastructure spending expands.
Macro and structural risks:
- April 2026 CPI nowcast at approximately 3.56%, with short-term inflation expectations rising partly due to elevated fuel prices
- Brent crude at $102-$105 per barrel, with upside pressure from potential Hormuz Strait disruption
- The Federal Reserve holding rates through 2026 amid persistent inflation, removing monetary easing as a potential tailwind
The Federal Reserve’s April 2026 FOMC statement confirmed the decision to hold the federal funds rate at 3.5 to 3.75 percent, citing elevated inflation driven by global energy prices, removing monetary easing as a potential tailwind for equity markets through the remainder of 2026.
What an AI monetisation miss would mean for the broader market
If Magnificent Seven guidance disappoints specifically on AI revenue conversion, not just capital expenditure plans, it removes the fundamental justification for current valuations. The mechanism is direct: earnings multiples that have expanded on the expectation of AI-driven revenue growth would compress, forcing a repricing across the sector.
The OpenAI-linked selloff on 28 April offered a preview. When AI narratives faced factual challenge (missed sales targets, lower-than-expected user growth), the market repriced affected names within hours. A similar dynamic applied to any of the major hyperscalers would carry far greater index-level consequences.
A 30% melt-up or a pause: what investors should actually watch
The gap between Goldman Sachs’ year-end forecast and BCA Research’s melt-up scenario is not a minor analytical disagreement. It is a positioning decision that determines how investors size tech exposure, manage hedges, and respond to volatility over the next six months. Gartner estimates global AI spending at approximately $2.5 trillion in 2026; OpenAI, Anthropic, and xAI collectively raised more than $170 billion in 2026 funding rounds.
Semiconductor companies now representing 13% of total U.S. equity market capitalisation, a share that exceeds dot-com era concentration levels, means that AI capex concentration risk has become a systemic rather than a sector-specific concern, compressing traditional diversification benefits precisely when a single-theme correction would carry the broadest index-level consequences.
Four conditions required for the melt-up scenario to materialise:
- Continued big tech earnings validation, particularly AI revenue growth alongside capital expenditure
- Sustained AI capex confirmation from hyperscalers through mid-year guidance
- Hedge fund deployment as performance pressure forces underweight managers to add exposure
- VIX remaining below 20, preserving the low-volatility environment that supports leverage and risk-taking
Four triggers that could stall or reverse the momentum:
- Guidance disappointment on AI monetisation timelines from any Magnificent Seven company
- Brent crude surging above $110 per barrel, reigniting inflation fears
- A Federal Reserve signal of resumed tightening or delayed rate relief
- A broader AI monetisation miss that challenges the sector’s revenue conversion narrative
“The gap between Goldman’s year-end target of 7,600 and BCA Research’s melt-up scenario above 9,200 is not a rounding error. It is a positioning decision.”
The retail concentration in leveraged ETFs (SOXL, SMH) is historically a late-cycle signal. In a genuine melt-up, however, retail participation is also part of what drives the final acceleration. Distinguishing between “too late” and “still accelerating” requires monitoring the specific indicators above rather than relying on instinct.
The melt-up case is live, but it still needs to be earned
The conditions for a melt-up are present and measurable: record index levels, massive AI capital expenditure commitments, falling volatility, declining put/call ratios, and hedge fund positioning with room to deploy. The outcome, however, is not predetermined.
The next 30-60 days of earnings guidance, AI monetisation data, and macro releases will either validate or deflate the thesis. Two monitoring thresholds stand out: big tech forward guidance on AI revenue conversion, and the VIX/put/call ratio complex as early warning systems for sentiment shifts.
Investors navigating this environment face a dual risk: chasing momentum blindly into a rally that may already be pricing in its best outcomes, or exiting a market that could have 27% of runway remaining if BCA Research’s framework proves correct. The framework outlined above does not resolve that tension. It gives investors the specific signals to watch so the decision is informed rather than reactive.
For investors wanting to translate the monitoring framework above into concrete positioning decisions, our dedicated guide to options pricing around earnings season walks through a 5-step framework for quantifying event risk using implied volatility crush, front-month straddle costs, and mega-cap weighting in the S&P 500.
This article is for informational purposes only and should not be considered financial advice. Investors should conduct their own research and consult with financial professionals before making investment decisions. Past performance does not guarantee future results. Financial projections are subject to market conditions and various risk factors.