3 ASX ETFs for AI Exposure: Comparing IVV, NDQ and GXAI
9 mins ago

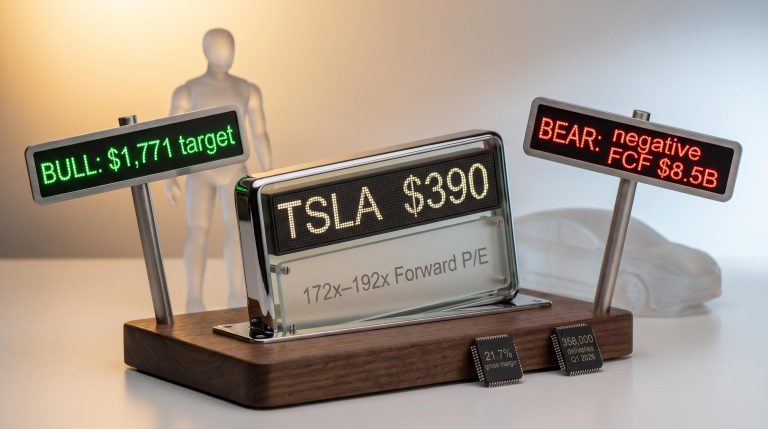
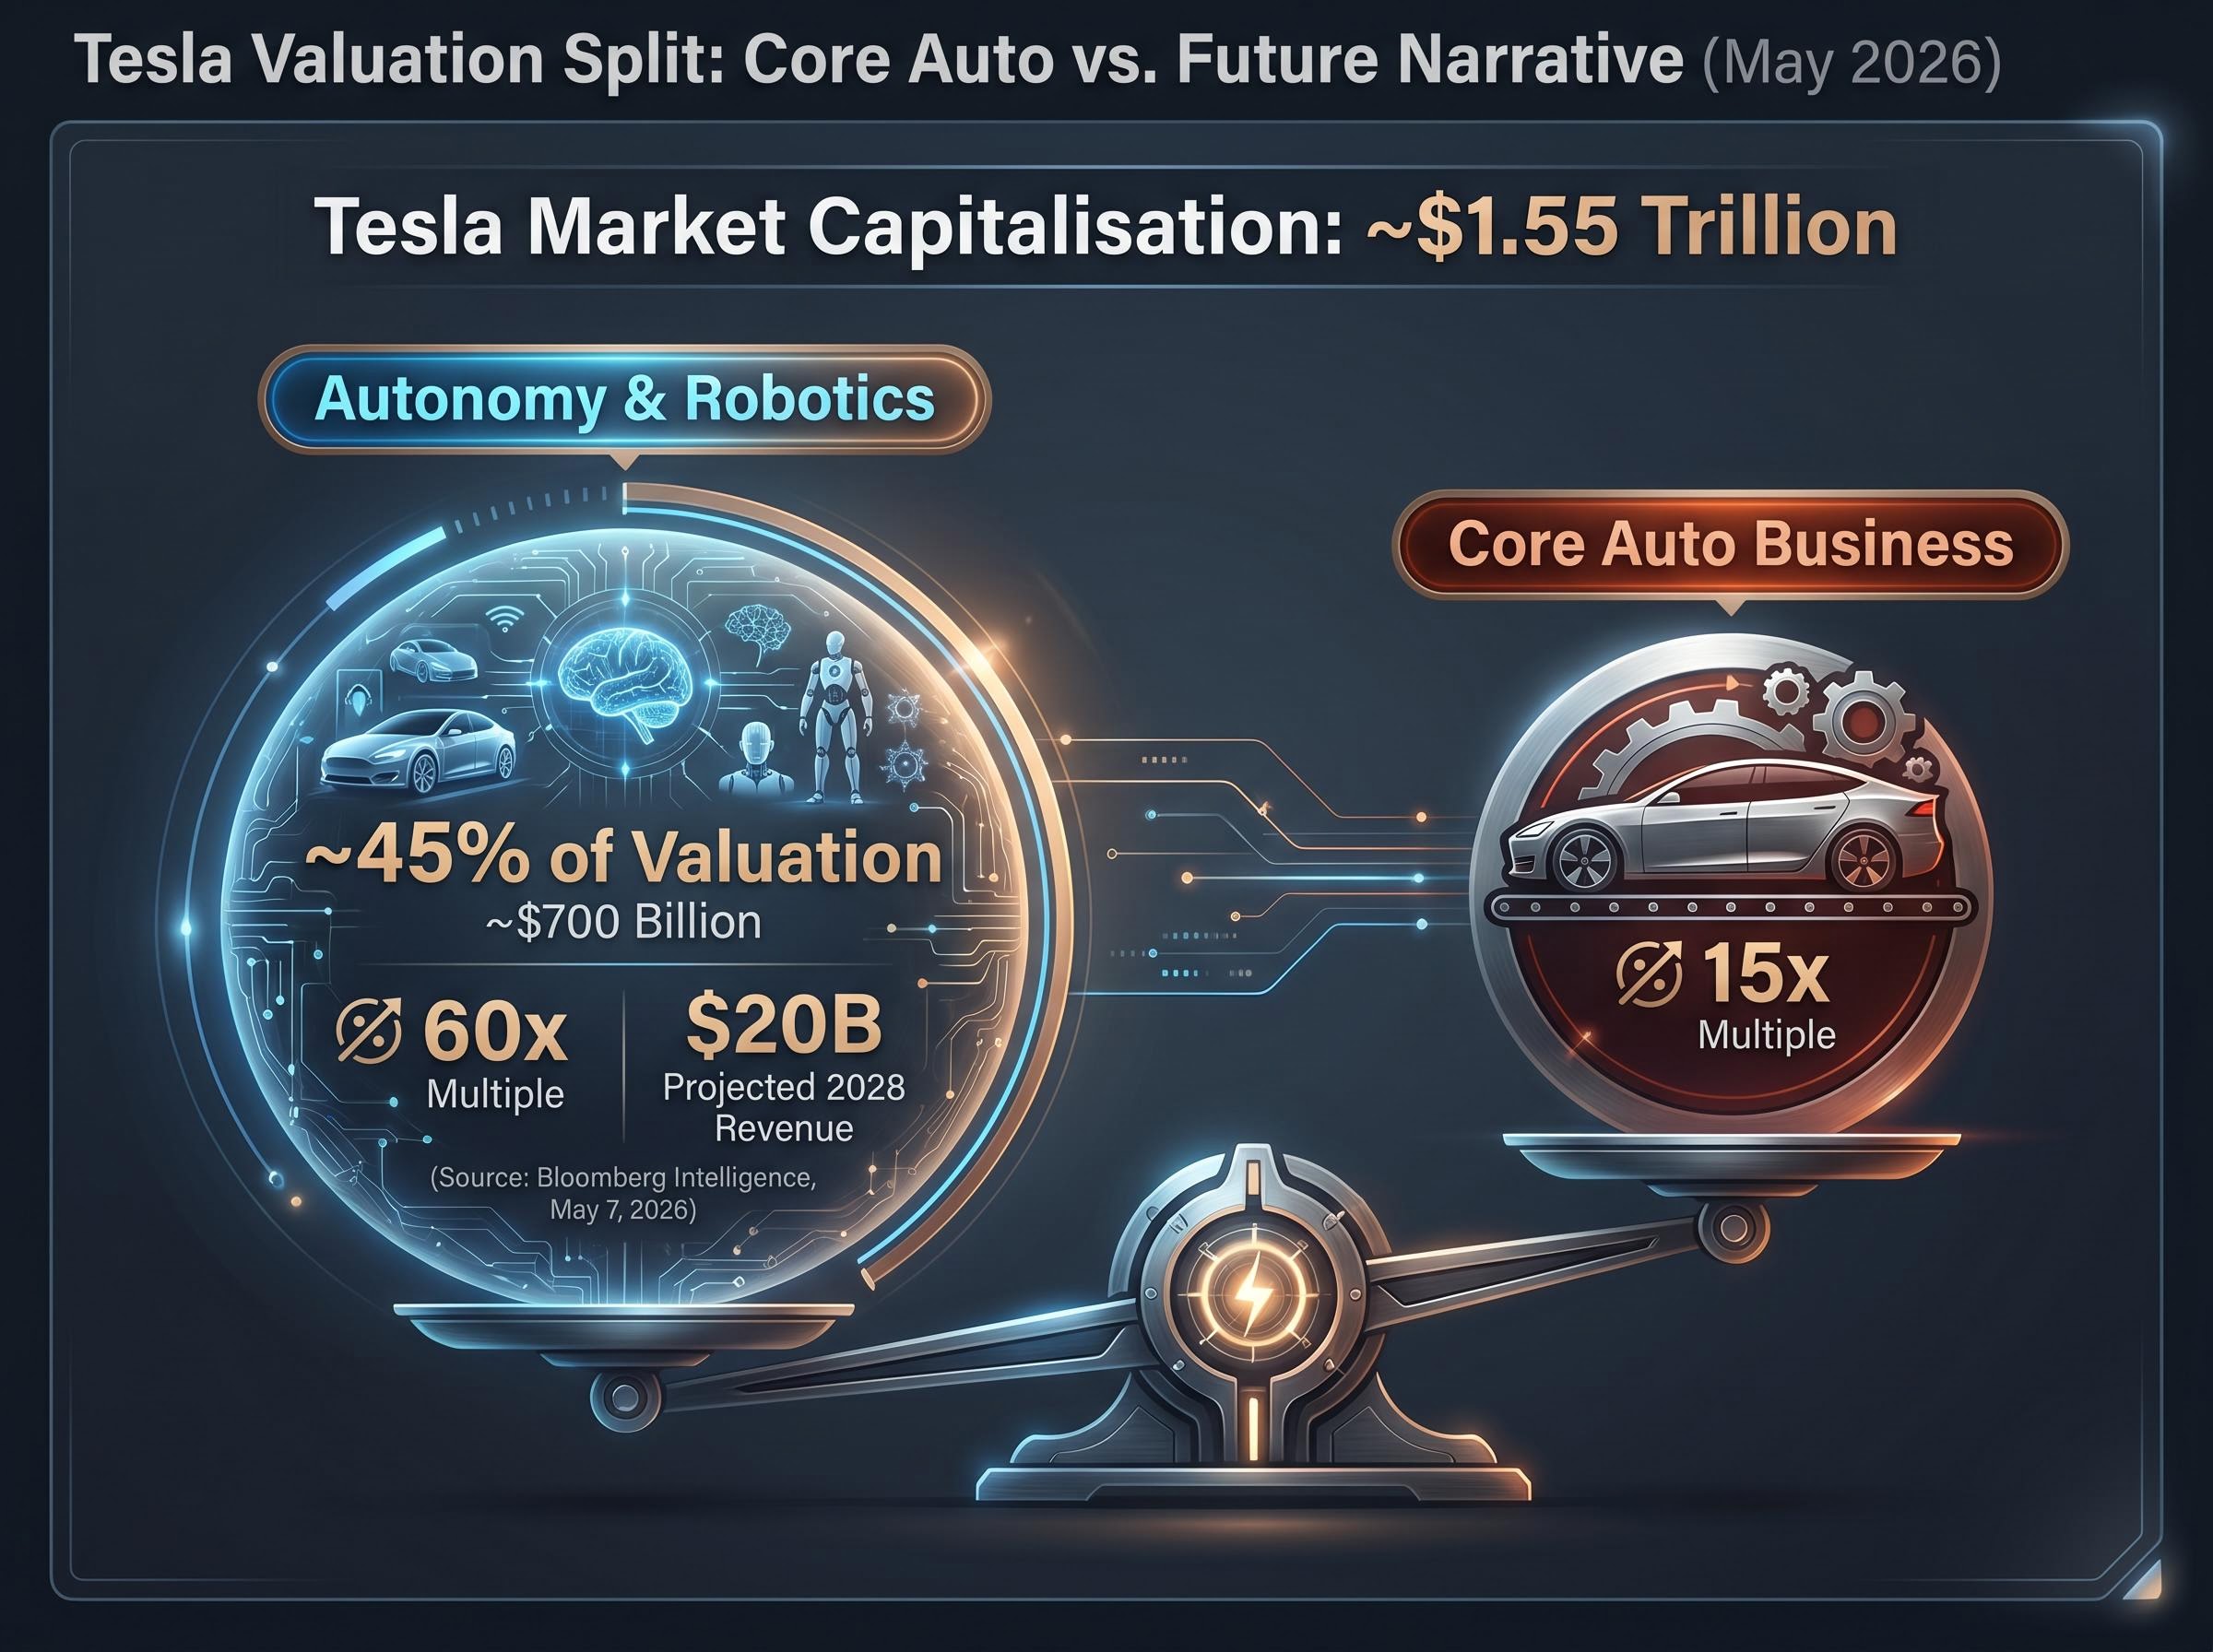
At roughly $405 per share in May 2026, Tesla trades at a market capitalisation near $1.55 trillion. Its core automotive business generates revenue that might justify a fraction of that figure. The rest is a bet on a future that has not arrived yet.
Tesla’s Q1 2026 earnings beat expectations on revenue ($22.4 billion, up 16% year-over-year), gross margin (21.7% versus a 17% consensus estimate), and adjusted earnings per share ($0.40 versus $0.35 expected). Yet the stock’s valuation still embeds roughly 40-50% tied to AI, autonomy, and robotics businesses that are either pre-revenue or early-stage. This tension between what is and what might be makes Tesla one of the most instructive stock valuation analysis cases available to investors right now.
This guide uses Tesla’s actual Q1 2026 numbers and analyst scenario work to walk through how professional investors construct bull and bear cases, set assumptions for revenue growth and margins, select valuation multiples, and calculate what each scenario implies for future returns. The methodology applies to any company in transition, well beyond Tesla.
Run a standard price-to-earnings ratio on Tesla at its current market capitalisation and the number looks absurd. Apply an enterprise value to EBITDA (EV/EBITDA) multiple, a measure that compares a company’s total value to its annual operating profit, and the result is 25-30x forward earnings. That figure dropped from 35x before Q1 earnings, but it still dwarfs the 15-18x range typically assigned to mature automakers.
The confusion is warranted. It is also the correct starting point.
A transition-stage valuation is not a measurement of what a company earns today. It is a probability-weighted bet on which future version of the company will materialise. In Tesla’s case, the market is pricing at least three versions simultaneously:
According to Bloomberg Intelligence (as of May 7, 2026), approximately 45% of Tesla’s valuation (around $700 billion) is attributed to autonomy and robotics at a Nvidia-like 60x multiple on $20 billion in projected 2028 revenue, compared to a 15x multiple on the core auto business.
The blended 25-30x multiple reflects an implicit market assumption about how much of each version is likely to materialise. Nvidia offers a precedent: its market capitalisation expanded 10x to $3 trillion by 2025 on a data centre narrative that eventually materialised, a case studied in Harvard Business Review (January 2026). Whether Tesla’s AI premium follows the same arc or collapses under execution risk is the question that defines every scenario below.
The AI premium in current market valuations extends well beyond Tesla: the S&P 500 Shiller CAPE ratio reached 40.11 on 1 May 2026, a level historically breached only at the dot-com peak, and the Magnificent Seven now represent approximately 34-35% of the S&P 500, concentrating AI-thematic risk across passive index portfolios in a way that makes Tesla’s autonomy premium part of a broader market-wide valuation question.
A bear case is not pessimism. It is a deliberate subtraction exercise. Hold the company to its current and near-certain business lines only, apply conservative but realistic growth and margin assumptions, and select a multiple appropriate to that actual business profile.
For Tesla, the bear case treats the company as a strong electric vehicle manufacturer competing in an increasingly crowded market, with no material revenue contribution from autonomous driving or robotics. The competitive pressure is real: BYD delivered 2 million EVs in Q1 2026 with approximately 30% global EV market share, steadily eroding Tesla’s approximately 15% share. Goldman Sachs revised its EV delivery growth estimate for Tesla to 12% for 2026, down from a prior 18%, citing competitive pressure from BYD and Lucid in an April 25, 2026 note.
Under this framework, the bear case assumptions look like this:
| Variable | Low | Midpoint | High |
|---|---|---|---|
| Revenue growth (annual) | 6% | 9% | 12% |
| Net profit margin | 8% | 11% | 14% |
| Valuation multiple (P/E) | 18x | 20x | 22x |
| Return implication at ~$375-405 entry | Negative | Negative | Negative |
Every projected return outcome in the bear scenario was negative over a 10-year horizon at the $375-405 entry price range. That single line tells investors something precise.
Reverse DCF methodology inverts the standard discounted cash flow calculation: rather than projecting cash flows to derive a target price, it takes the current share price as the input and solves for the implied earnings growth rate the market has already priced in, making the embedded assumptions visible rather than leaving them hidden inside a narrative.
Negative returns in a bear case do not mean the company is bad. They mean the current stock price already embeds growth that the bear scenario does not deliver.
Consider the entry price mathematics. Tesla shares traded near $100 a few years prior to this analysis. An investor who entered at that level could survive a full bear case outcome and still break even or generate positive returns, because they purchased each dollar of future cash flow at a fraction of the current cost. At $375-405, the entire return profile shifts. The price already assumes revenue growth, margin expansion, and a market multiple that exceed what the bear case delivers. Every dollar of the current price above the bear case valuation is, in effect, a payment for the transformation narrative.
A bull case is not wishful thinking. It is a structured set of conditions that must all be true simultaneously, and the discipline is in being honest about the probability that all of them are.
Tesla’s bull case requires several specific business transformations to play out: FSD adoption ramping to 30% of the fleet by 2027, Cybercab production scaling at approximately 40% gross margins, Optimus humanoid robots reaching commercial deployment, and a robotaxi network operating at meaningful scale. Morgan Stanley raised its price target to $450 on May 5, 2026, framing FSD adoption at 30% of the fleet by 2027 as adding $15 billion in revenue. ARK Invest pushed the framing further, projecting a robotaxi fleet scaling to 5 million units by 2030, generating $300 billion in revenue, with 55-60% or more of the total valuation attributed to autonomy.
Cathie Wood, Chief Executive Officer of ARK Invest, stated on May 3, 2026: “Tesla is an AI company disguised as an automaker.”
Under the bull case, the assumptions look materially different from the bear scenario:
| Variable | Low | Midpoint | High |
|---|---|---|---|
| Revenue growth (annual) | 20% | ~27% | 35% |
| Net profit margin | 20% | 25% | 30% |
| Valuation multiple (P/E) | 25x | 30x | 35x |
| Annualised return (10-year) | ~11% | ~23% | ~35% |
| Probability of full materialisation | 5-10% | ||
The return range is wide: 11-35% annualised over a decade. But the probability assigned to the full bull case materialising sits at just 5-10%. That figure is the part investors most often skip. A 35% annualised return sounds compelling until the investor registers that it requires multiple independent bets, regulatory approvals, technological milestones, and production ramps, to all pay off at once.
The gap between Tesla’s bear case (all negative returns) and bull case (11-35% annualised returns) is enormous. Three variables explain almost all of that gap, and understanding their interaction is the transferable skill this section delivers.
These three variables interact with compounding force over a long horizon. A partial execution scenario, where Tesla achieves the growth but not the margins, or the margins but at a lower multiple, produces mid-range returns that are acutely sensitive to the price paid at entry.
The $120 spread between Goldman Sachs’ $380 target and Wedbush’s $500 target is not noise. It is a sensitivity map.
Analyst price target divergence on Tesla spans from $25.28 to $600 as of early May 2026, a $575 spread that makes the market’s disagreement about the company’s future visible and quantifiable rather than a vague acknowledgment that analysts disagree.
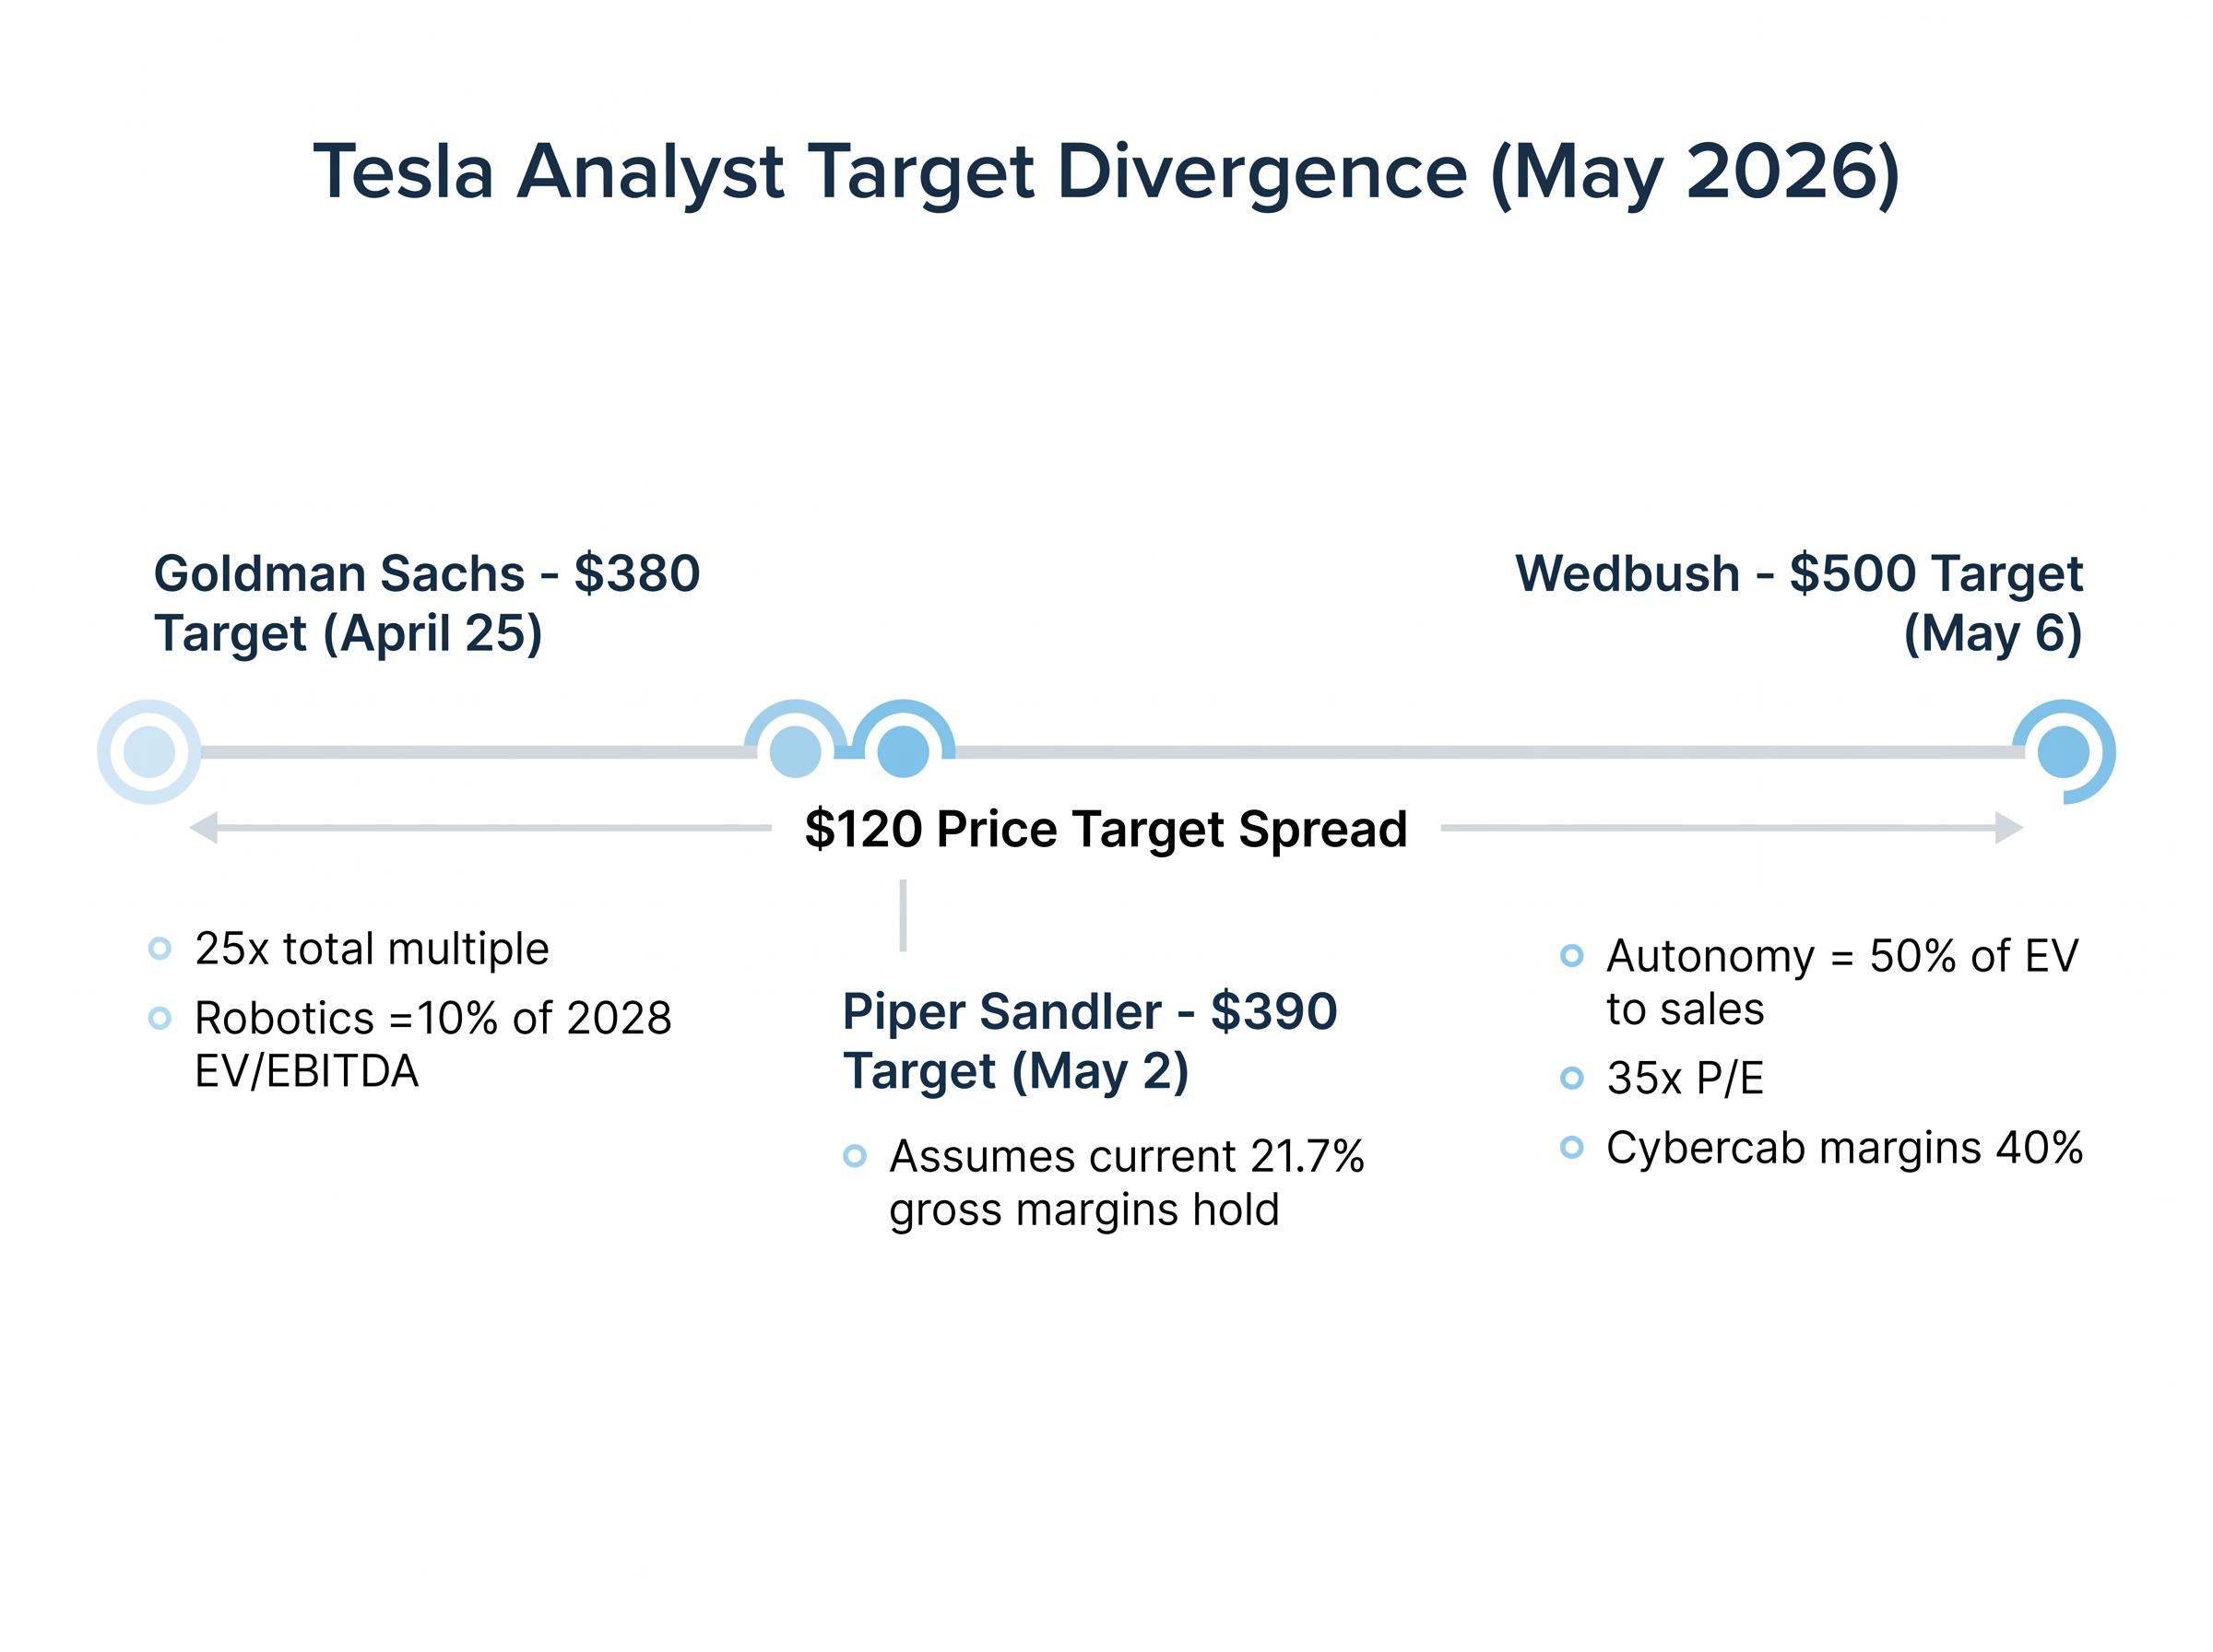
Goldman Sachs (April 25, 2026) assigns robotics only 10% of Tesla’s 2028 EV/EBITDA multiple and applies a total multiple of 25x, reflecting conservative assumptions on all three variables. Wedbush (May 6, 2026) values autonomy at 50% of enterprise value to sales at a 35x P/E, embedding Cybercab margins at 40%, a high-growth, high-margin, high-multiple set. Piper Sandler (May 2, 2026, target $390) sits in between, assuming current 21.7% gross margins hold but no major FSD regulatory wins until Q3.
Forward analyst earnings per share estimates are projected to grow more than 5x from current levels, a figure that itself reflects AI and autonomy assumptions embedded in the consensus. Meanwhile, Tesla’s $25 billion-plus capital expenditure projection for 2026, per CFO guidance on the Q1 earnings call, illustrates the cash burn required to pursue the bull case. Understanding where analysts disagree, not just what they project, is itself a research skill. The disagreements map directly onto different assumptions for growth, margins, and multiples.
Entry price operates differently for a company whose valuation embeds a future that has not yet materialised. The same set of bull case assumptions produces an 11% annualised return at the conservative end and a 35% return at the aggressive end, but these numbers apply at the current $375-405 range. At a lower entry price, the same assumptions produce higher returns, because each dollar buys more of the future cash flow.
Tesla shares traded near $100 a few years before this analysis. At that entry, an investor could survive the bear case, where every return projection turns negative at $375-405, and still generate acceptable outcomes. At the current range near the historical peak of approximately $450, the investor is almost entirely dependent on the bull case materialising. Analyst earnings per share estimates declined more than 90% from their peak before recovering in forward projections that incorporate AI and autonomy expectations, a reminder that the earnings trajectory required to justify the current price is itself a bet.
At a company priced on future narrative, entry price is not a secondary consideration. It is the primary one.
For the bull case to fully materialise, three conditions would need to be simultaneously true:
Elon Musk’s track record on timelines adds a further layer. A 2016 claim that all Tesla vehicles had full autonomy hardware, a 2019 projection of one million robotaxis by 2020, and a 2021 forecast that Optimus would be deployment-ready by 2022 all missed their schedules. These misses do not invalidate the vision, but they directly affect the probability weighting any investor should attach to timeline-dependent bull case assumptions.
The methodology laid out above is not a Tesla-specific exercise. It is a process that applies every time a company’s share price embeds a future that has not yet appeared in the financial statements.
The analyst base case for Tesla, partial execution on autonomy combined with continued core auto competitive pressure, sits between the bear and bull scenarios. That is precisely the outcome that produces mid-range returns dependent almost entirely on entry price. It is also, by most analyst assessments, the most probable outcome.
A four-step process captures the framework:
Nvidia stands as the positive precedent: a 10x market capitalisation expansion eventually justified by realised data centre revenue. Snowflake and UiPath stand as the cautionary ones.
According to Investopedia (May 2026), both Snowflake and UiPath carried narrative valuation premiums of 40-150% before experiencing 50-70% drawdowns when revenue missed expectations, framing the distinction between “narrative valuation traps” and “justified-in-hindsight premiums” as ultimately a question of execution timelines.
Palantir, cited by the CFA Institute (April 2026) as a speculative 50x sales analogue comparable to Tesla’s robotics multiple, offers a live test case in the same category. Tesla’s outcome will be determined by whether FSD regulatory approval, Cybercab production scaling, and Optimus commercial deployment arrive on a timeline that justifies the price investors pay today, or whether the narrative outruns the execution.
Every company priced on a future that has not yet materialised rewards investors who do the scenario work and penalises those who accept the narrative without pricing the risk.
For investors who have completed the scenario work and want to know when to update their probability weights, our dedicated guide to monitoring triggers for Tesla positions covers specific signals to track each quarter: auto gross margin above 18%, Robotaxi regulatory progress, Optimus production milestones, and CapEx efficiency ratios, each mapped to the bull, base, and bear scenario thresholds.
This article is for informational purposes only and should not be considered financial advice. Investors should conduct their own research and consult with financial professionals before making investment decisions. Past performance does not guarantee future results. Financial projections are subject to market conditions and various risk factors. Forward-looking statements regarding Tesla’s FSD, Cybercab, and Optimus programmes are speculative and subject to change based on regulatory developments, competitive dynamics, and company execution.
Stock valuation analysis is the process of estimating a company's intrinsic value by projecting revenue growth, profit margins, and an appropriate valuation multiple. For transition-stage companies like Tesla, it requires building separate bear, base, and bull scenarios because a significant portion of the market capitalisation reflects businesses that have not yet generated meaningful revenue.
A bear case holds the company to its existing, near-certain business lines only, applies conservative growth and margin assumptions, and uses a multiple appropriate to that actual business profile rather than the aspirational one. For Tesla, this means treating it purely as an EV manufacturer with 6-12% annual revenue growth and an 18-22x P/E multiple, which produces negative projected returns at the current entry price.
A reverse DCF inverts the standard discounted cash flow calculation by taking the current share price as the input and solving for the implied earnings growth rate the market has already priced in. This makes the assumptions embedded in a stock's current price visible rather than leaving them hidden inside an analyst narrative.
Wide analyst price target divergence, such as the range from $25.28 to $600 on Tesla as of early May 2026, maps directly onto different assumptions for revenue growth, profit margins, and valuation multiples. Understanding where analysts disagree, rather than just averaging their targets, reveals which specific variables are driving the uncertainty.
When a stock embeds a future that has not yet materialised, a higher entry price means each dollar buys less of the projected future cash flow, compressing returns across every scenario. Tesla investors who entered near $100 could survive a full bear case outcome and still achieve acceptable returns, while investors entering near $375-405 are almost entirely dependent on the bull case materialising.