3 ASX ETFs for AI Exposure: Comparing IVV, NDQ and GXAI
21 mins ago
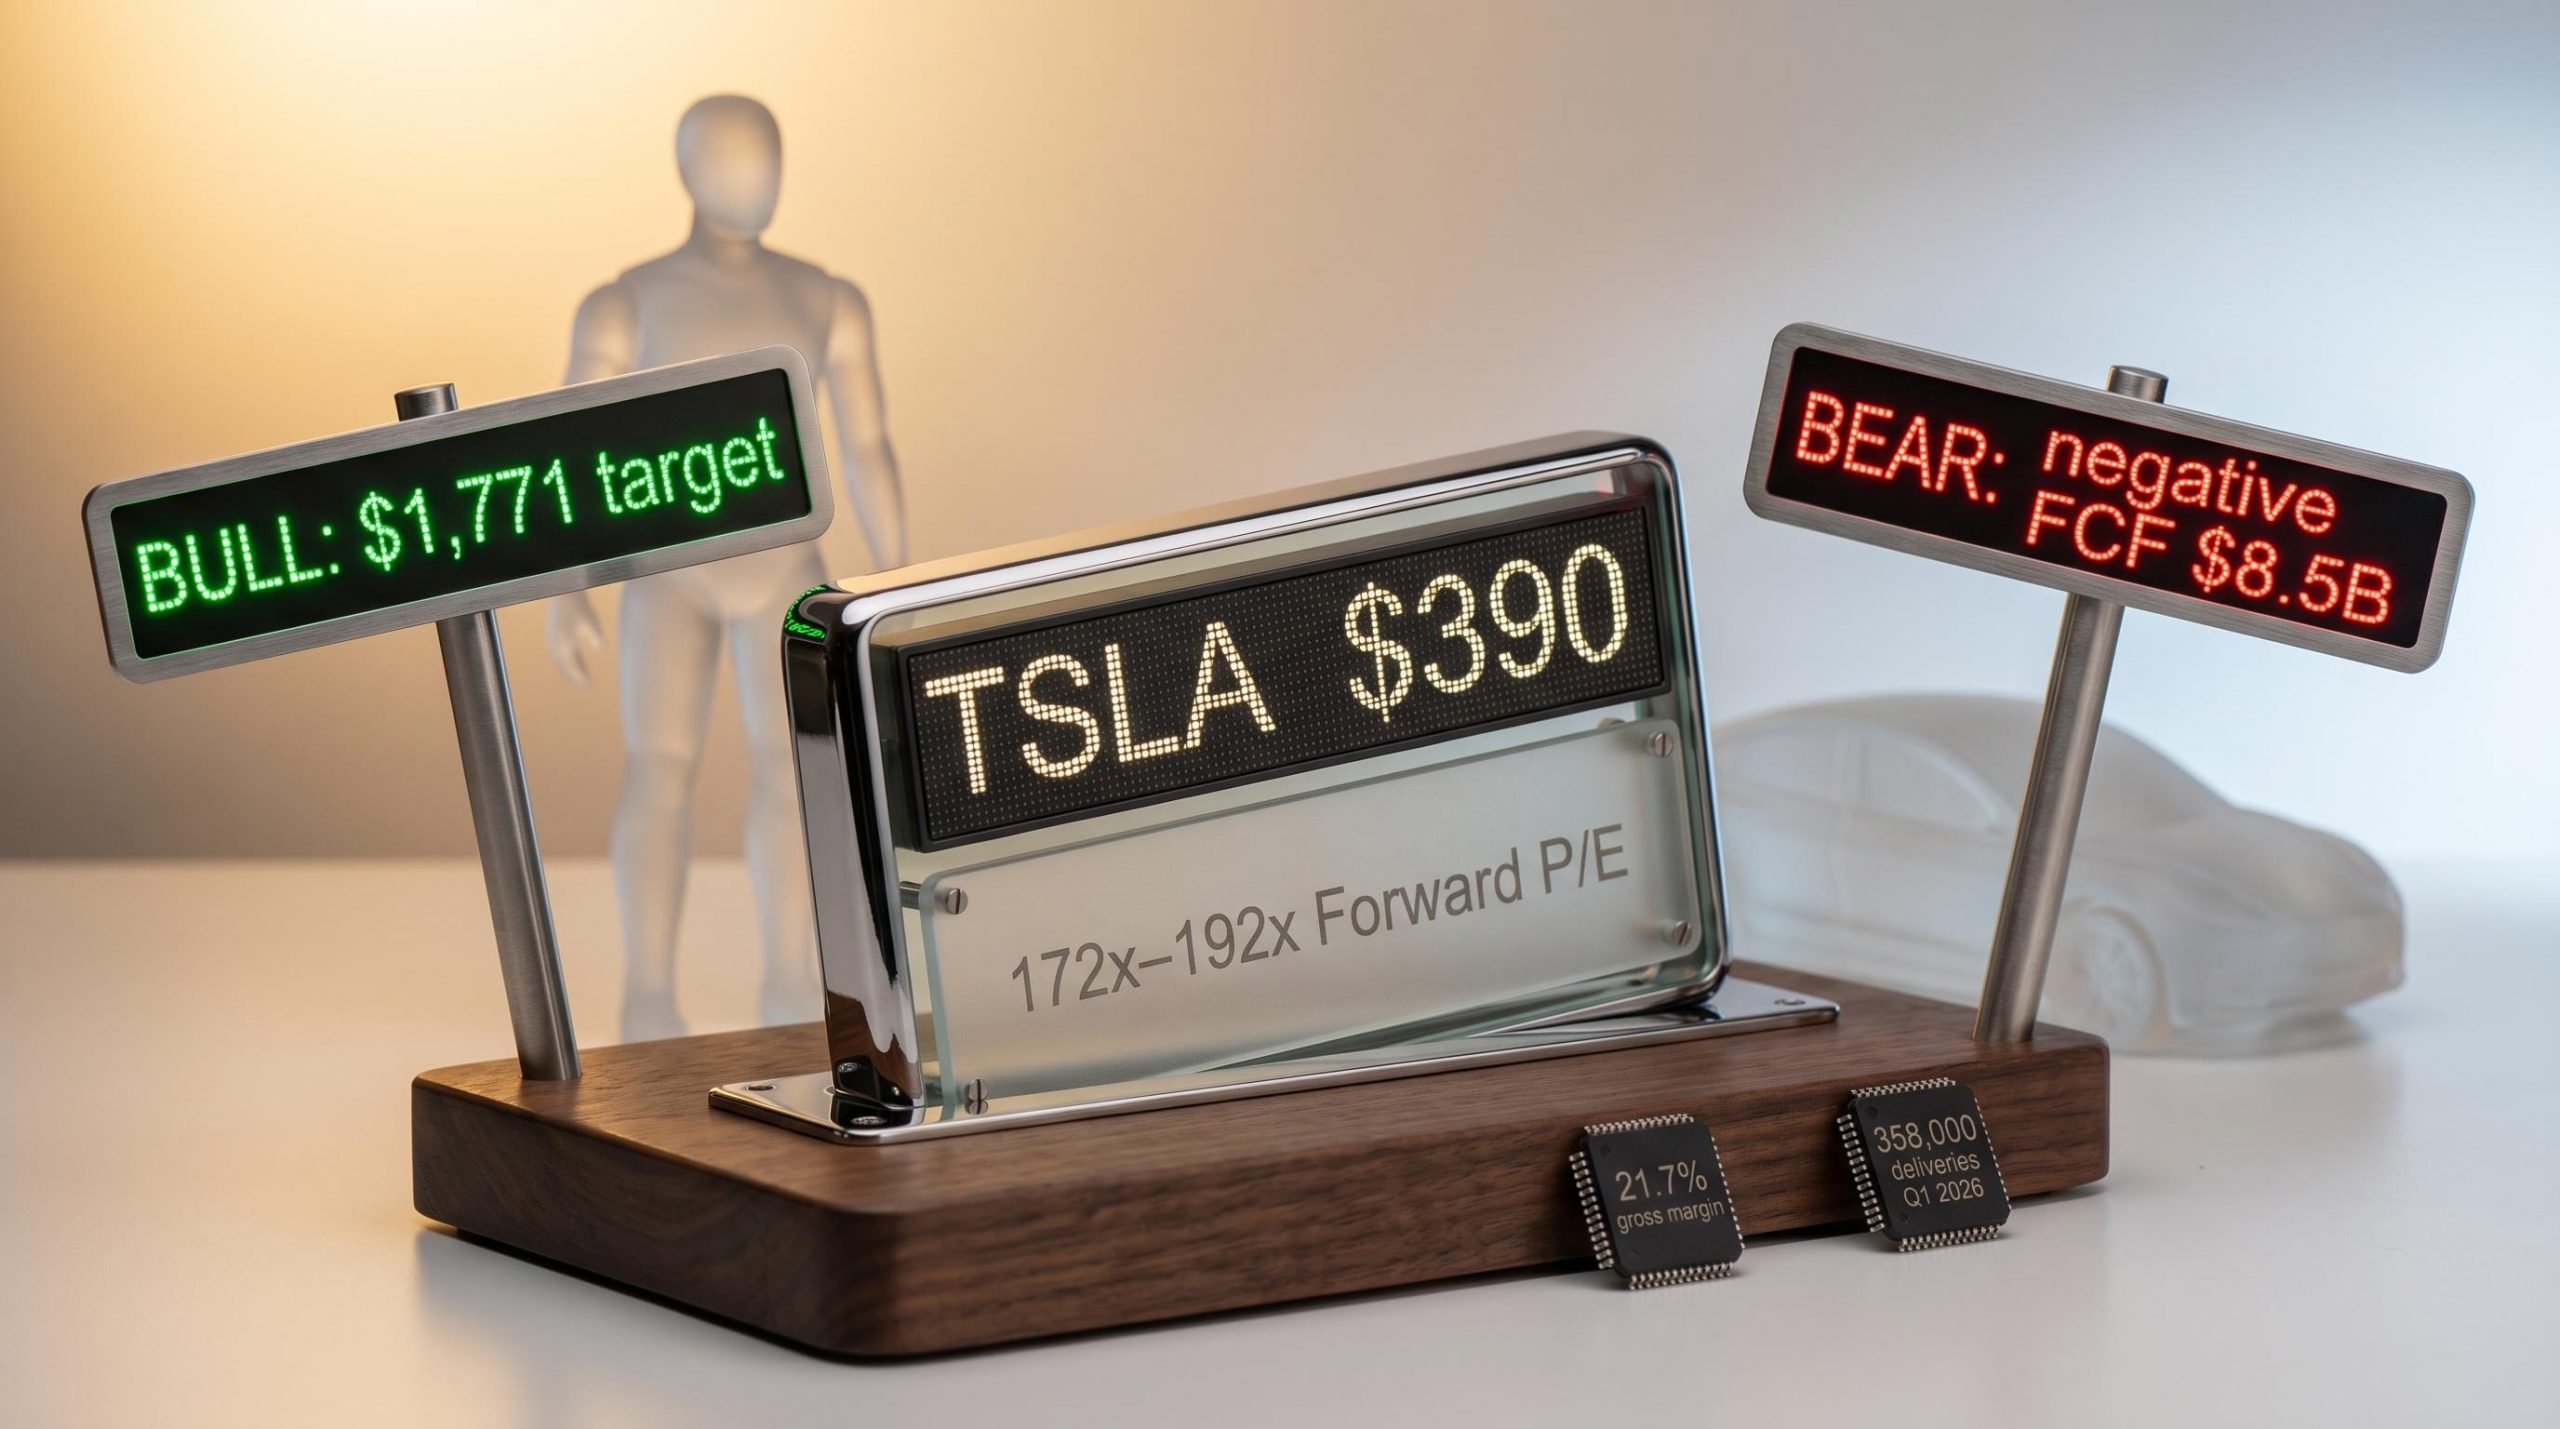
At roughly $390 per share in early May 2026, Tesla trades at nearly 180 times forward earnings. A traditional automaker at that price would be absurdly overvalued. An AI and robotics platform company at that price might be a bargain. The difference between those two interpretations is not a matter of opinion; it is a matter of methodology.
Tesla’s Q1 2026 earnings release on 22 April 2026 crystallised the analytical fork that makes high-uncertainty stocks so instructive. The company beat EPS estimates by roughly 16%, reported its strongest gross margin in five quarters at 21.7%, and simultaneously revealed $25 billion-plus in planned capital expenditure alongside a consensus free cash flow forecast of negative $8.5 billion. Bulls saw an AI entry point. Bears saw an overextended multiple with no near-term revenue to justify it. Both camps were working from the same data.
This guide uses Tesla’s Q1 2026 valuation as a live case study to teach a repeatable methodology for evaluating any company whose stock price is pricing in a transformation that has not yet happened. Readers will finish with a working framework for building bull and bear scenarios, an understanding of why entry price is one of the most consequential variables in any investment, and a concrete list of metrics that determine which scenario is unfolding.
Tesla’s forward price-to-earnings ratio sits between 172x and 192x. Traditional automakers trade at 5-15x forward earnings. The gap is not a rounding error; it is a statement about what kind of company the market believes Tesla will become.
Tesla’s forward P/E of 172-192x compared with an auto peer range of 5-15x means the current price cannot be justified by car sales alone. The premium is a bet on businesses that do not yet generate revenue.
That bet is not irrational. It is conditional. The bull camp and the bear camp are not optimists versus pessimists. They are analysts assigning different probabilities to which business Tesla will actually operate in five years: a vertically integrated AI and robotics company, or a premium electric vehicle manufacturer with ambitious side projects.
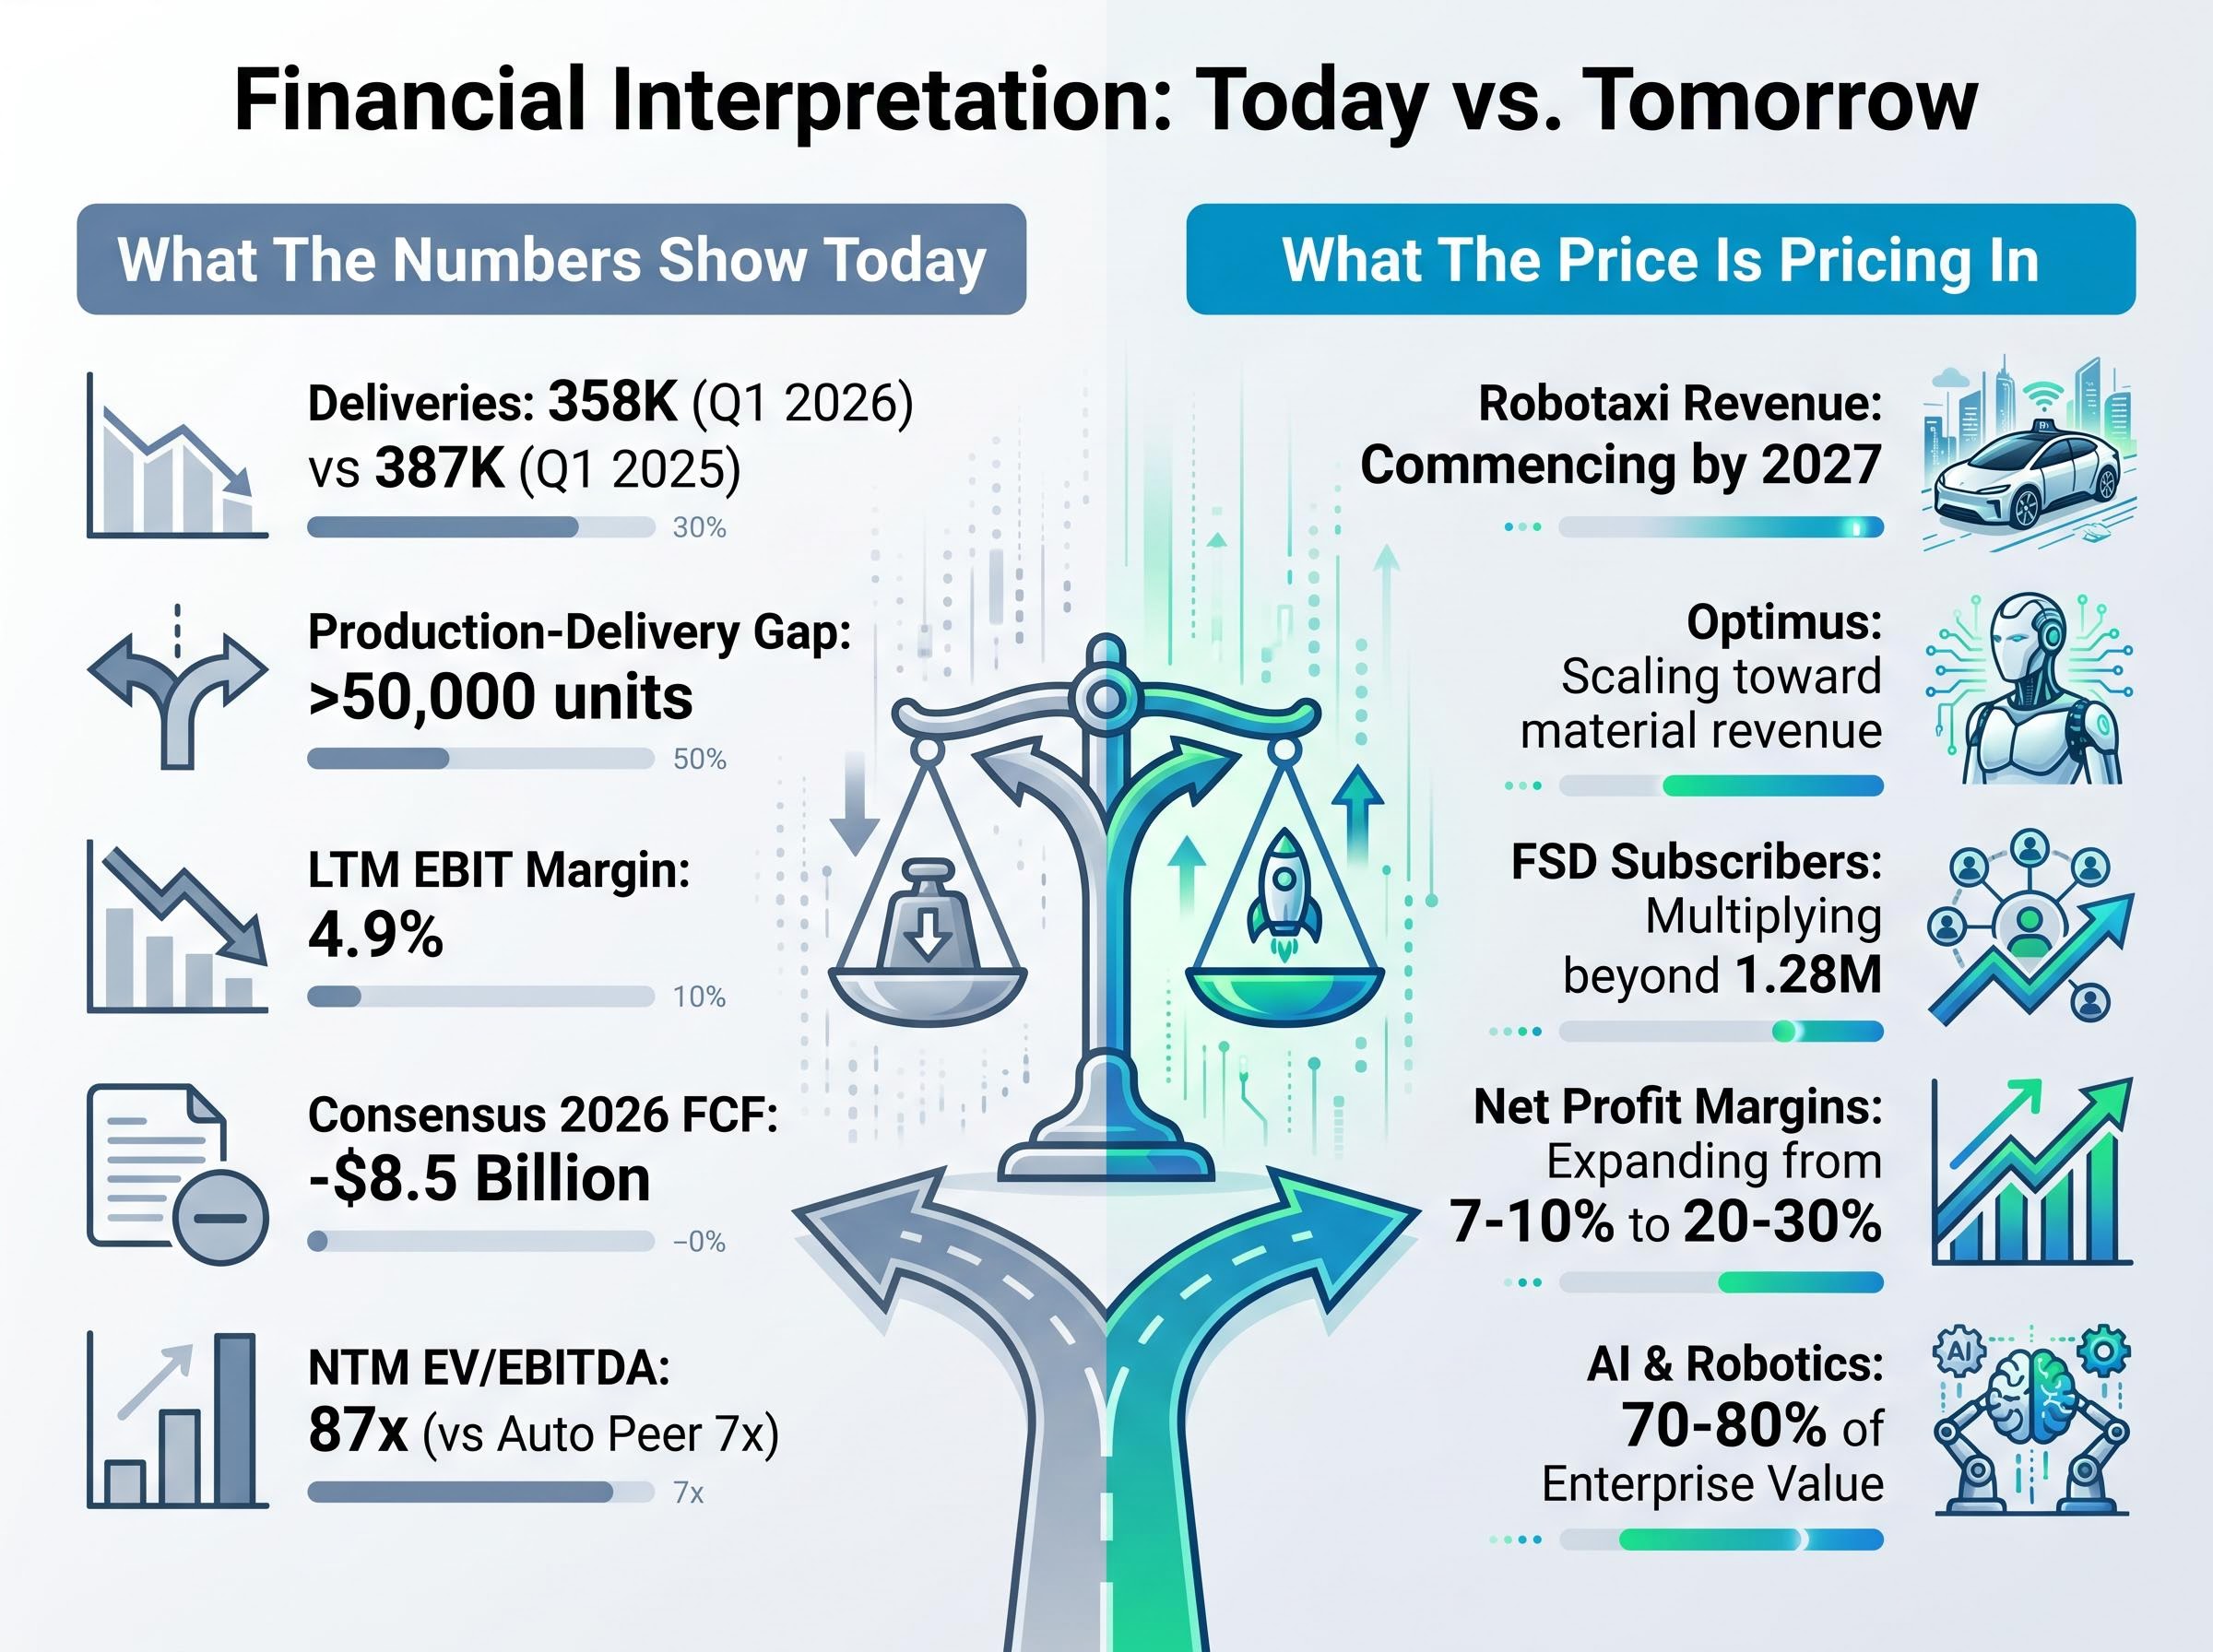
Q1 2026 sharpened the divide. The $0.41 EPS figure beat the $0.35-$0.37 consensus range. The 21.7% gross margin was the strongest in five quarters. Yet deliveries came in at 358,000 units, down from 387,000 in Q1 2025, and the production-delivery gap exceeded 50,000 units, signalling inventory buildup.
Tesla’s Q1 2026 earnings beat cleared every Wall Street metric on revenue, adjusted EPS, and gross margin, yet the 188x forward P/E means the automotive outperformance does not independently justify the share price; the gap between what the business earned and what the price requires is precisely where scenario analysis begins.
The same quarter, read through two different lenses:
What the numbers show today:
What the price is pricing in:
Any stock where the current price can only be justified by future business lines that do not yet generate revenue demands a different analytical toolkit. Tesla is not merely a trading debate. It is a teaching instrument.
A single-point discounted cash flow model produces a single number. For a mature utility company with predictable cash flows, that number carries useful precision. For a company whose future business mix is genuinely uncertain, a single DCF estimate creates a false sense of confidence. The output looks precise, but the inputs are guesses dressed as assumptions.
Scenario-based valuation addresses this by replacing the single estimate with multiple versions of the future, each with explicit assumptions and an assigned probability of occurring. The methodology converts uncertainty from a weakness in the model into a feature of it.
Building a scenario-weighted valuation follows three steps:
The complementary tool is reverse DCF. Instead of projecting forward from assumptions, reverse DCF asks what growth rate the current share price is already assuming.
Reverse DCF reframes the investor’s question from “what will happen?” to “what has to happen for this price to make sense?”
For Tesla, reverse DCF analysis implies that the current 172-192x NTM P/E requires approximately 40% compound annual growth through 2030 for the AI thesis to justify the multiple. The consensus 2026 free cash flow estimate of negative $8.5 billion serves as the base case starting point for any cash flow modelling.
These two tools, scenario-weighted DCF and reverse DCF, are the foundational methods professionals use to evaluate any stock that prices in a future state. Once internalised, the framework applies to any transformation-stage company, not only Tesla.
Probability-weighted scenario analysis converts three narrative outcomes into a single blended expected return, which an investor can then compare directly against their required rate of return at any given entry price, a translation step that makes the bull-bear framework actionable rather than purely descriptive.
The bull case for Tesla at $390 is not a vague optimism. It is a set of specific quantitative assumptions, and each one maps to a business reality that must materialise.
| Assumption Type | Low End | Midpoint | High End | What It Requires |
|---|---|---|---|---|
| Revenue Growth (CAGR) | 20% | 27% | 35% | Robotaxi and Optimus revenue commencing by 2027; FSD subscriber base multiplying |
| Net Profit Margin | 20% | 25% | 30% | Margin expansion from current 7-10% via software and services mix shift |
| Valuation Multiple | 25x | 30x | 35x | Market re-rating Tesla as a technology platform, not an automaker |
The bull analyst midpoint price target sits at approximately $1,771, representing roughly 353% upside from $390.82. The street consensus target is more modest at approximately $414. Estimated annualised returns under the bull scenario range from approximately 11% to 35% over a 10-year horizon.
Peer group selection is one of the highest-leverage decisions in any high-multiple valuation: automotive frameworks imply a 12-18x forward P/E for Tesla while AI and technology frameworks imply 55-75x, and the choice between them is not arbitrary but a direct expression of which thesis the analyst accepts about the company’s future identity.
The strongest evidence from Q1 2026 supporting this scenario includes the 21.7% gross margin, 1.28 million paid FSD users growing at approximately 13.6% quarter-over-quarter, and autonomous vehicle miles driven that nearly doubled on a quarterly basis. Tesla’s vertical integration via in-house AI chip fabrication at Terafab is cited by bulls as a data and cost moat that competitors cannot replicate quickly.
Three near-term catalysts would validate or invalidate this trajectory:
Each assumption in the table above requires multiple things to go right simultaneously. Revenue growth of 27% requires not just automotive recovery but entirely new revenue streams from Robotaxi and Optimus. Margin expansion to 25% requires a business mix shift that has not yet begun. The valuation multiple of 30x requires the market to permanently re-classify Tesla away from automotive peer comparisons. Understanding these specific thresholds allows an investor to track whether the story is on schedule, rather than simply reacting to quarterly headlines.
The bear case does not assume Tesla collapses. It assumes Tesla remains a strong electric vehicle company but does not generate meaningful AI or robotics revenue within the timeframe the current price requires. That distinction matters, because even under generous automotive assumptions, every return projection at approximately $375 per share is negative.
| Assumption Type | Low End | Midpoint | High End | What It Requires |
|---|---|---|---|---|
| Revenue Growth (CAGR) | 6% | 9% | 12% | Automotive-only growth; no material AI or Robotaxi revenue by 2030 |
| Net Profit Margin | 8% | 11% | 14% | Margins stable or modestly improving, but no software mix shift |
| Valuation Multiple | 18x | 20x | 22x | Multiple compresses toward premium automaker range as AI premium fades |
At approximately $375 per share, every projected return outcome under the bear case was negative, even assuming Tesla remains a strong EV company.
The specific risks that would drive this scenario are concrete, not speculative. Auto gross margins falling below 18% in Q2 2026 would signal pricing pressure the bull case cannot absorb. Continued delivery declines from the Q1 2025 baseline of 387,000 units would confirm cyclical weakness. Regulatory delays for Robotaxi commercial permits in California, where no filings have been confirmed as of early May 2026, would push the revenue timeline that justifies the multiple further into the future. And the $25 billion-plus capex commitment against a consensus free cash flow of negative $8.5 billion for 2026 means the company is burning cash to build businesses that may not produce revenue on the timeline the market requires.
The LTM EBIT margin of 4.9% reinforces the bear camp’s arithmetic. At that level, automotive operations alone do not support a $390 share price under any reasonable multiple.
This section’s uncomfortable insight is about entry price, not about Tesla’s quality as a company. The same stock purchased near $100 a few years prior versus near $390 today produces dramatically different outcome distributions. Entry price is not one variable among many. It is the variable that determines the risk-reward ratio before any other factor.
Transformation-stage investing is not a one-time decision. It is an ongoing hypothesis test. The bull and bear scenarios outlined above are not static pictures; they are live hypotheses that specific, measurable data points will confirm or contradict in the coming quarters.
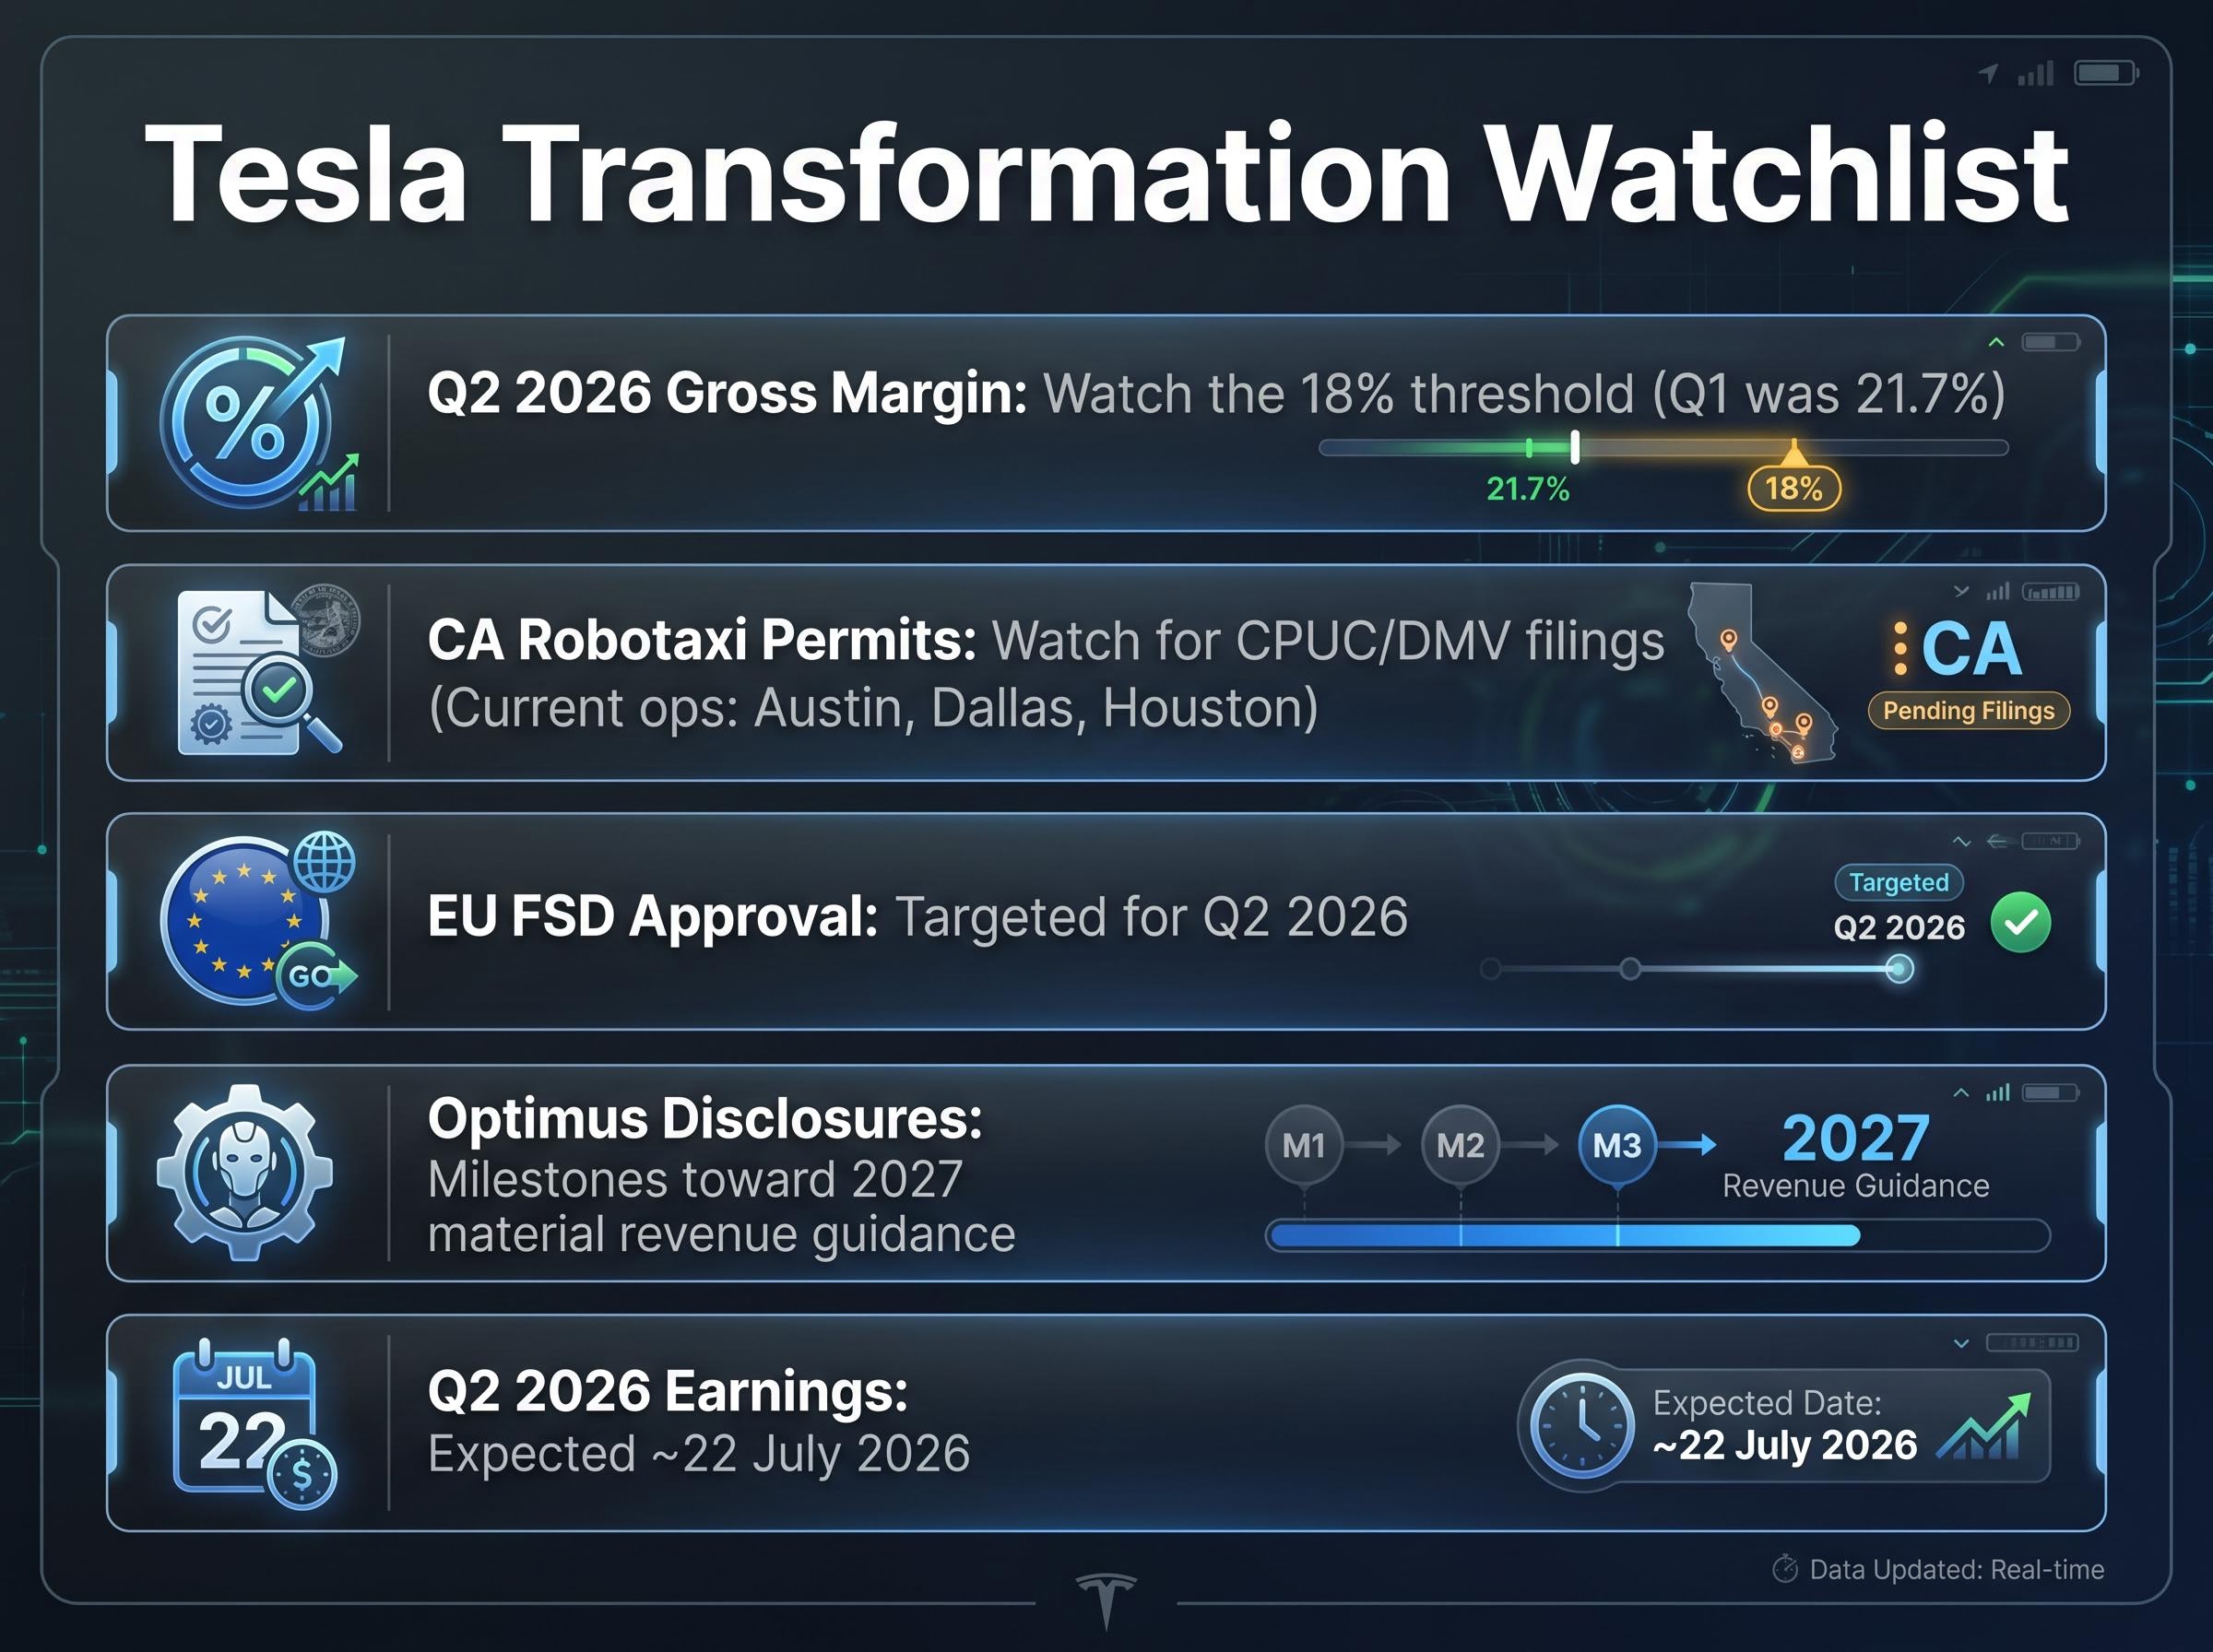
Five metrics form a practical watchlist:
The CPUC autonomous vehicle passenger service programs establish the dual-permit structure that any robotaxi operator must navigate: a CPUC passenger service permit and a corresponding California DMV autonomous vehicle permit, both required before a single commercial fare can be collected in the state.
Elon Musk’s timeline track record provides a useful calibration tool. The pattern is consistent: full self-driving hardware was claimed in 2016, one million Robotaxis were projected by 2020 (announced in 2019), and Optimus was described as deployment-ready by 2022 (projected in 2021). None materialised on schedule. This does not mean the technologies are failing. It does suggest investors should apply a timeline discount to management guidance, potentially shifting probability weights away from the bull case or extending the time horizon required for the bull scenario to play out.
The competitive environment could compress the timeline for scenario resolution in either direction. Waymo, a subsidiary of Alphabet, operates over 100,000 weekly rides in 2026 with active geo-fenced California commercial approvals, a regulatory position Tesla does not yet hold. Figure is piloting humanoid robots in BMW manufacturing facilities, providing a real-world benchmark for Optimus commercialisation timelines. The capital firepower of Microsoft, Google, and Amazon in adjacent AI markets means Tesla’s data moat advantage faces well-funded competitors.
Knowing which metrics to watch converts a speculative position into a monitored thesis.
Tesla at $390 is a near-perfect specimen of a stock whose price can only be justified by scenario-dependent assumptions. That makes it one of the most instructive case studies available for any investor holding, or considering, a position in a transformation-stage company.
The methodology demonstrated across this guide applies to any high-multiple stock that is pricing in a future business which does not yet exist in revenue form. The framework distils into four steps:
The price paid at entry is not one variable among many. It is the variable that sets the risk-reward ratio before any other factor is considered.
Tesla’s own price history illustrates this directly. Analyst EPS estimates declined more than 90% from peak before recovering in forward projections that now project EPS growing more than 5x from current levels. The thesis may ultimately prove correct. But an investor who entered at $100 and an investor who entered at $390 hold the same thesis with dramatically different return distributions. The most likely outcome for transformation-stage companies is often a middle scenario: partial execution, some new revenue materialising but slower and smaller than the bull case. That middle scenario may still produce negative returns at current prices if the multiple compresses as AI revenue ramps more slowly than expected.
Tesla at approximately $390 in May 2026 is not a buy or sell recommendation. It is an analytical exhibit: a stock whose price structure makes visible every tension that transformation-stage investing creates.
The framework presented here, scenario construction, reverse DCF, milestone monitoring, and entry price discipline, is not Tesla-specific. Any position where the current multiple requires a transformation that has not yet produced revenue deserves the same treatment. Identify those positions. Run the same bull and bear construction. Assign honest probabilities. Define monitoring metrics.
The next major data point for Tesla arrives with Q2 2026 earnings, expected approximately 22 July 2026. Gross margin versus the 18% threshold will be the single most watched figure, because it will tell investors whether the Q1 strength was a trend or an outlier.
For investors wanting to apply this same three-variable scenario framework to other companies whose current price embeds a future business that does not yet appear in financial statements, our dedicated guide to transition-stage stock valuation walks through the portable methodology with worked examples, including how to adjust probability weights as execution data arrives each quarter.
This article is for informational purposes only and should not be considered financial advice. Investors should conduct their own research and consult with financial professionals before making investment decisions. Past performance does not guarantee future results. Financial projections are subject to market conditions and various risk factors.
—
Scenario-based stock valuation analysis replaces a single projected estimate with multiple versions of a company's future, each with explicit assumptions and an assigned probability, converting uncertainty into a structured feature of the model rather than a weakness.
Reverse DCF works backwards from the current share price to calculate the growth rate already embedded in that price, reframing the investor's question from what will happen to what must happen for the current price to make sense.
Entry price sets the risk-reward ratio before any other factor is considered; the same thesis held by an investor who entered Tesla near $100 versus one who entered near $390 produces dramatically different outcome distributions, even if the underlying story is identical.
Key metrics include Q2 2026 gross margin relative to the 18% threshold, California CPUC and DMV Robotaxi permit filings, EU-wide FSD approval, Optimus production volume disclosures, and the Q2 2026 earnings release expected around 22 July 2026.
The four-step framework, identifying what the current price assumes via reverse DCF, building honest bull and bear scenarios with explicit assumptions, assigning realistic probabilities, and defining monitoring metrics, applies to any transformation-stage company whose share price is pricing in revenue that does not yet exist.