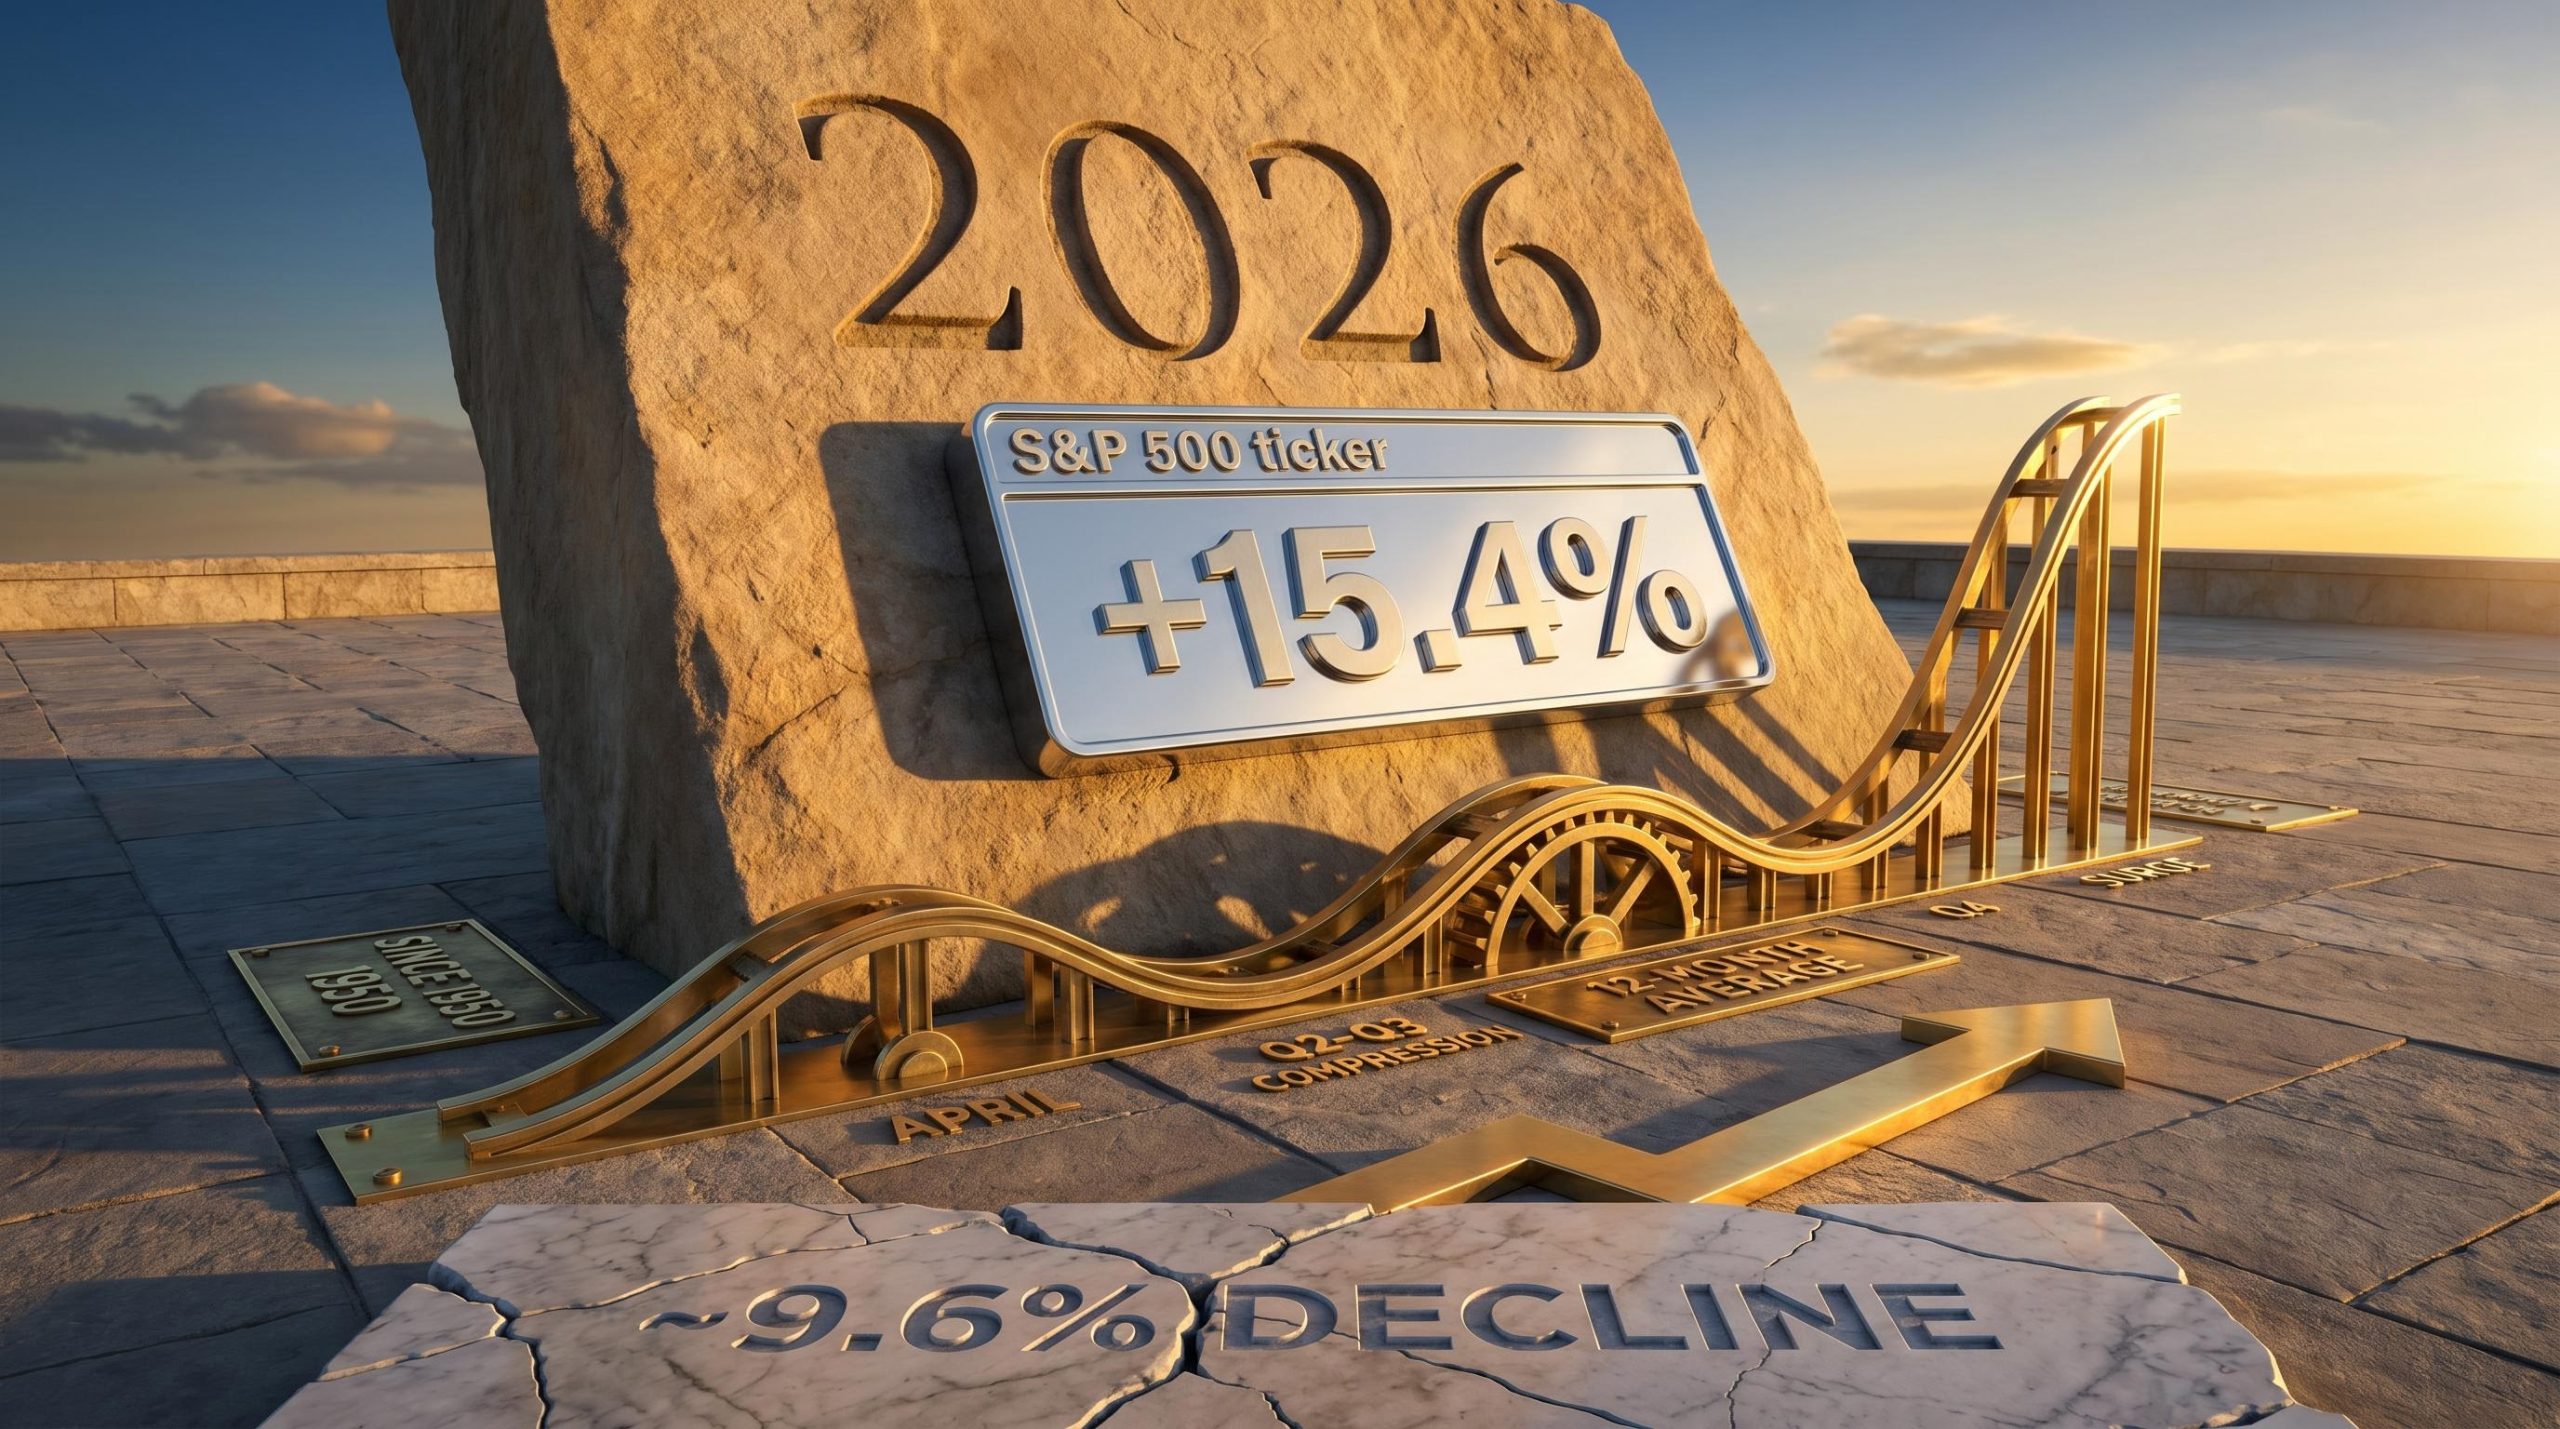
In every midterm election year since 1950 except two, the sitting president’s party has lost congressional seats. Equity markets have typically weakened in the months leading up to those elections, compressing returns and testing investor patience. Yet the 12-month period following midterms has averaged a +15.4% gain for the S&P 500. The contradiction is only apparent. There is a structural explanation for why political uncertainty reliably depresses equities before midterms and why the removal of that uncertainty reliably lifts them afterward.
May 2026 sits squarely in the historically choppy first half of a presidential second year, a period characterised by elevated volatility, compressed returns, and the kind of policy noise that tempts investors into defensive repositioning at precisely the wrong moment. This pattern is not accidental, and it is not new. What follows is an examination of the mechanism behind the so-called “Midterm Miracle,” a review of the historical record including its rare failures, and an assessment of why Q4 2026 may be setting up as a structurally favourable period for equity investors.
A pattern hiding in plain sight: what the four-year presidential cycle actually looks like
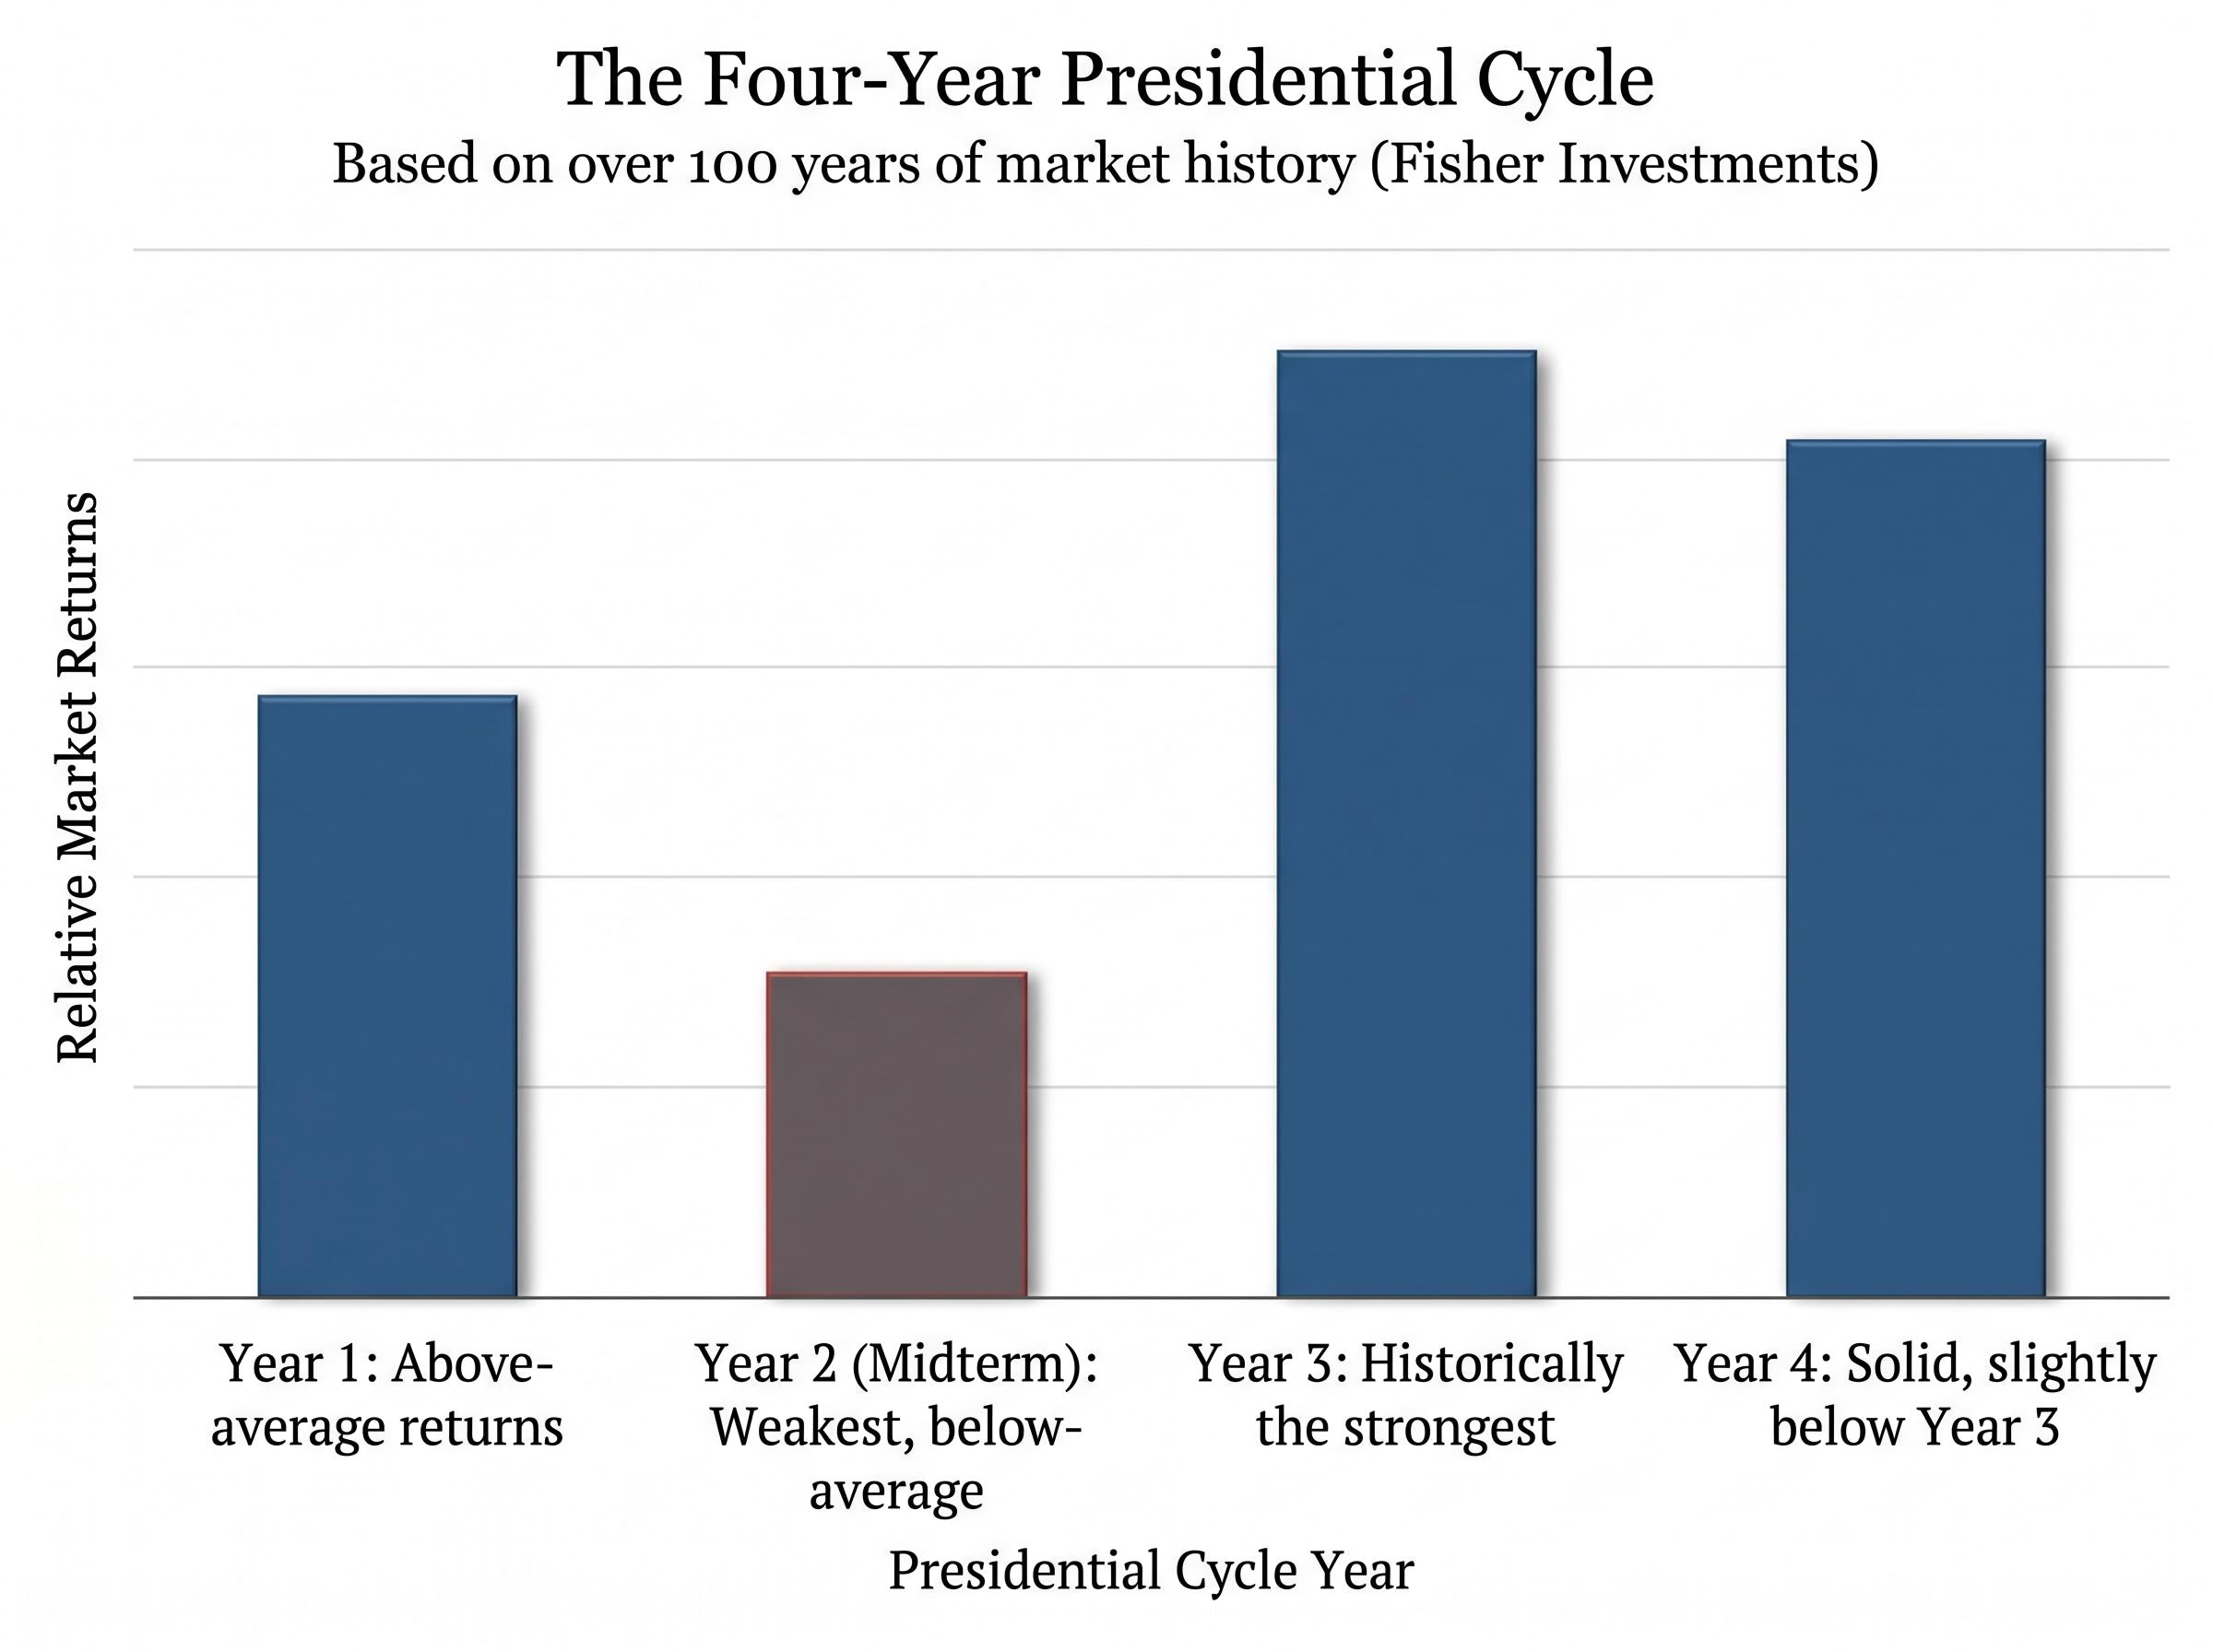
The four-year presidential cycle is one of the most persistent seasonal patterns in US equity data, documented across more than 100 years of market history according to Fisher Investments. Each year of a presidential term carries a distinct return profile, and the hierarchy is remarkably consistent:
The NBER research on political cycles and stock returns provides empirical grounding for the four-year presidential cycle framework, modelling the mechanisms through which political transitions generate measurable differences in equity returns across the distinct phases of a presidential term.
- Year 1 (inauguration year): Above-average returns as markets price in new policy direction and early legislative momentum.
- Year 2 (midterm year): The weakest of the four. Below-average full-year returns, deeper intra-year pullbacks, and elevated volatility relative to non-election years.
- Year 3 (post-midterm year): Historically the strongest, driven by the post-midterm recovery and reduced legislative risk heading into re-election positioning.
- Year 4 (election year): Solid but slightly below Year 3, as incumbent administrations tend to avoid disruptive policy and markets price in the next cycle.
The midterm year’s weakness is not evenly distributed. It concentrates in a specific window, and that window is where the opportunity hides.
How midterm years split in two
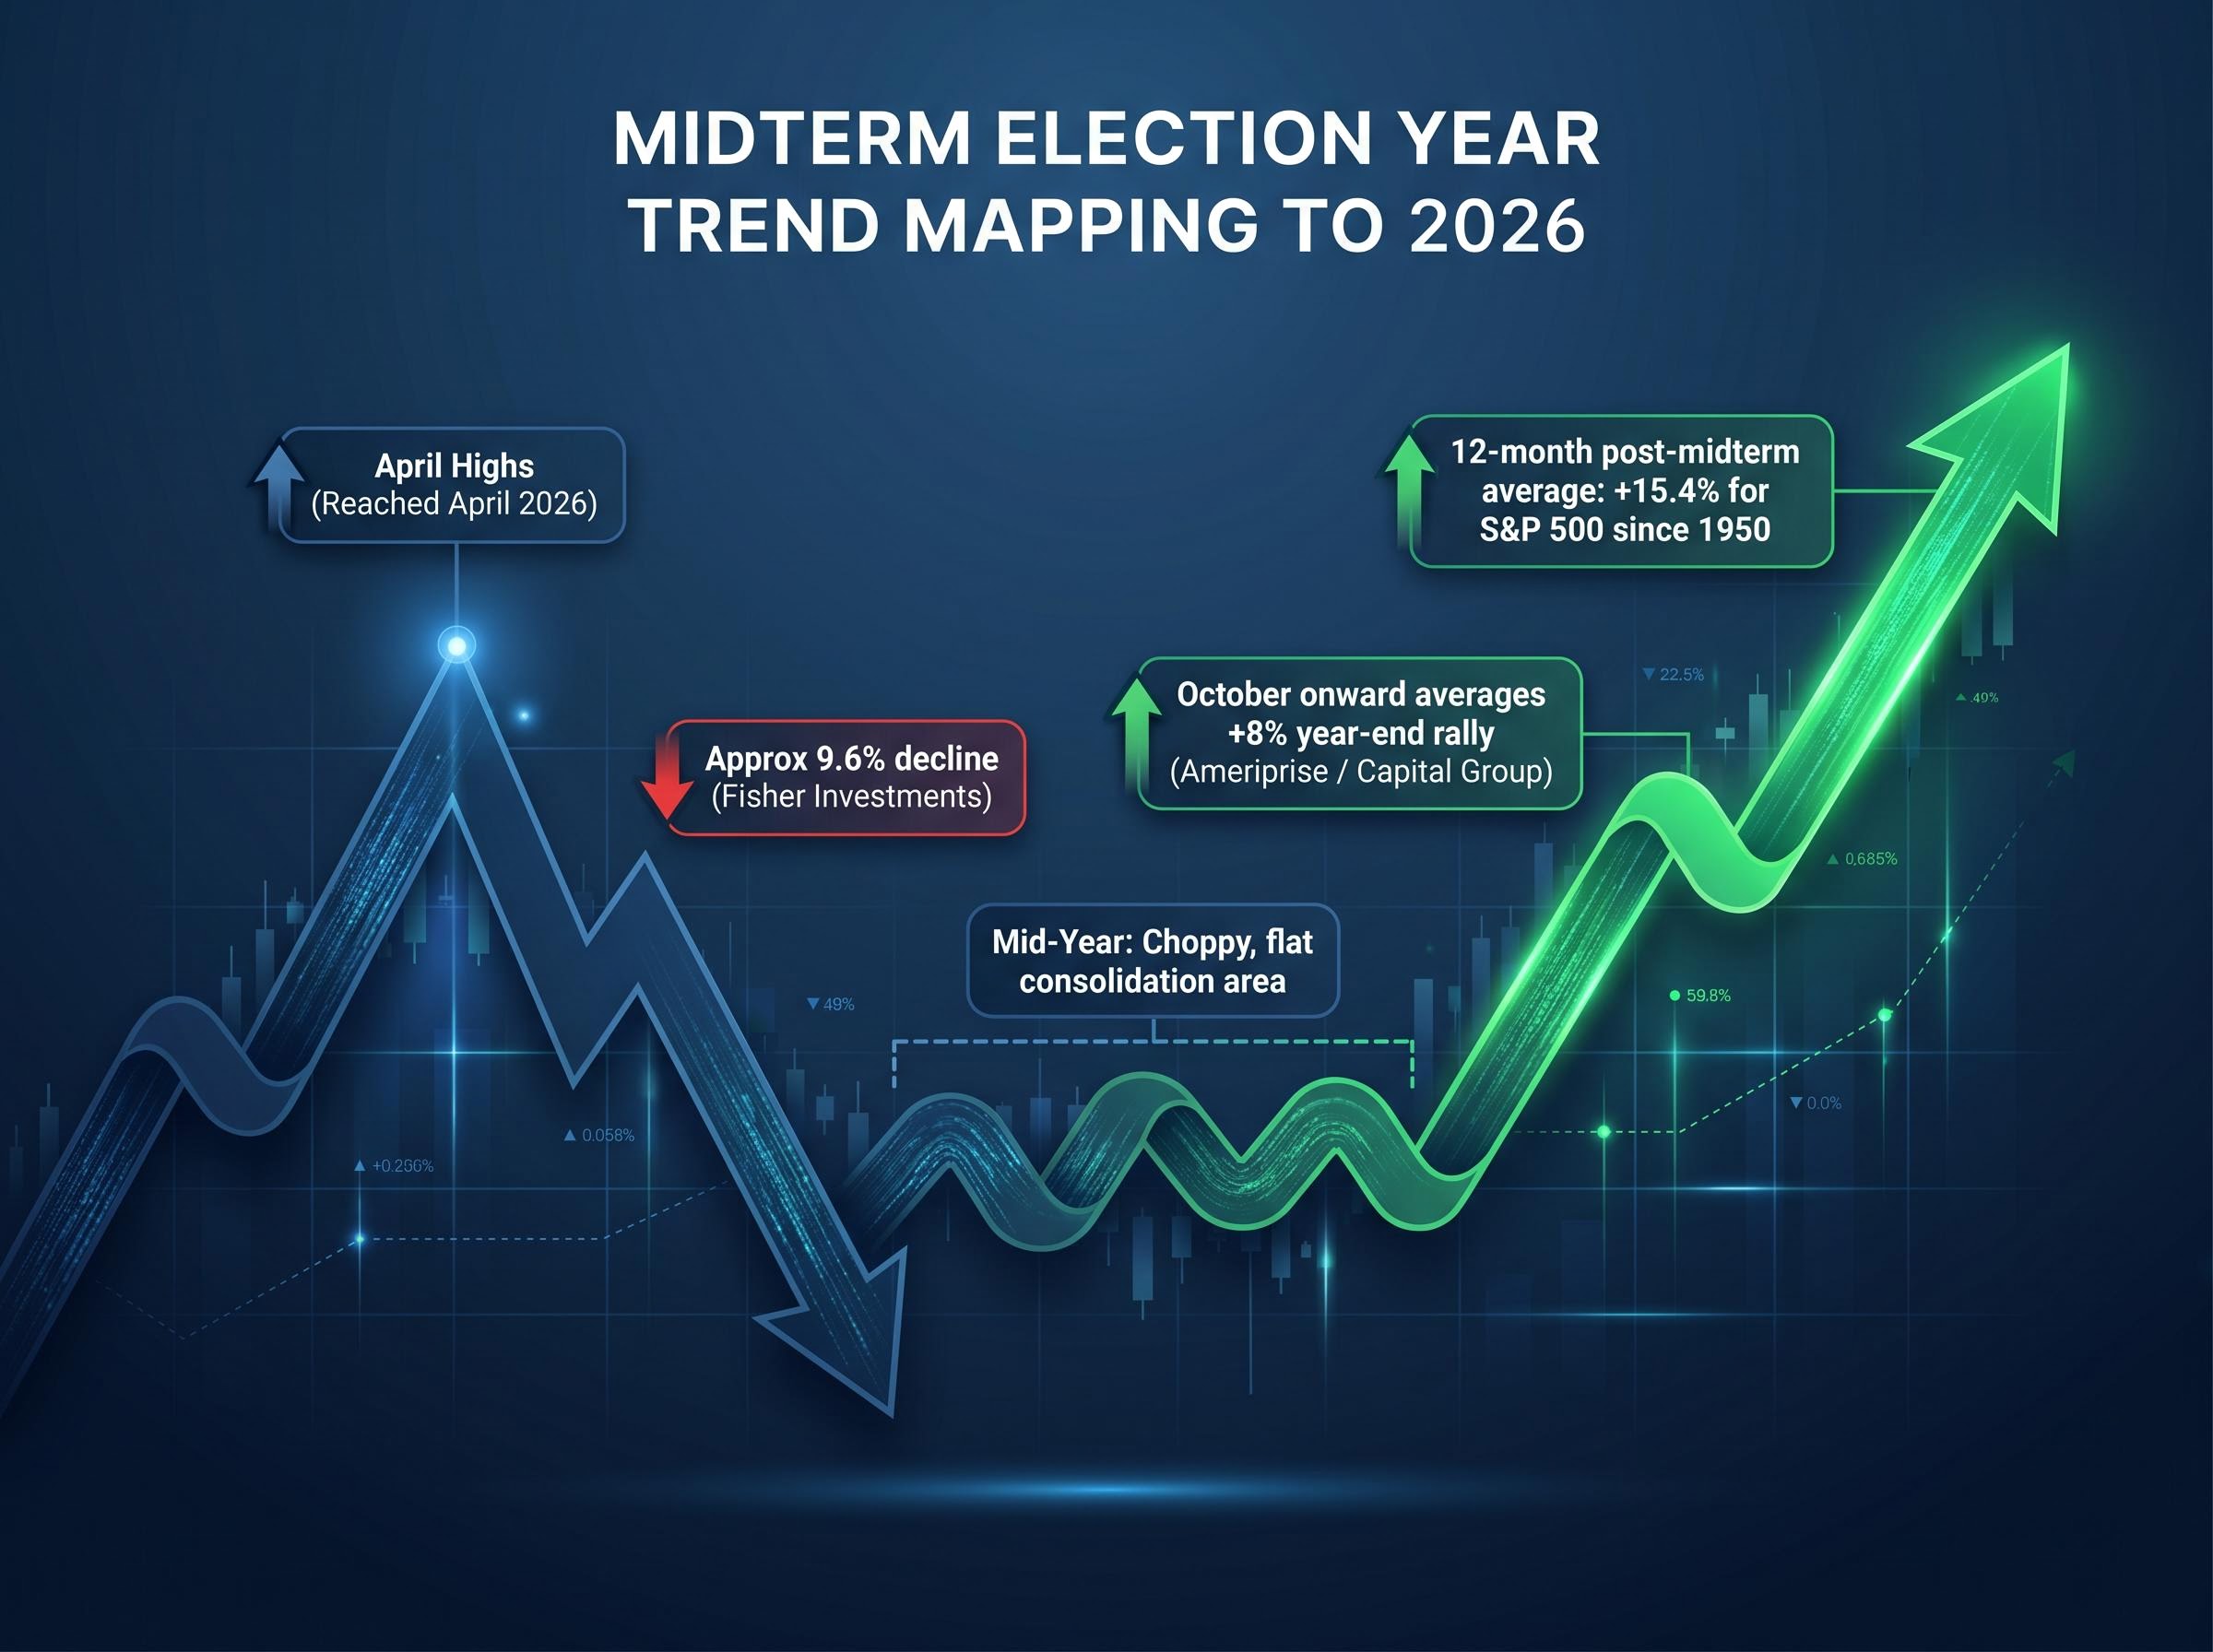
Midterm years typically peak around April, then compress through Q2 and Q3 as campaign rhetoric intensifies and policy uncertainty reaches its highest point. Ameriprise and Capital Group data show the year-end rally from October onward averaging approximately +8%, a sharp reversal from the muted-to-negative first half.
2026 is tracking this pattern. Markets sold off into April, consistent with what Finer Market Points identifies as the “B-cycle inversion” analog, where early-year weakness precedes a second-half recovery. The rhythm is familiar. The question is whether the mechanism underneath it remains intact.
When big ASX news breaks, our subscribers know first
Why uncertainty prices itself in, and why resolution reprices it back out
The midterm pattern is not a statistical curiosity. It has a cause. In the first two years of a presidential term, policy is front-loaded. Administrations push their most ambitious legislative agenda early, creating concentrated risk for specific sectors and industries. By year two, the legislative pipeline is at its most uncertain: bills are in motion, regulatory frameworks are shifting, and campaign season amplifies every policy threat.
Three specific factors drive H1 compression in midterm years:
- Policy uncertainty: Active legislative agendas create sector-specific risk that is difficult to hedge until outcomes are known.
- Negative campaigning: Campaign rhetoric amplifies worst-case policy scenarios, particularly for industries targeted by opposing candidates.
- Unclear sector-specific legislative risk: Investors cannot price outcomes when the legislative direction for healthcare, energy, technology, or financial regulation remains genuinely unresolved.
Capital Group has observed that elections amplify negatives in the short term precisely through this mechanism: negative campaigning and unclear sector-specific policies compress valuations before results are known.
The resolution effect is subtler than it first appears. It is not primarily about which party wins. It is about the removal of uncertainty itself.
Ameriprise Financial reports that post-midterm 12-month gains have averaged +15.4% since 1950, a figure the firm attributes to reduced uncertainty broadly repricing risk once election results are known.
Once voters decide, the range of possible outcomes narrows dramatically. Markets do not need good news; they need clarity. The repricing from “we don’t know what will happen” to “now we know” has historically been worth double-digit returns over the following year.
The gridlock premium: why a divided government has historically been stocks’ best friend
The post-midterm rally has a second structural support beyond uncertainty removal: the gridlock premium. When midterm elections produce a divided government, as they do in nearly every cycle, the legislative capacity of the executive branch is constrained. The risk of disruptive new policy affecting corporate profitability or sector economics falls, and the political risk premium embedded in equity prices compresses.
Fisher Investments historical analysis identifies only two instances in modern records where the president’s party did not lose congressional seats during midterm elections. The near-universality of this outcome means that gridlock is not a hope; it is a base case.
The institutional debate centres on mechanism rather than outcome. Ameriprise ties the bullish effect more to uncertainty removal than to gridlock specifically, while the broader pattern is consistent with both mechanisms operating simultaneously. Second-term presidents often become lame ducks post-midterm, further limiting policy reach and compressing the legislative risk premium.
The following table summarises how different gridlock scenarios have historically corresponded with equity market responses:
| Scenario | Legislative Outcome | Historical Equity Response |
|---|---|---|
| Full gridlock | Divided Congress (opposing party controls at least one chamber) | Strongest post-midterm returns; legislative risk premium falls sharply |
| Partial gridlock | One chamber flips; slim majority limits legislative ambition | Above-average post-midterm returns; reduced but not eliminated policy risk |
| No change | President’s party holds both chambers | Historically rare (two instances); returns vary with broader macro conditions |
The gridlock premium is the structural reason the “Midterm Miracle” is not simply a statistical artefact. It has a coherent economic rationale, which gives investors a framework for assessing when the pattern is more or less likely to hold.
What history actually shows, including the exceptions
The post-midterm rally is one of the most consistent seasonal patterns in US equity history. Since 1950, the S&P 500 has averaged +15.4% in the 12 months following midterm elections. Midterm years themselves deliver below-average returns and higher volatility, according to Ameriprise, but the snap-back is persistent enough to have earned its own label.
That consistency, however, is not universality. Multiple sources characterise the midterm pattern as “a pattern, not a prediction,” and the distinction matters.
When the pattern breaks down
The conditions that have historically overridden midterm cycle effects share a common feature: they are macro shocks large enough to dwarf the political cycle as a market driver. The types of conditions include:
- Major financial system shocks: Systemic banking crises or credit market seizures that force deleveraging regardless of political outcomes.
- Severe recessions already underway: When the economy is contracting sharply at the time of the midterm, the post-election clarity effect is insufficient to offset fundamental deterioration.
- Sustained inflationary regimes forcing mid-cycle Fed action: When the Federal Reserve is actively tightening into a midterm cycle, monetary policy becomes the dominant driver and the political cycle fades as a signal.
Recession probability estimates from Goldman Sachs at 30%, JPMorgan at 35%, and Moody’s Analytics at 48.6% sit at levels the current index price does not appear to fully reflect, and a recessionary outcome would represent exactly the kind of fundamental deterioration that has historically overridden midterm cycle tailwinds regardless of political clarity.
The unverified claim that the Dow gains 46.3% from midterm low to the next year’s peak circulates in secondary blog sources but has not been independently confirmed by institutional research. It should be treated with appropriate scepticism.
2026‘s unique conditions, including elevated tariff uncertainty, geopolitical factors, and inflation dynamics, are widely cited by multiple strategists as potential pattern overrides. Per most institutional views, none of these conditions currently dominates the outlook to the degree that prior overrides have, though they remain risks to monitor.
The 2026 setup: how current conditions map onto the historical template
The gap between historical abstraction and present-tense application is where pattern analysis earns or forfeits its value. In 2026, the mapping between current conditions and the midterm template is closer than sceptics might expect.
US equity markets declined approximately 9.6% in the recent downturn, falling just short of the conventional 10% correction threshold, according to Fisher Investments. New all-time highs were reached as recently as April 2026. The sequence, a first-half correction followed by a recovery attempt, aligns with the historical midterm template described earlier.
The political outlook reinforces the structural setup. The Cook Political Report projects a closely contested House as of May 2026: approximately 207 Democrat seats, 209 Republican seats, and 19 toss-up districts. Democrats hold a viable path to flipping at least one chamber, consistent with the historical precedent that favours post-midterm gridlock.
| Data Point | Historical Midterm Template | 2026 Actual Conditions |
|---|---|---|
| H1 market behaviour | Muted to negative; peaks around April | Selloff into April; recovery attempt underway |
| Correction depth | Deeper intra-year pullbacks vs non-election years | Approximately 9.6% decline (near correction threshold) |
| Political control outlook | President’s party loses seats in nearly every cycle | Cook projects 19 toss-up House seats; genuine flip possibility |
| Post-election period | October onward historically strongest window (+8% average) | Q4 2026 identified by multiple cycle analysts as favourable |
Ameriprise views H1 dips as buying opportunities barring major economic shifts. Fisher Investments and MarketMinder note global GDP growth projected at approximately 3% for 2026, with money supply growth described as positive but not at inflationary levels. The macro backdrop, while not without risk, does not currently exhibit the override conditions that have derailed midterm patterns in the past.
Market breadth dynamics complicate this picture further: in April 2026, only 23% of S&P 500 constituents outperformed the benchmark despite a 98th-percentile monthly return, meaning the index recovery that appears to confirm the midterm template may be narrower and more fragile than the headline number suggests.
The case for patience: what the “Midterm Miracle” means for investors right now
The analytical thread running through this article points toward a specific investor implication. The historical pattern, the structural mechanism, and the 2026 setup collectively support a posture of holding through H1 volatility rather than de-risking ahead of midterms. Ameriprise recommends buying H1 dips for an anticipated H2 rally. Capital Group advises maintaining long-term equity exposure through volatility rather than repositioning defensively around elections. Fisher Investments anticipates higher equity prices on a 12-month forward basis as of May 2026.
Three posture points emerge from the analysis:
- Hold through H1 volatility. The historical record strongly suggests that de-risking during midterm-year weakness has been a consistently costly behavioural error.
- Watch the October election result window. The uncertainty-removal repricing effect has historically concentrated in Q4, making November 2026 a potential inflection point worth monitoring.
- Reassess if macro override conditions emerge. Sustained tariff escalation, an inflation resurgence forcing aggressive Fed action, or a systemic financial shock would represent the conditions that have historically overridden the midterm pattern.
Three Creeks Capital’s Todd Gourno cautions that corrections pre-midterms are real and portfolio risk management still matters. Over-reliance on historical patterns is its own risk.
Capital Group’s Chris Buchbinder adds a further layer: elections are one factor among several, with earnings, interest rates, and tariffs carrying equal or greater long-term weight. The midterm cycle framework is most useful when combined with an assessment of macro conditions rather than applied in isolation.
History rhymes, but it does not guarantee: the limits of cycle-based investing
The 2026 midterm cycle carries specific conditions that multiple strategists cite as the most credible potential overrides of the historical pattern:
- Sustained tariff escalation affecting corporate earnings broadly enough to overwhelm the uncertainty-removal tailwind.
- An inflation resurgence forcing aggressive Federal Reserve tightening mid-cycle, overriding the political calendar as the dominant market driver.
- A geopolitical shock that structurally disrupts the economic outlook beyond what election clarity can offset.
The Fed’s frozen rate policy at 3.50%-3.75% through five consecutive holds, combined with core PCE rising to 3.2% and JPMorgan raising its stagflation probability to 35%, represents the most credible macro condition that has historically overridden midterm cycle effects: a central bank forced to tighten, or refuse to ease, directly into the political calendar.
Carver Financial and Mackenzie Investments characterise 2026 as a structurally weak second presidential year, attributing volatility to fiscal uncertainty as well as midterm dynamics. Capital Group emphasises that long-term returns are driven by company fundamentals, not political outcomes. Fisher Investments acknowledges the current bull market is in its fourth year as of 2026, a duration that warrants heightened vigilance for potential bear market conditions.
There is also a distinction worth preserving. The uncertainty-removal effect can operate regardless of election outcome; all that is required is that the election happens and results are known. The gridlock premium requires an actual divided government. Only one of these mechanisms is guaranteed to materialise.
Using history as a prior, not a prediction
Historical cycle analysis adjusts probabilities. It does not eliminate uncertainty. The midterm pattern’s value is not in telling investors what will happen in Q4 2026 but in helping them resist the behavioural errors, panic selling and defensive over-rotation, that have been most costly in the first half of midterm years.
The pattern tilts odds. It does not set them.
The Midterm Miracle will not ring a bell, but the pattern is worth hearing
The “Midterm Miracle” is not market folklore. It is a structurally grounded pattern with a coherent mechanism, a strong historical record, and a 2026 setup that maps closely onto prior cycles. The same conditions that have driven post-midterm rallies in nearly every cycle since 1950, a sitting president’s party losing congressional seats, legislative gridlock forming, and uncertainty lifting, are plausibly assembling again.
The precise timing and magnitude of any Q4 2026 rally will depend on factors that cannot be known in advance: the depth of any further H1 correction, the specific election outcome, and the trajectory of tariff, inflation, and rate dynamics through the summer. Investors who understand the structural tailwind are better equipped to hold through that noise than those who do not.
Investors ready to move from cycle analysis to portfolio construction will find our comprehensive walkthrough of portfolio positioning through political cycles, which covers gold allocation targets from Goldman Sachs and BlackRock, sector exposure review, and the rebalancing discipline that preserves returns across geopolitical and electoral volatility events.
As Q3 2026 approaches and the election outlook firms up, the framework described here offers a lens for revisiting portfolio positioning, not as a guarantee of returns, but as a historically grounded reason for patience.
This article is for informational purposes only and should not be considered financial advice. Investors should conduct their own research and consult with financial professionals before making investment decisions. Past performance does not guarantee future results. Financial projections are subject to market conditions and various risk factors.