
Why an 11% Yield Fund Left Investors $20,000 Behind
15 hrs ago
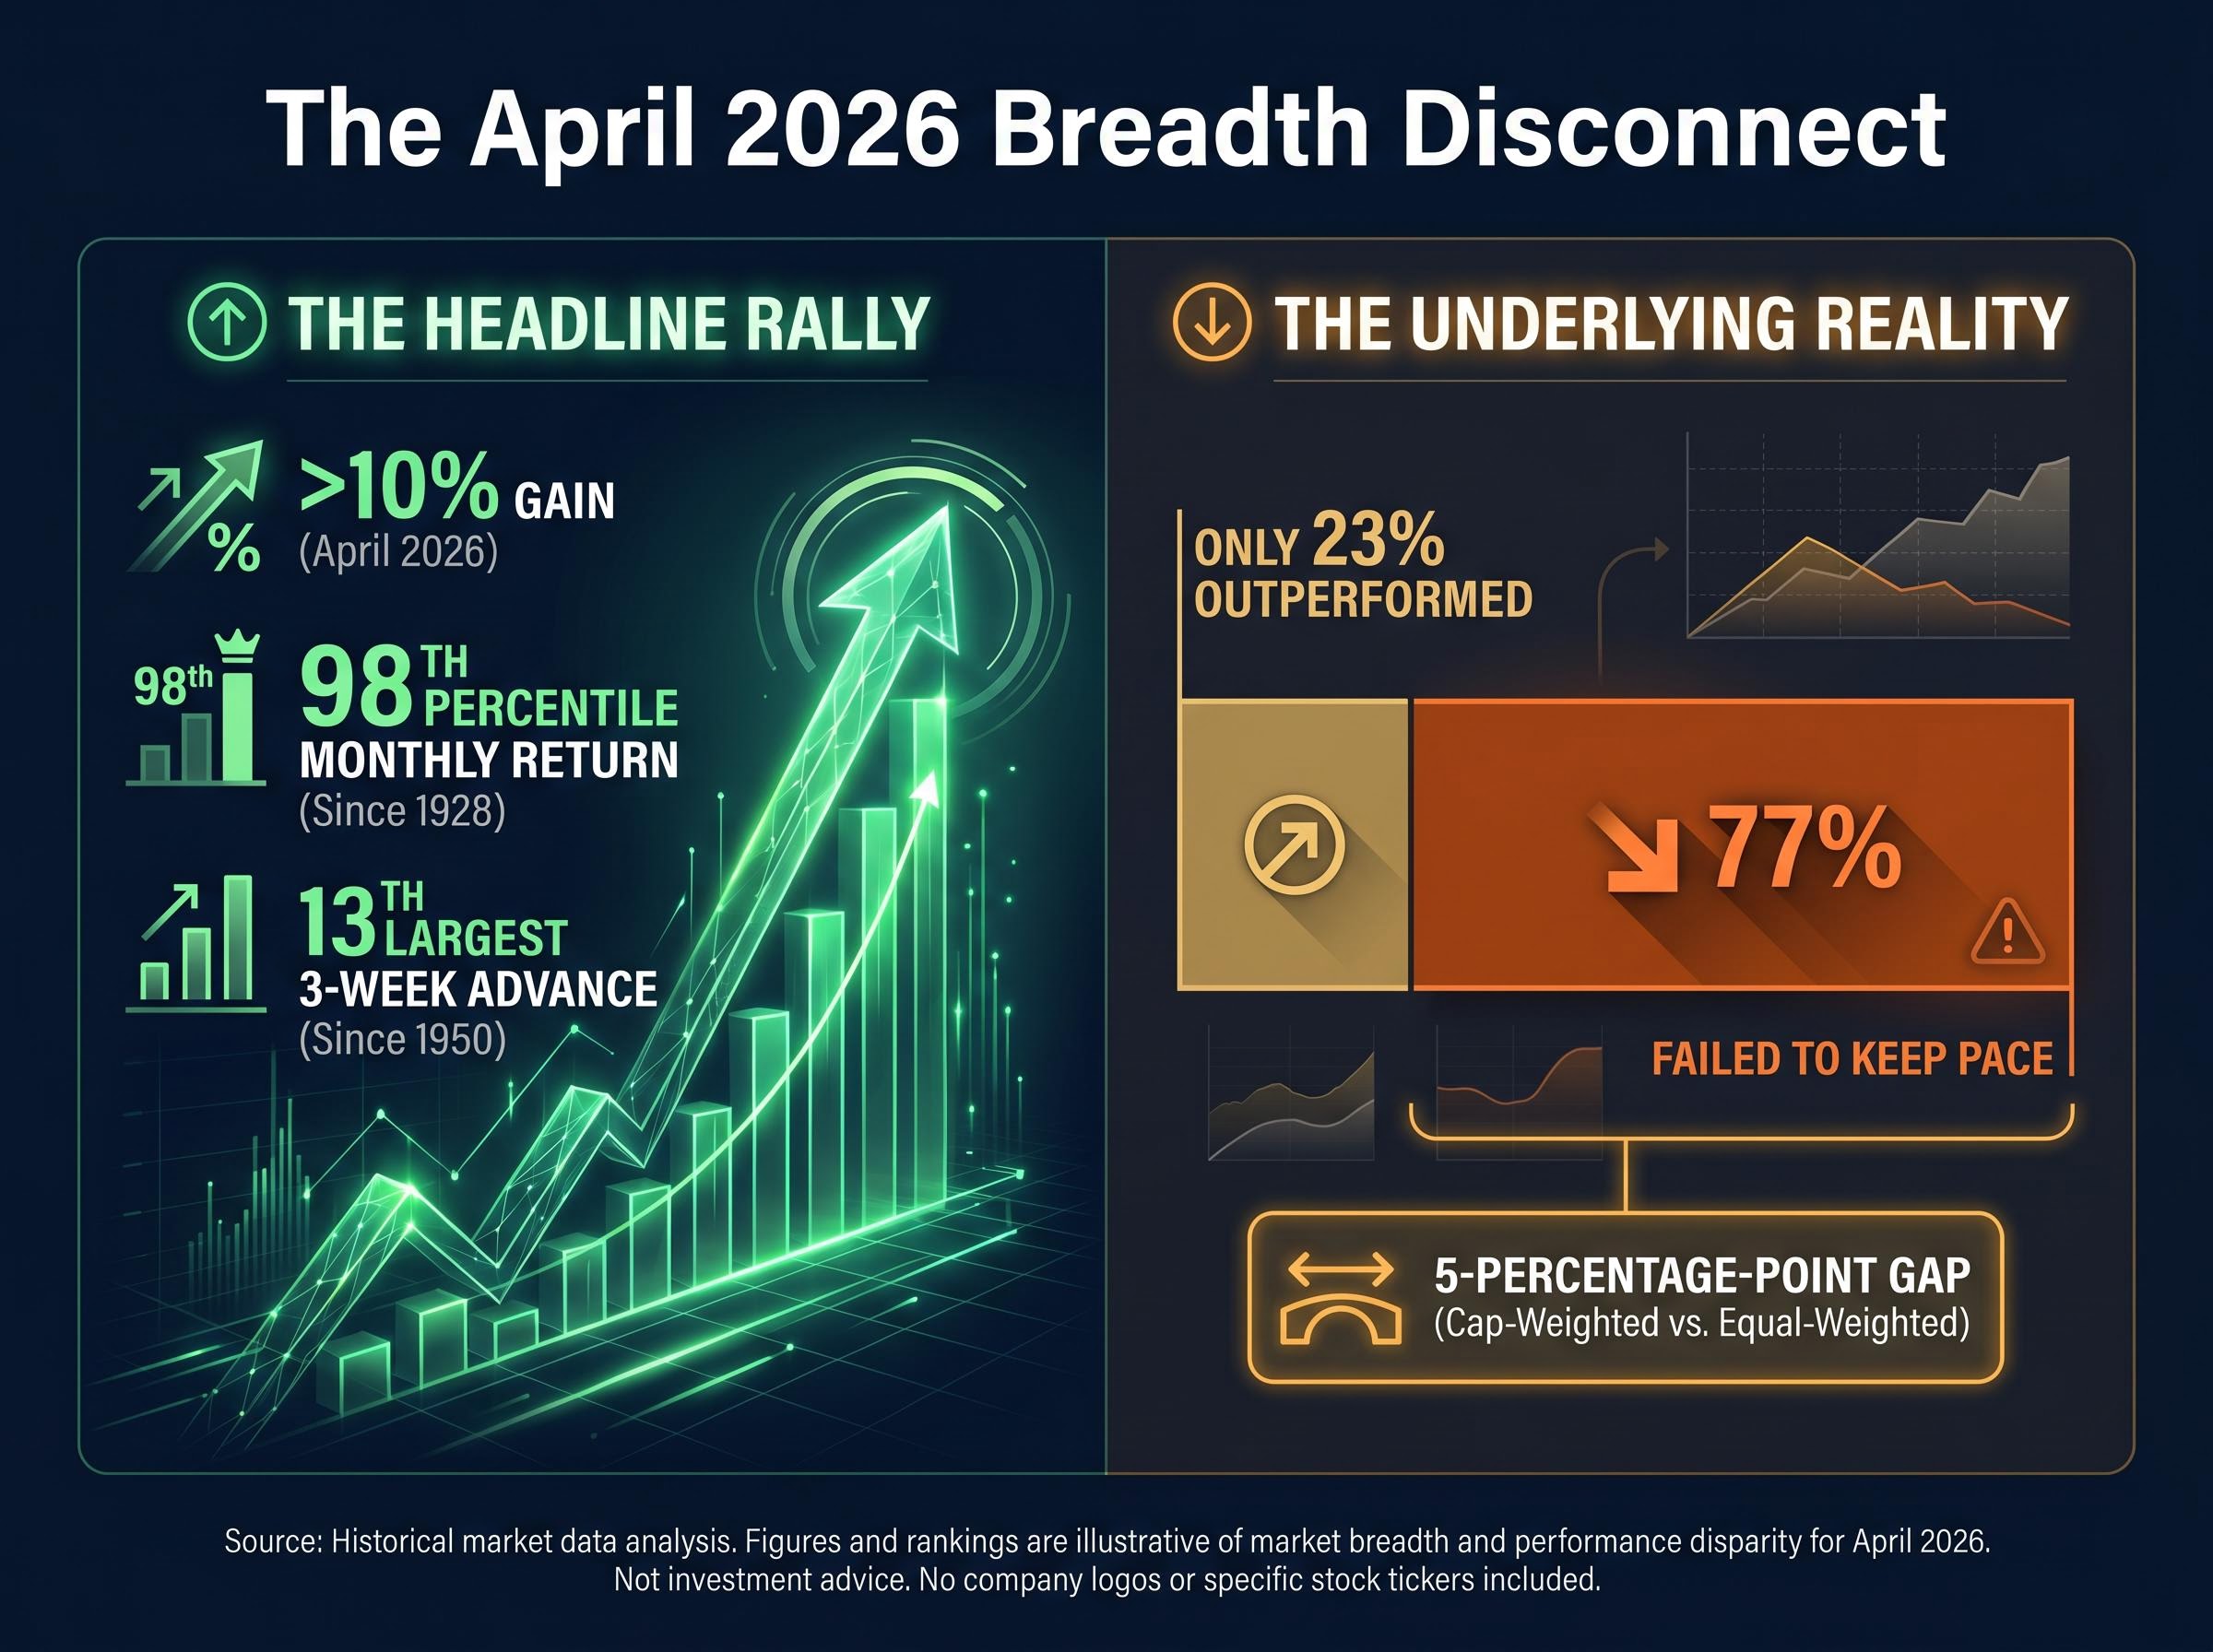
The S&P 500 gained more than 10% in April 2026, a monthly return that ranks at the 98th percentile of all monthly performances since 1928. It was, by almost any historical measure, a remarkable month. Yet only 23% of the index’s own constituents managed to keep pace with the benchmark they compose. That gap, between a headline number that belongs in the record books and an underlying participation rate that belongs in a warning file, is the tension at the centre of the current outlook for U.S. equities. What follows is an examination of what the April rally actually was, why its breadth reading carries more weight than a footnote, what Bank of America’s contrarian sentiment gauge is signalling, and how to think about positioning when the index sits at record highs on uneven foundations.
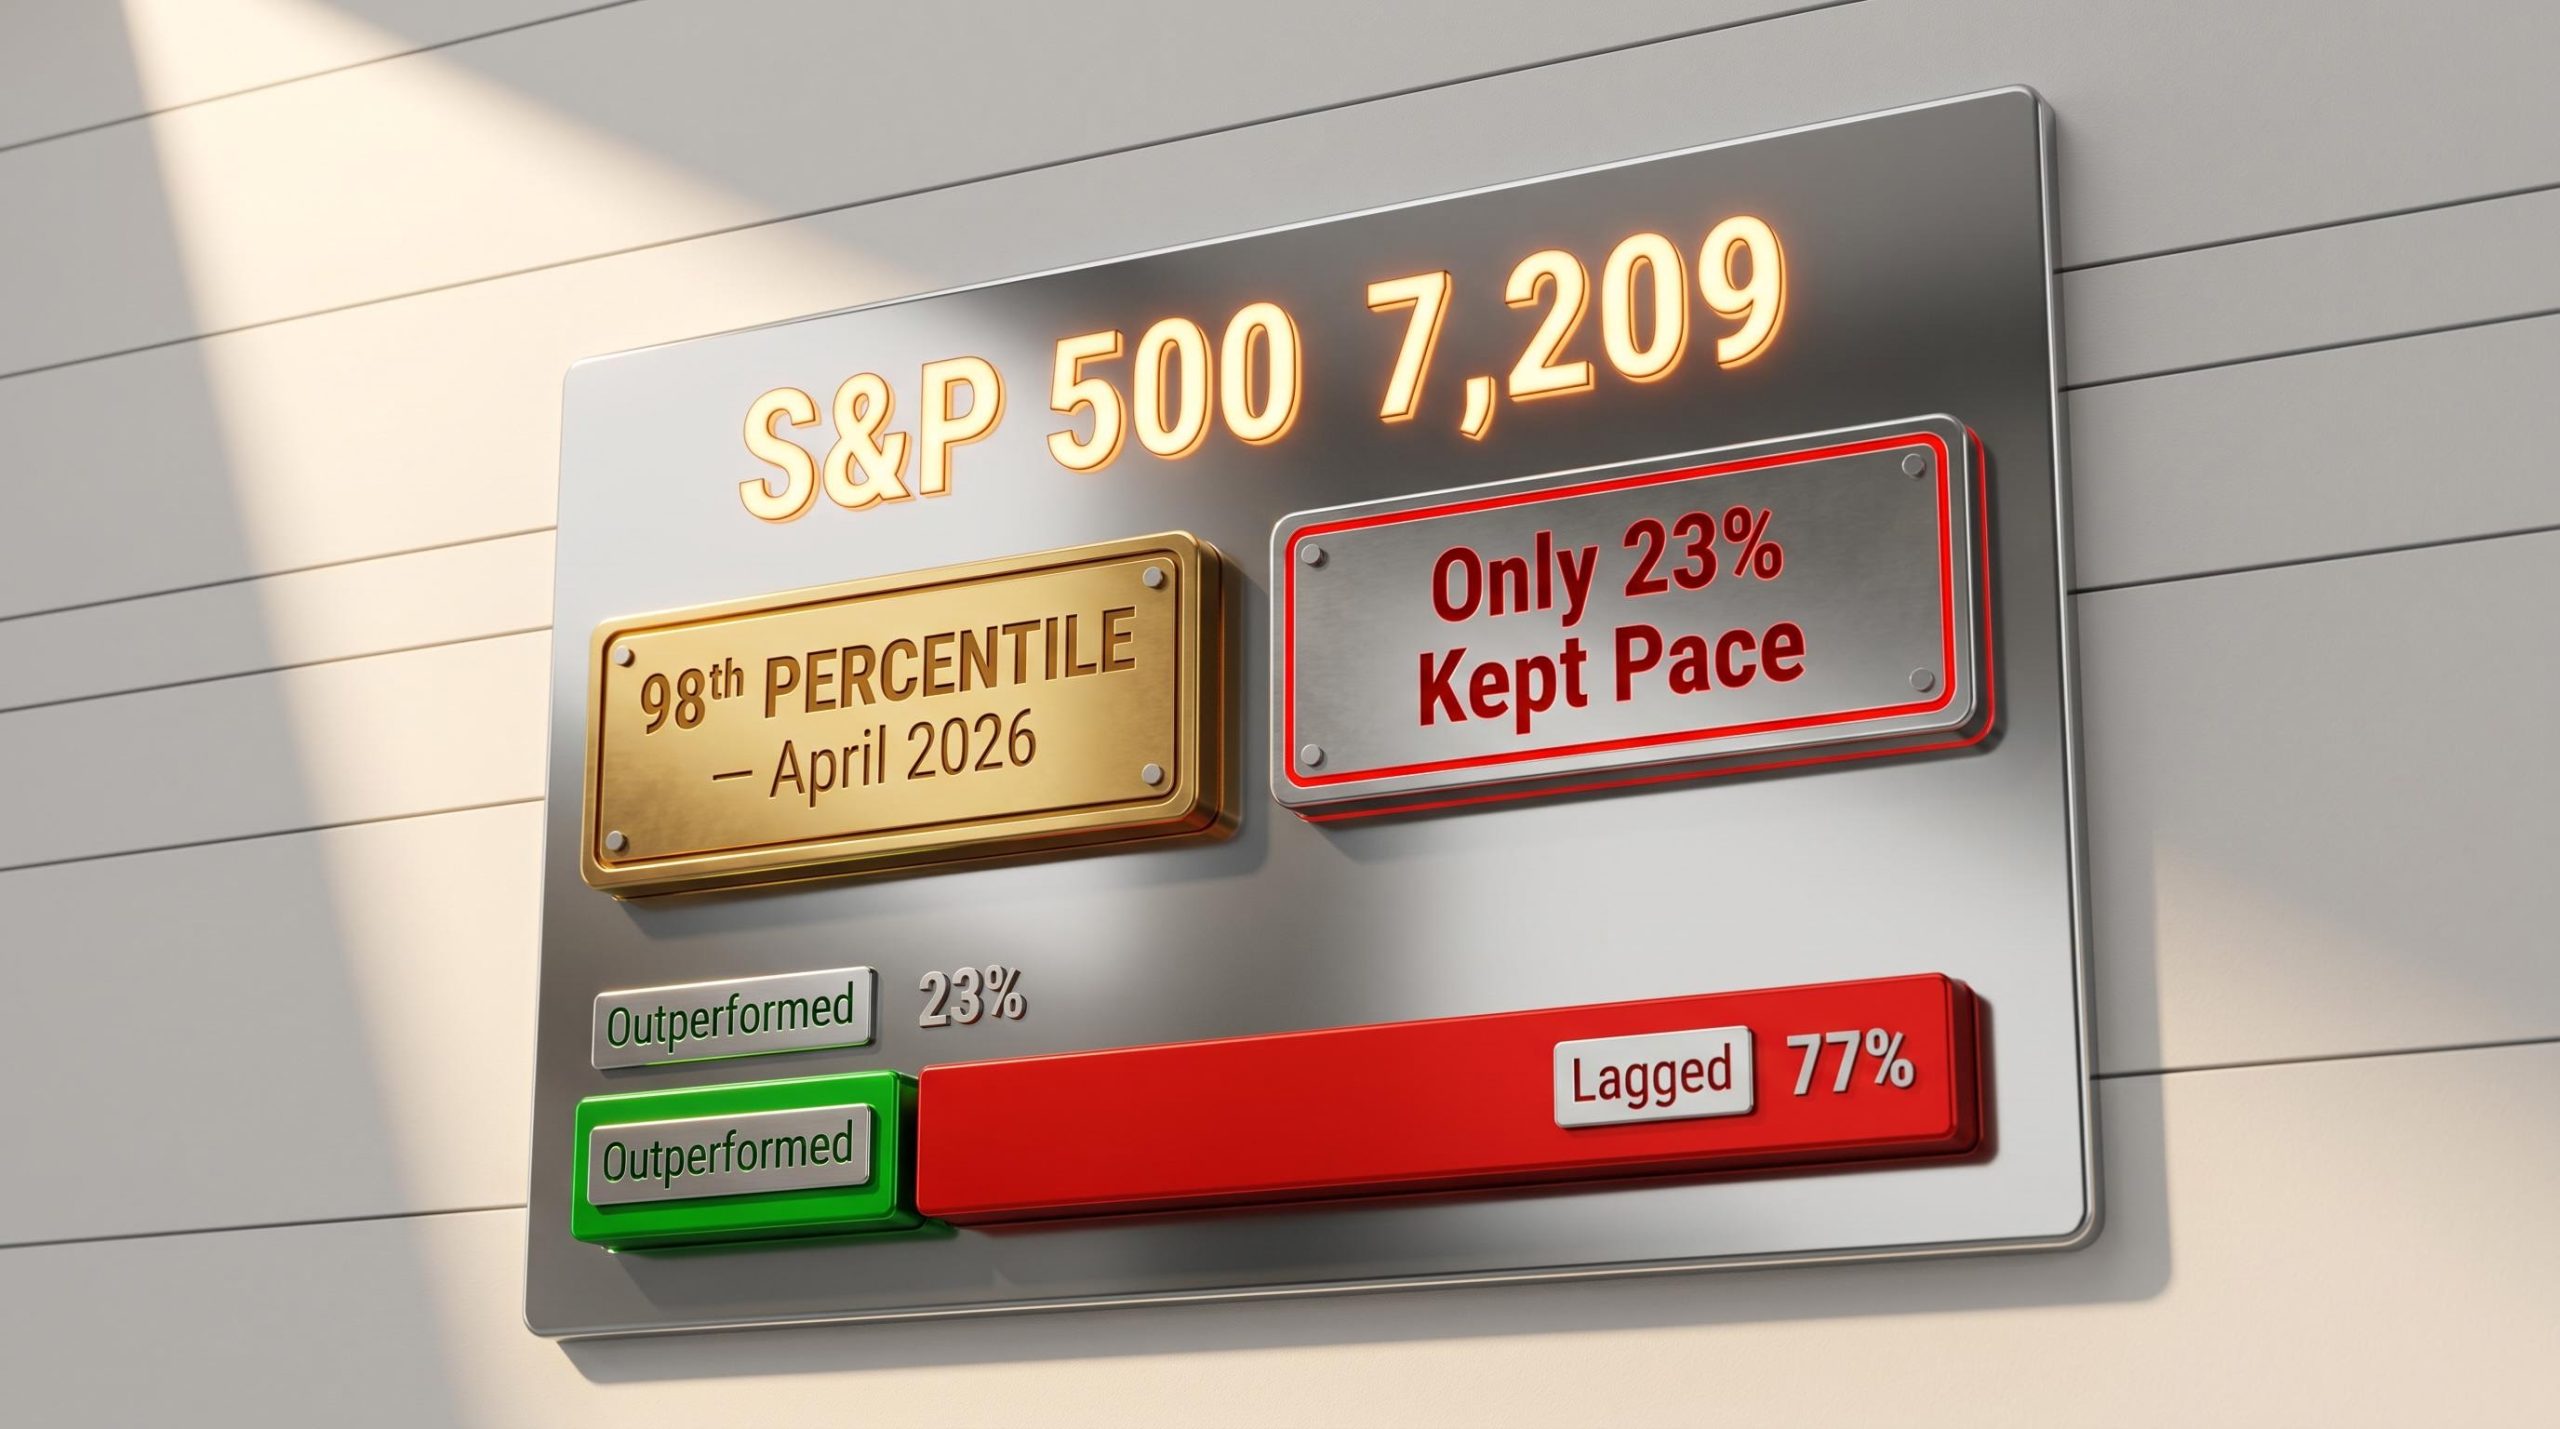
The raw numbers deserve their moment. The S&P 500’s April advance over approximately three weeks ranked as the 13th largest three-week gain for the index since 1950. The index closed at 7,165.08 on 24 April and pushed through to approximately 7,209 by 1 May 2026, extending a rally that began from a prior drawdown of roughly 9.8%. The snapback was unusually sharp relative to the decline that preceded it.
The April 2026 monthly return sat at the 98th percentile of all S&P 500 monthly returns since 1928, placing it among the most statistically rare single-month advances in nearly a century of market history.
Then the equal-weight data arrived. The equal-weighted S&P 500, which gives every constituent the same influence regardless of market capitalisation, trailed the cap-weighted benchmark by 5 percentage points over the same period. Key benchmarks from the month:
That 5-point gap is not a statistical quirk. It is a structural signal that the headline gain and the typical stock’s experience were two different events.
The figure that reframes the entire month is this: only 23% of S&P 500 constituents outperformed the benchmark in April 2026, according to Bank of America strategists. That means 77% of the index’s stocks failed to keep pace with the index they collectively form.
The reading is the fourth-lowest monthly breadth figure in BofA’s dataset, which extends back to 1986. As of 30 April 2026, 54.87% of S&P 500 stocks traded above their 50-day moving average, and 57.05% sat above their 200-day moving average. Those figures describe a market where slightly more than half the index is in a short-term uptrend, a far cry from the broad participation that typically underpins durable advances.
Dow Theory divergence signals offered a parallel read on market health during the same period, with the transportation average reaching a record peak on 21 April that the industrial average failed to confirm, a non-confirmation pattern that technicians have historically treated as a warning about the sustainability of an advance even when headline indices are rising.
CFA breadth indicator definitions treat the proportion of constituents above key moving averages as a measure of trend health, not just direction, which is why April’s 54.87% reading above the 50-day average and 57.05% above the 200-day average describe a market in a shallow, unconfirmed uptrend rather than a broad and durable advance.
The primary concentration cohort driving the headline gain was AI and semiconductor stocks, a narrow group of mega-cap names whose weighting in the cap-weighted index allowed them to pull the benchmark higher while the majority of constituents lagged.
| Period | Constituent Outperformance Rate | Market Outcome | Key Driver |
|---|---|---|---|
| April 2026 | 23% (4th lowest since 1986) | Rally ongoing; sustainability in question | AI / semiconductor concentration |
| 2023 | Narrow (fewer than 170 stocks outperformed) | Correction concerns materialised; broad selloff did not follow immediately | Mega-cap tech leadership |
| 1998 | Narrow (fewer than 170 stocks outperformed) | Sustainability concerns raised; outcomes varied | Large-cap growth dominance |
The 1998 and 2023 parallels are instructive but not deterministic. In both cases, narrow-breadth rallies of similar magnitude raised sustainability concerns among strategists and technicians. Corrections followed in some instances, but broad selloffs were not a guaranteed outcome in every episode. The pattern does not predict a crash. It does, however, shift the risk profile meaningfully: when returns are concentrated in a small cohort, any rotation away from that cohort can erase the headline gains faster than a broad market would allow.
The S&P 500 is a cap-weighted index, and that construction has consequences that become visible in months like April 2026. Understanding the mechanics explains why a 10%-plus monthly gain and a fragile market can coexist.
Charlie Bilello has highlighted a growing divide between Wall Street index performance and Main Street consumer sentiment, with consumer confidence sitting at multi-year lows even as the index reached record highs. The disconnect underscores that record index levels do not necessarily reflect broad economic strength.
This is why the 23% breadth figure matters more than the 10%-plus return. A rally where fewer than one in four stocks kept pace with the benchmark is not a broad advance; it is a concentrated bet wearing an index’s clothing.
Investors wanting to examine the concentration mechanics in full detail will find our dedicated guide to S&P 500 concentration risk walks through how five mega-cap names came to control roughly 23% of the broad market index, why the cap-weighted and equal-weighted return gap reached its widest level in decades, and what passive investors can do to audit their actual exposure.
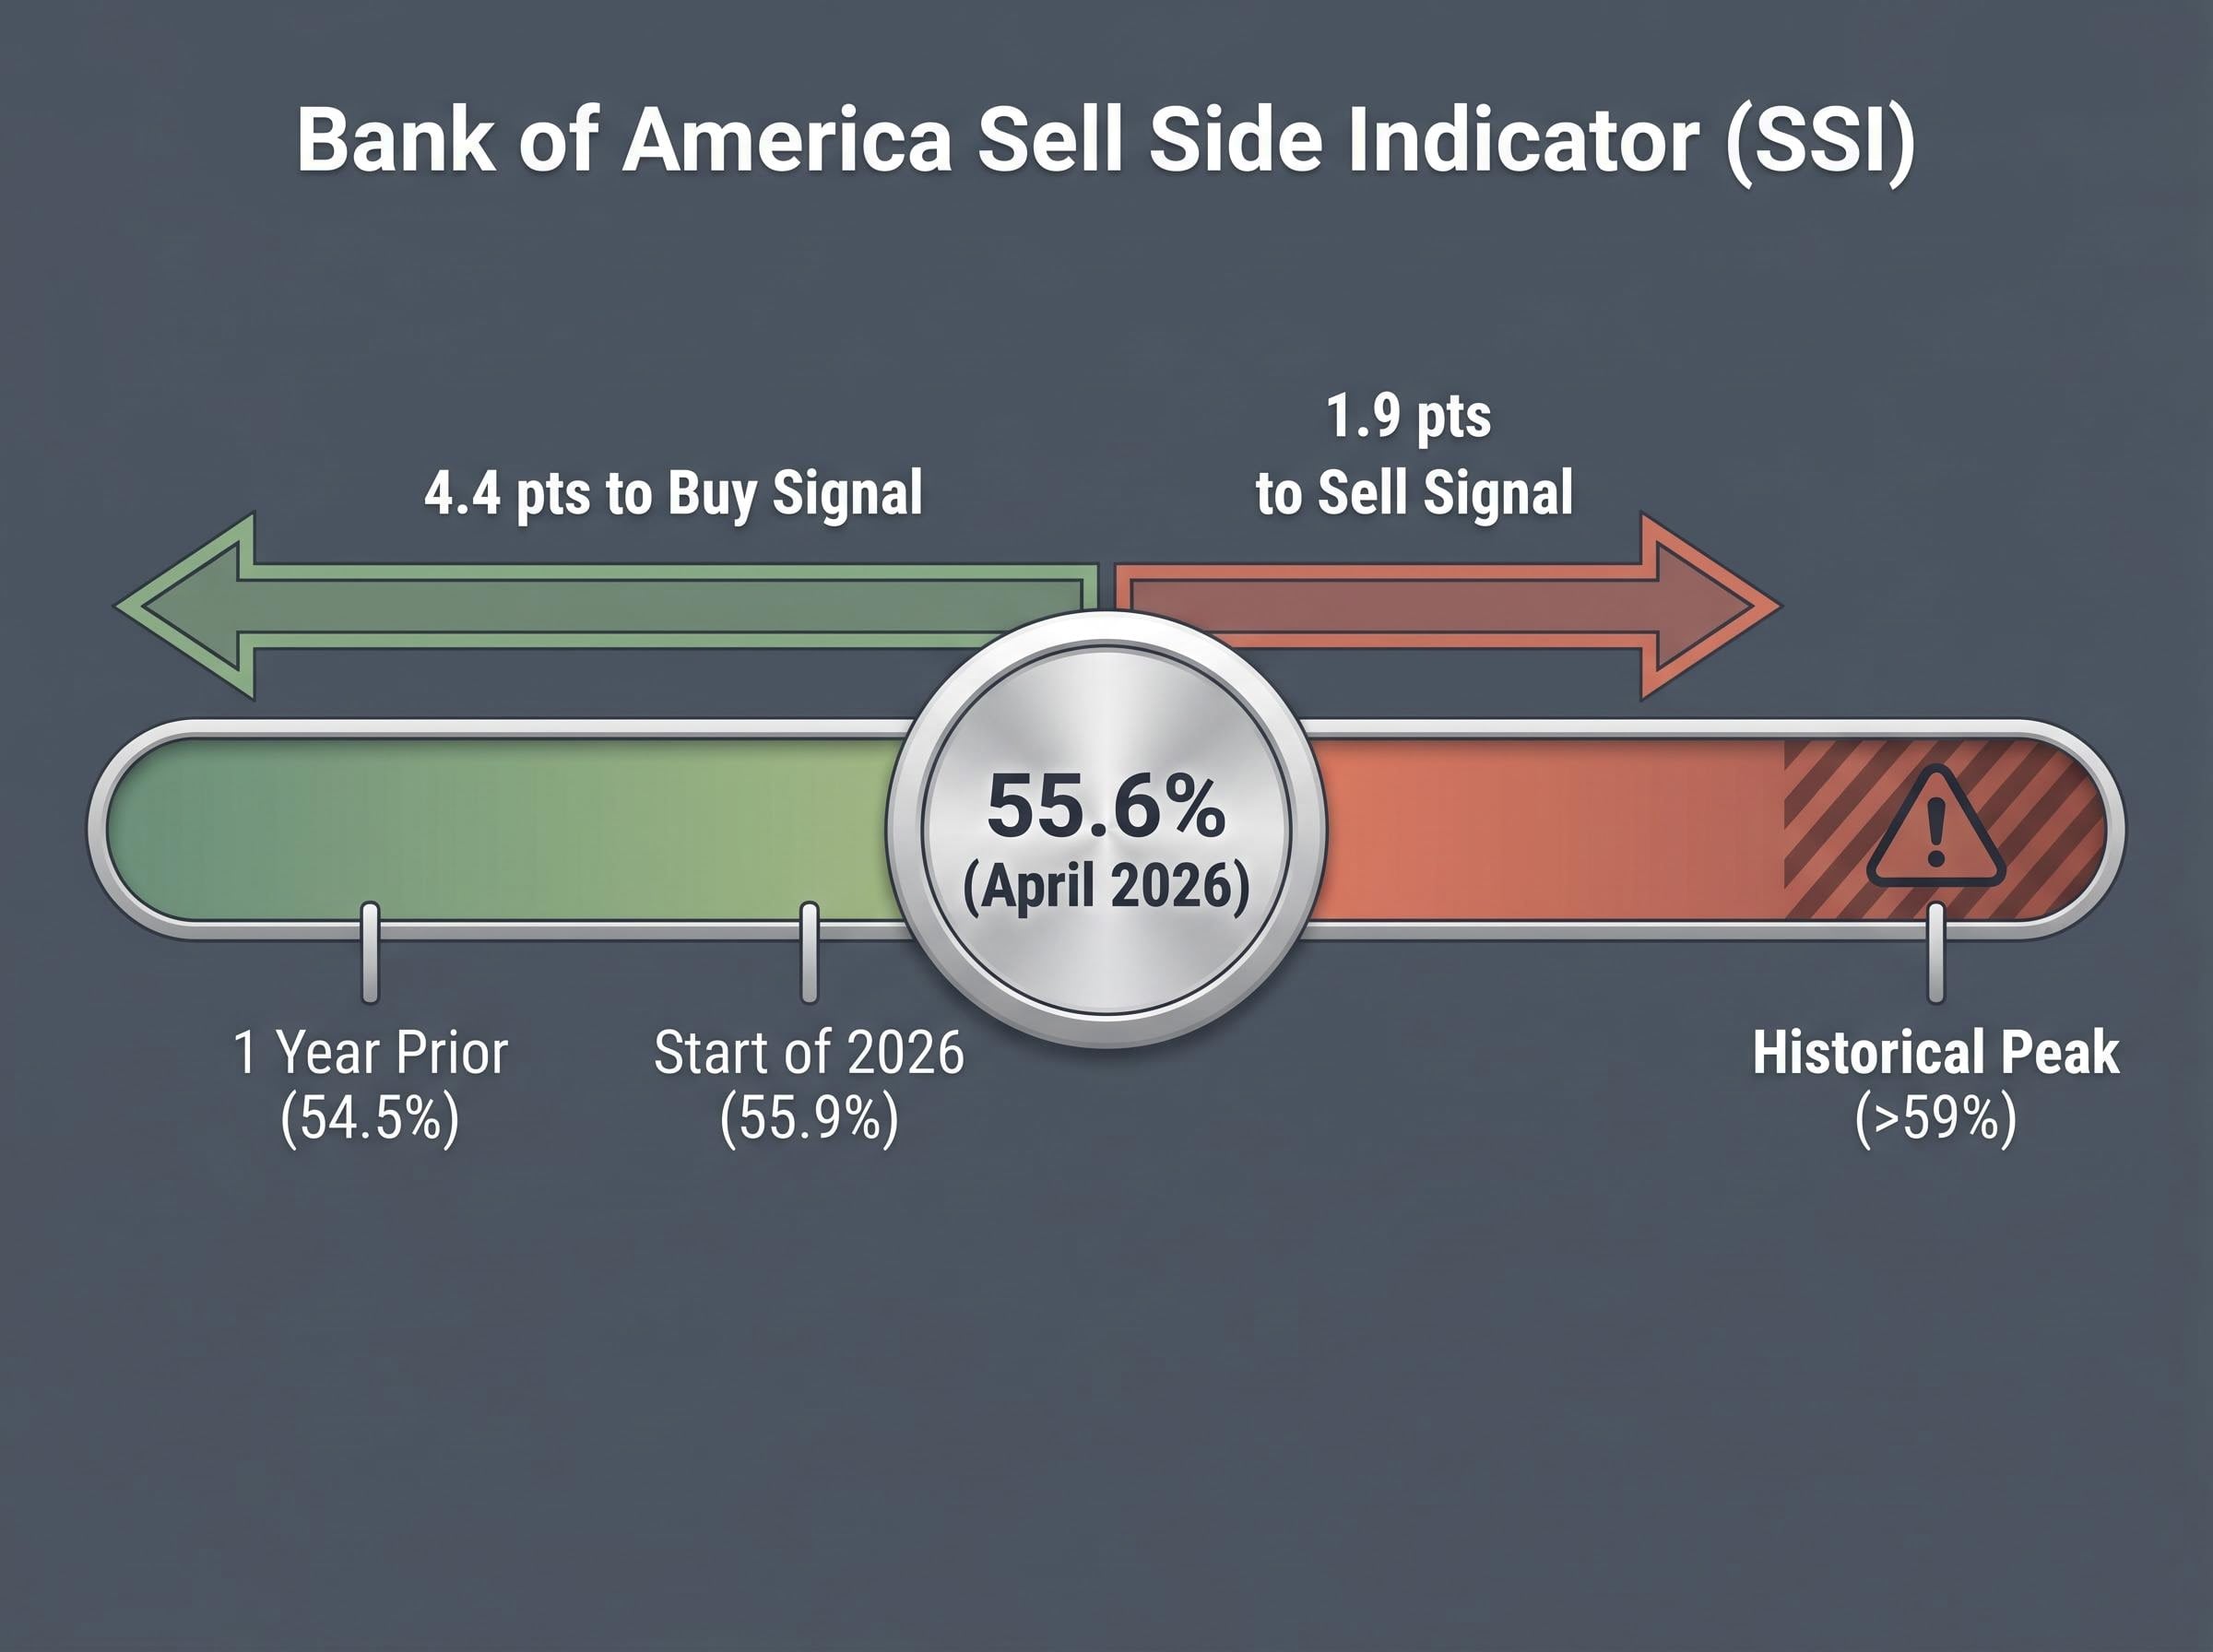
Bank of America’s Sell Side Indicator (SSI) measures the average recommended equity allocation among Wall Street strategists. It functions as a contrarian gauge: when strategists become uniformly bullish and allocations rise, the indicator approaches sell-signal territory. When allocations drop, it moves toward a buy signal.
In April 2026, the SSI held at 55.6%, unchanged from March. That reading was 30 basis points lower than at the start of 2026 and 1.1 percentage points higher than one year prior, when Liberation Day had pushed the reading down to 54.5%.
The SSI sat 1.9 percentage points from triggering a sell signal and 4.4 percentage points from generating a buy signal. That asymmetry, closer to caution than to opportunity, is the quietly important detail within the neutral headline.
| Time Point | SSI Reading | Significance |
|---|---|---|
| April 2026 | 55.6% | Unchanged from March; 1.9 pts from sell signal |
| Start of 2026 | 55.9% | 30 bps higher than April; slightly more bullish |
| One year prior (post-Liberation Day) | 54.5% | 1.1 pts lower; reflected heightened caution |
| Historical peak threshold | >59% | Prior market peaks coincided with readings above this level |
The complication is that BofA’s own SSI-implied 12-month return projection remains bullish: the current reading implies a projected S&P 500 price return of approximately 13% over the next 12 months, making it the most bullish input in BofA’s target calculation. The SSI is simultaneously closer to a sell signal than a buy signal and projecting double-digit forward returns. That is a genuinely mixed signal, and it is why this moment requires nuanced positioning rather than a binary call.
The rally earned its gains. Four identifiable catalysts powered the April advance: stabilisation following the fragile U.S.-Iran ceasefire, which had driven the S&P 500 down approximately 7.4% to 8% in March 2026; double-digit year-over-year earnings growth among S&P 500 constituents; confirmation of a new Federal Reserve chair, which reduced policy uncertainty; and continued AI-sector leadership, with institutional buying concentrated in semiconductor and artificial intelligence names.
Each of those catalysts, however, carries a corresponding vulnerability.
The connection between oil price thresholds for equity drawdowns and the ceasefire tail risk is more direct than the headline index level implies; Brent crude sat just $1.50 below the Goldman Sachs level that projects a 5-10% S&P 500 decline as of late April, and the national gasoline average of $4.25 per gallon placed the environment in a historically rare category where the index has declined an average of 11% over the following six months.
| Catalyst | Risk Factor | Current Status |
|---|---|---|
| U.S.-Iran ceasefire stabilisation | Ceasefire remains fragile; re-escalation could re-inject energy volatility | No major new escalation as of 1 May 2026; analysts monitoring as tail risk |
| Double-digit earnings growth | Concentrated in narrow cohort; breadth of earnings strength unclear | Confirmed as genuine fundamental driver |
| New Fed chair confirmation | Policy direction under new leadership remains untested | Reduced near-term uncertainty; medium-term path unknown |
| AI / semiconductor leadership | Worsening equity supply/demand dynamics flagged by BofA | BofA expects supply/demand conditions to pressure valuations |
Bank of America has flagged deteriorating equity supply and demand conditions as a concern likely to weigh on valuations going forward. Major bank year-end 2026 targets frame the current level: Goldman Sachs and JPMorgan both target 7,600, while BofA’s more cautious target of 7,100 has already been exceeded with the index at 7,209 as of 1 May.
The analytical layers examined above, breadth narrowness, SSI proximity asymmetry, and catalyst-risk pairing, converge on a single framing. The S&P 500 sits at record levels, but the composition of the rally that brought it here is structurally narrower than the headline implies. That does not make it a sell signal. It makes it a different kind of buy.
Bank of America’s recommendation in this environment is selective individual stock exposure rather than broad index-level buying at record highs. The logic is straightforward: if 77% of the index’s constituents failed to keep pace with the benchmark, buying the whole index is an implicit bet that the narrow cohort of winners will continue to carry the weight. Selective positioning allows investors to target breadth recovery candidates or the specific sectors driving earnings growth without taking on full index-level concentration risk.
Selective positioning in volatile markets, particularly toward high-margin, low-debt equities with strong pricing power in sectors such as semiconductors and power generation, has emerged as the dominant institutional framework for navigating an environment where elevated borrowing costs and energy-driven cost pressures compound the risks of holding broad index exposure at record valuations.
April 2026 produced one of the most statistically significant monthly rallies in the S&P 500’s history. It also produced the fourth-narrowest breadth reading in nearly four decades of data. Those two facts are not contradictory; they are the same story told from different angles.
Three observations stand out for investors evaluating the outlook from here. First, the 23% breadth reading is a risk signal, not a sell signal, but one that shifts the burden of proof onto bulls to demonstrate broadening participation. Second, the SSI’s 1.9-point proximity to a sell signal versus 4.4 points from a buy signal creates an asymmetry that warrants caution, even as the indicator’s own forward return projection remains bullish. Third, selective stock-level exposure appears more defensible than broad index buying at record highs when the rally’s foundations are this concentrated.
The data does not deliver a verdict. It delivers a set of questions worth asking before sizing the next position.
This article is for informational purposes only and should not be considered financial advice. Investors should conduct their own research and consult with financial professionals before making investment decisions. Past performance does not guarantee future results. Financial projections are subject to market conditions and various risk factors.
Market breadth measures how many stocks are participating in an index rally, not just the headline return. When breadth is narrow, as in April 2026 when only 23% of S&P 500 constituents outperformed the benchmark, it signals the advance is driven by a small group of stocks and may be less durable than the headline gain suggests.
The S&P 500 is a cap-weighted index, meaning the largest companies have a disproportionate influence on the headline return. In April 2026, a narrow cohort of AI and semiconductor mega-cap stocks drove the index higher while 77% of constituents failed to keep pace, creating a 5-percentage-point gap between the cap-weighted and equal-weighted index performance.
Bank of America's Sell Side Indicator (SSI) tracks the average recommended equity allocation among Wall Street strategists and functions as a contrarian gauge. In April 2026, it read 55.6%, sitting 1.9 percentage points from a sell signal and 4.4 percentage points from a buy signal, a positioning asymmetry that warrants caution even though the indicator's own forward return projection implies roughly 13% upside over 12 months.
Bank of America recommends selective individual stock exposure rather than broad index buying at record highs when rally participation is this narrow. Because 77% of index constituents lagged the benchmark in April 2026, buying the whole index amounts to an implicit bet that the same small cohort of mega-cap winners will continue to carry the weight.
Key signals to monitor include the percentage of S&P 500 stocks trading above their 50-day moving average (54.87% as of 30 April 2026) and 200-day moving average (57.05%), any re-escalation of geopolitical tension related to the U.S.-Iran ceasefire, and whether earnings growth broadens beyond the narrow AI and semiconductor cohort that led April's advance.


