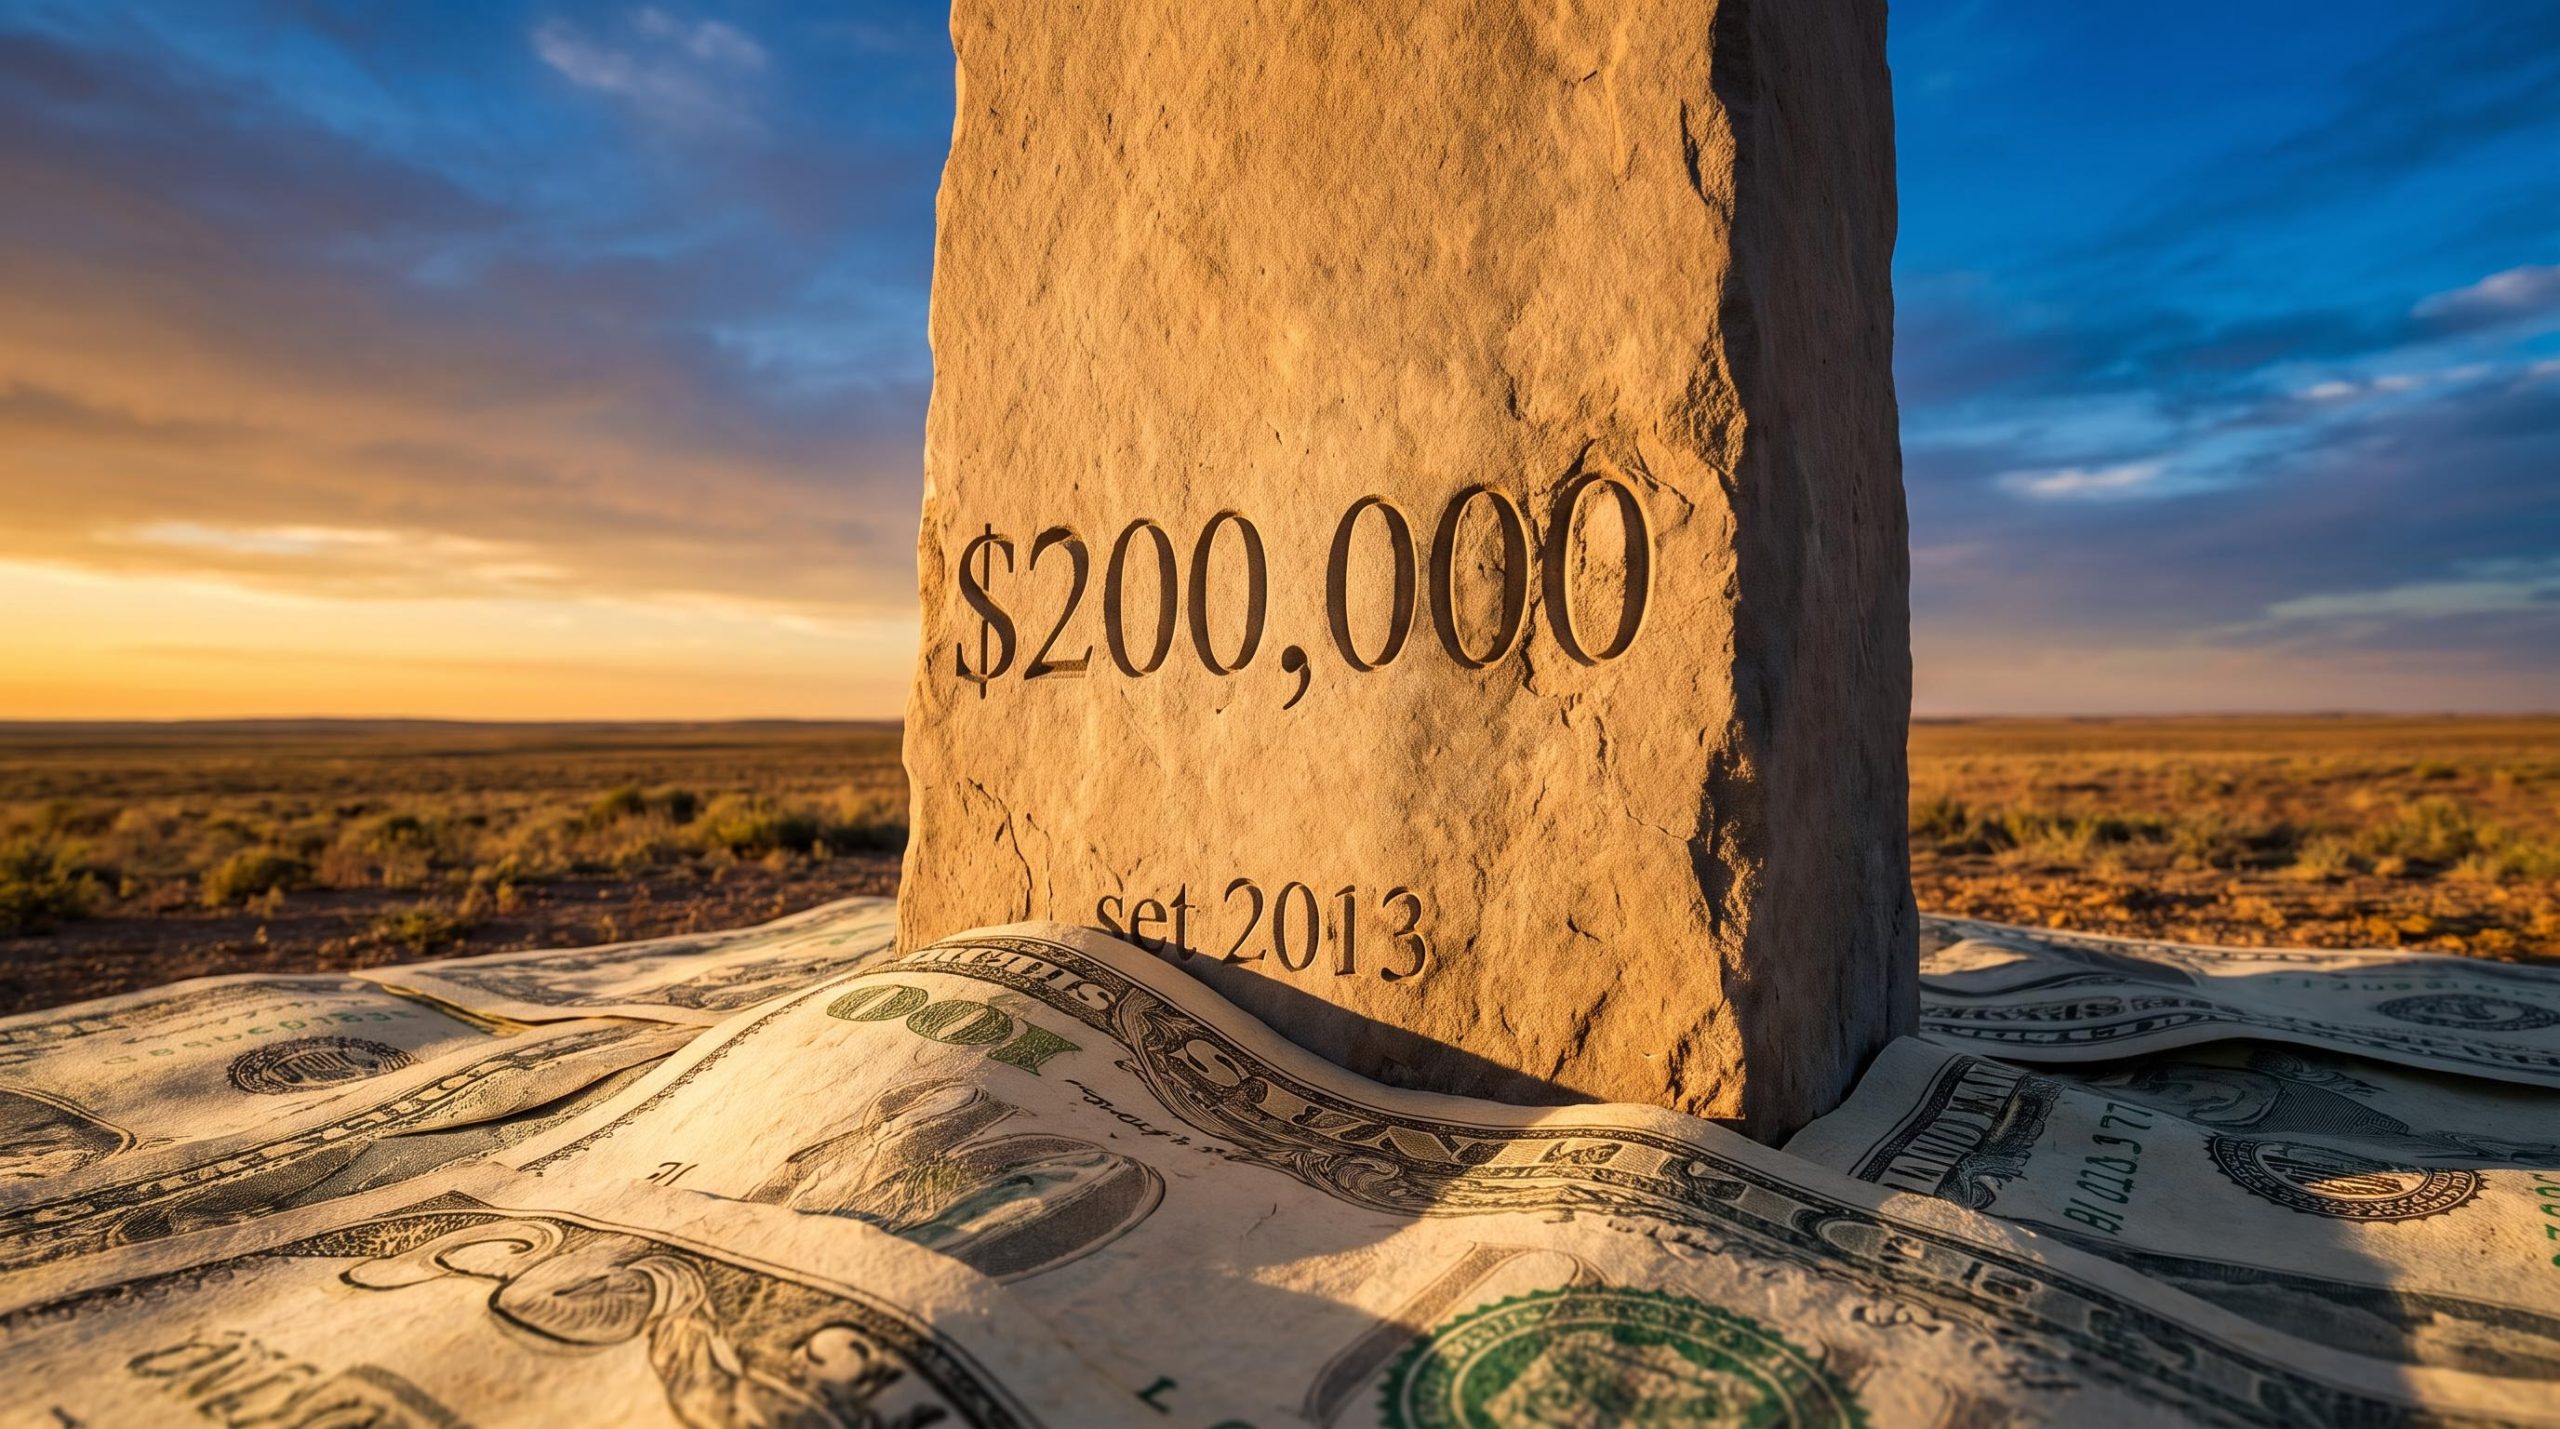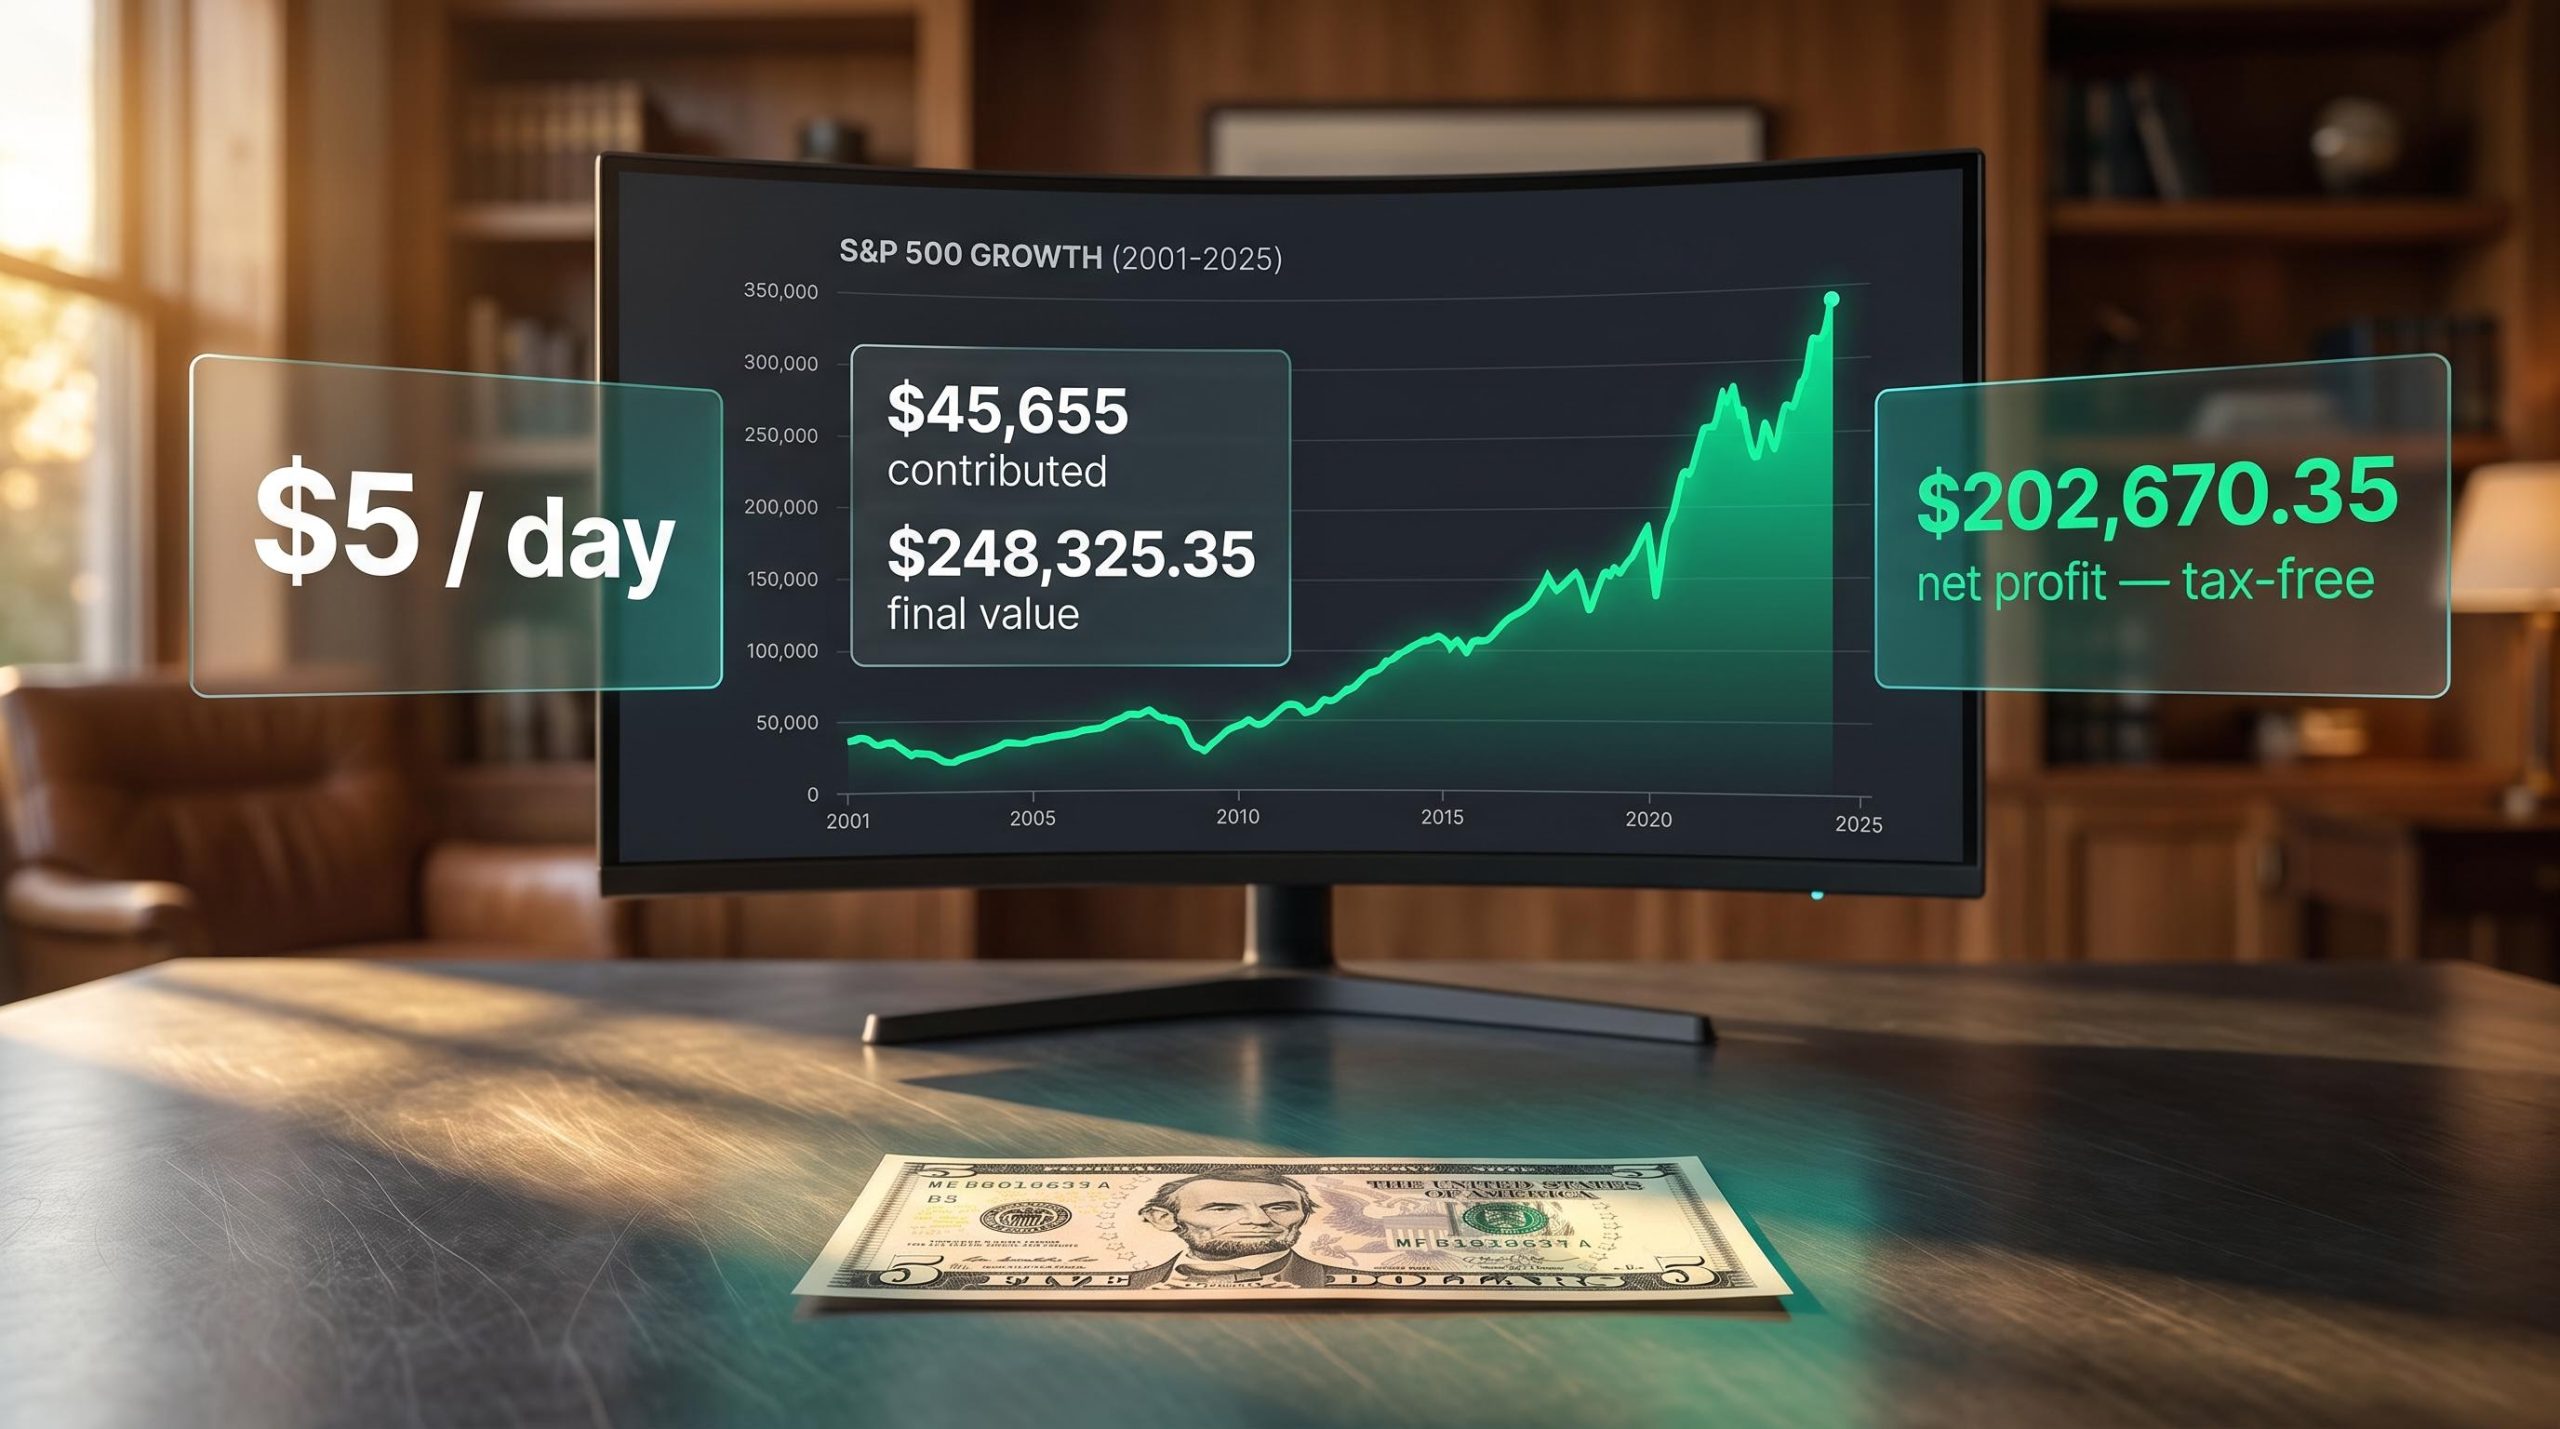
Ryan contributed $45,655 over 25 years by investing $5 a day in an S&P 500 index fund. His account finished at $248,325.35. The gap between those two numbers, more than $200,000, was not earned through stock-picking, market timing, or any financial skill beyond consistency.
The experiment ran from January 2001 through December 2025, with every dollar sheltered inside a Roth IRA. Ryan was 26 when he started, had no particular financial advantages going in, and held to exactly the same approach for the full duration. The S&P 500 did the compounding. He did the not-quitting.
What follows traces the actual year-by-year path, including the stretches where the account was underwater and the years where a single crash wiped out more than a decade of contributions. The goal is to let you see the full texture of the experience, so you can decide whether the same approach makes sense for your own situation today.
Why $5 a day deserves a serious look
Most people assume meaningful wealth requires large sums. The arithmetic says otherwise.
$5 a day works out to roughly $150 a month, or $1,825 a year. Over 25 years, that totals $45,655 in personal capital deployed. That is less than the price of a mid-range car, spread across a quarter of a century. It is an amount that sits below most people’s awareness threshold, the sort of daily sum that gets absorbed into routine spending without being felt or tracked.
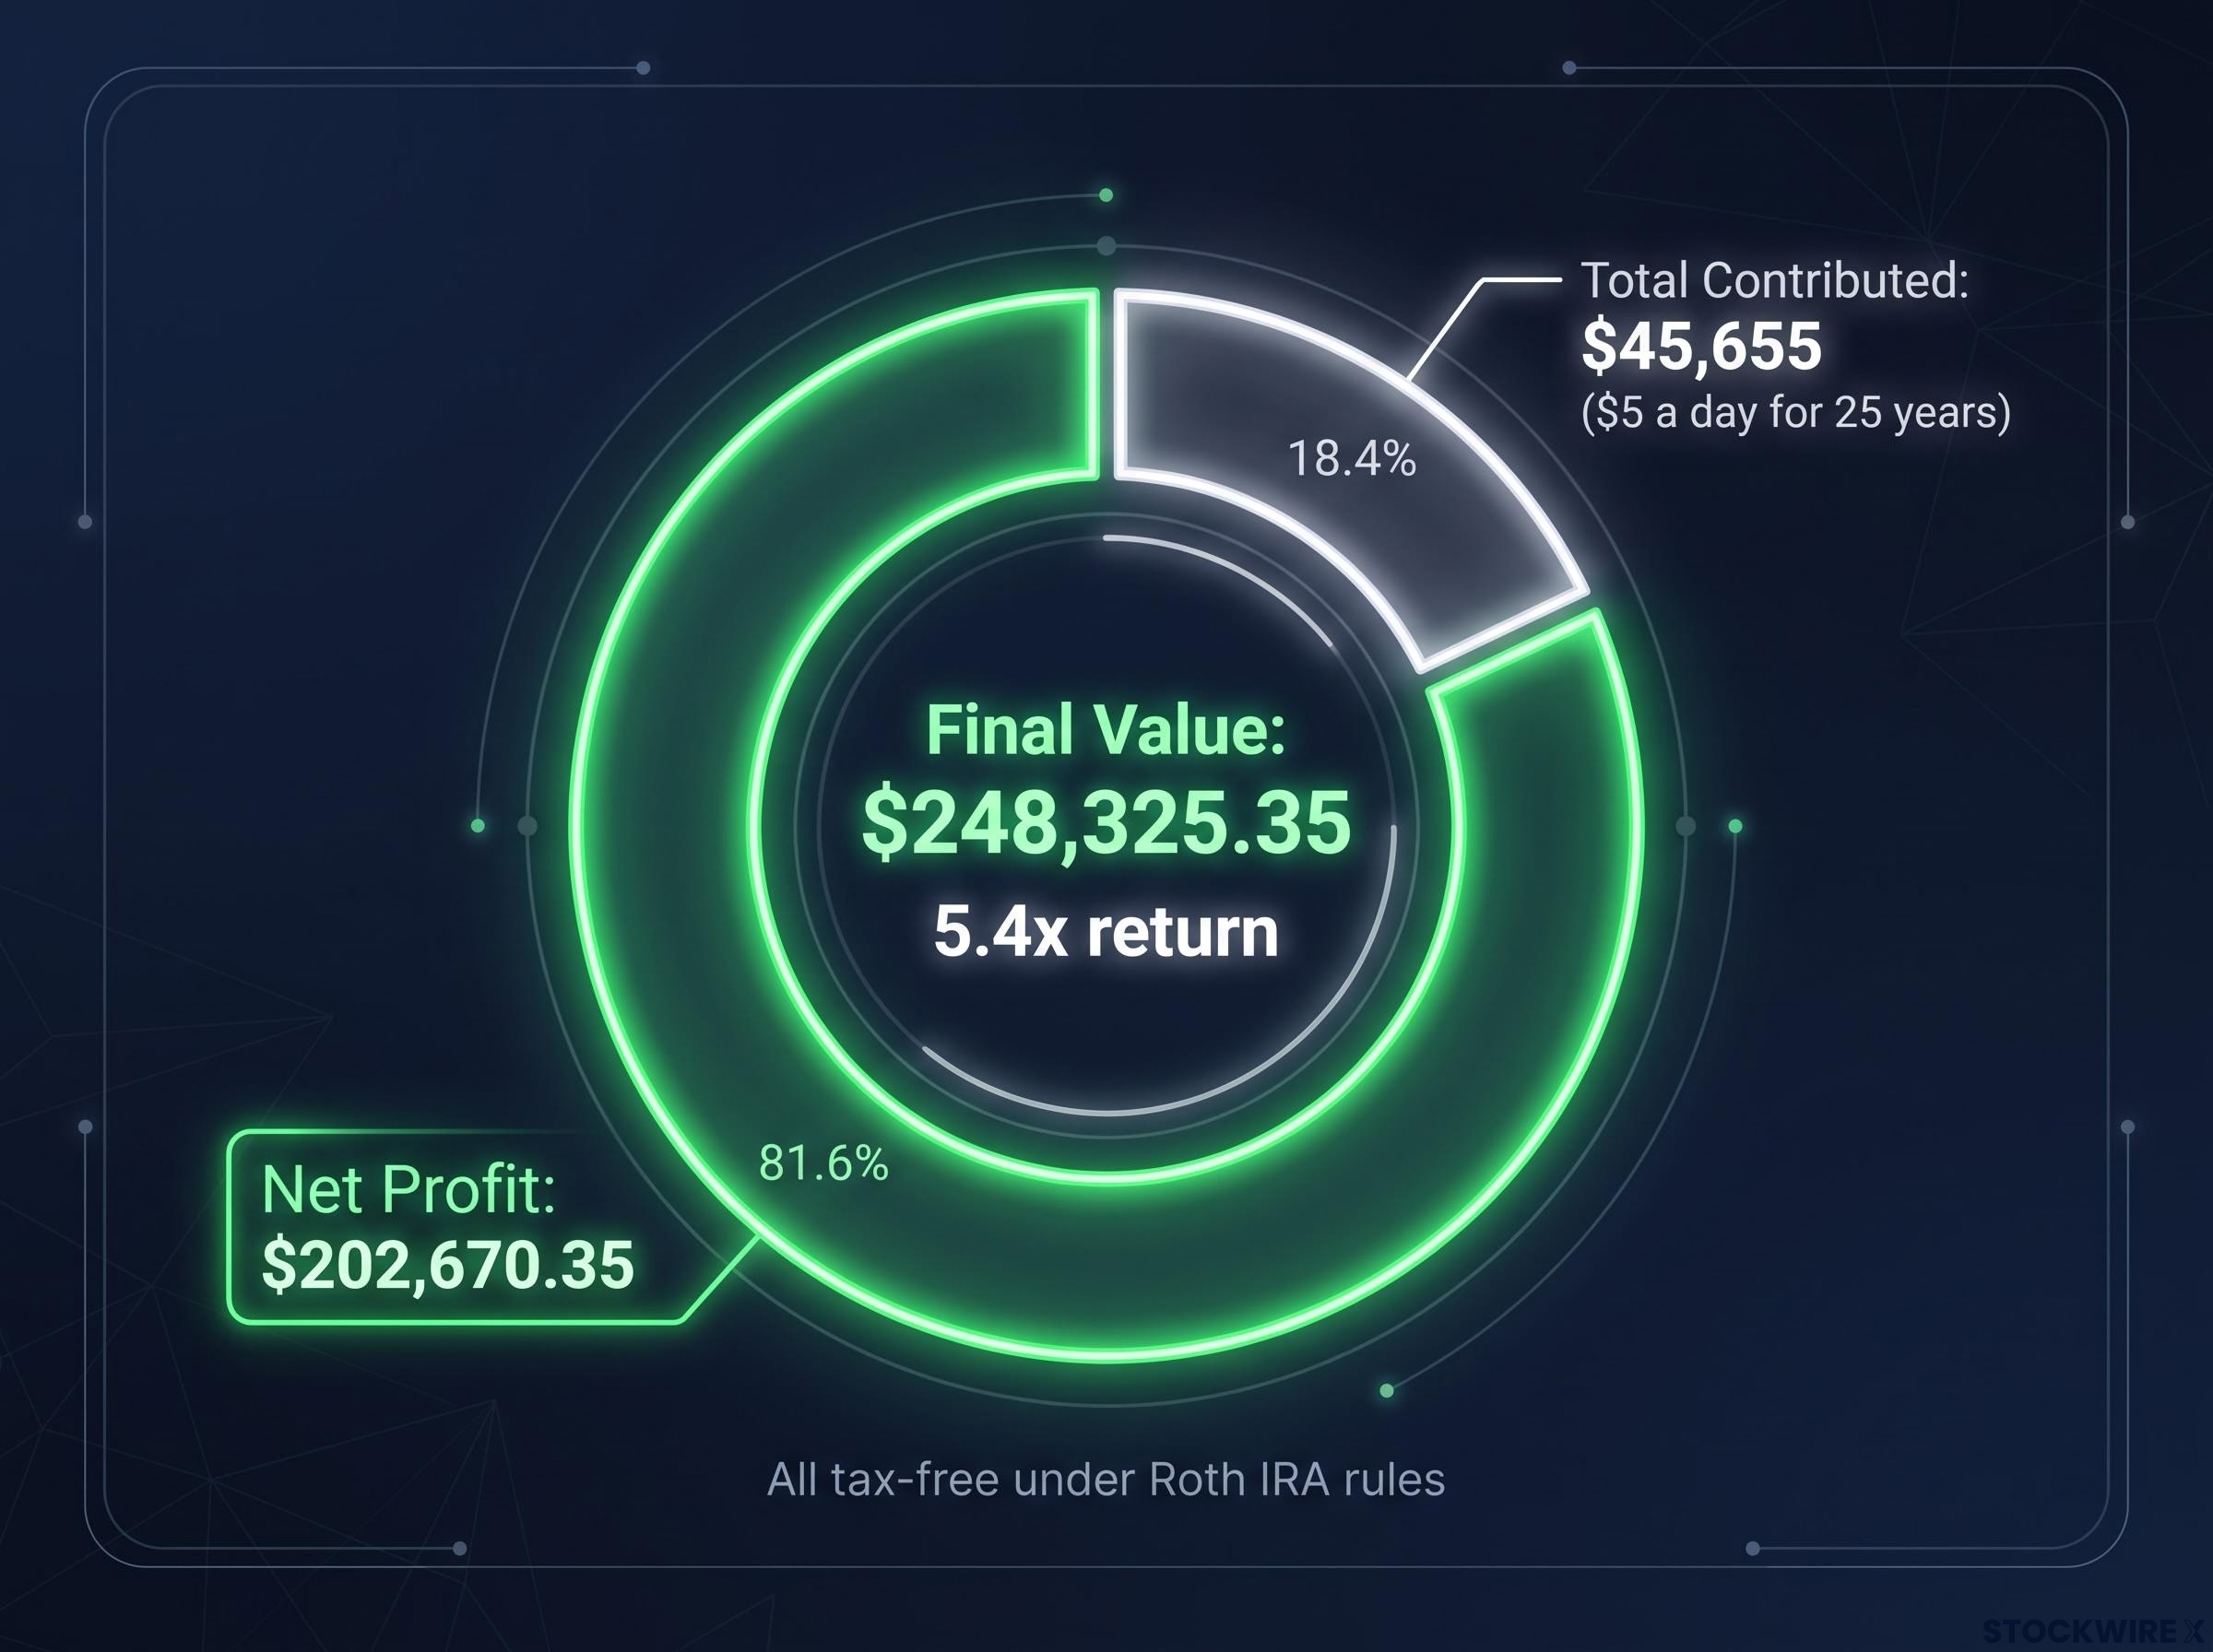
The outcome, however, registers. Ryan’s $45,655 became $248,325.35, a 5.4x return multiple on contributed capital. The market, not additional saving, did most of the heavy lifting. Ryan’s primary job was simply to not interfere.
The case for index funds vs active management rests on cost arithmetic as much as performance data: fee compounding alone can erase more than $22,000 from a 30-year terminal balance, which is why the 0.03% expense ratio in Ryan’s experiment was not an incidental detail but a structural input to the final number.
Three structural choices made the result possible:
- Investment vehicle: A broad S&P 500 index fund with a 0.03% expense ratio, tracking the full market index rather than any individual sector or actively managed strategy
- Account wrapper: A Roth IRA, which sheltered all growth from taxation
- Contribution method: Automatic daily contributions with all dividends reinvested, removing the temptation to time entries or skip periods
The outcome in full: $45,655 contributed. $248,325.35 final value. $202,670.35 net profit. All tax-free under Roth IRA rules.
When big ASX news breaks, our subscribers know first
What the Roth IRA wrapper actually does to your returns
The account type you choose is a compounding variable, not a footnote. Here is why the Roth IRA matters to a result like this.
When Ryan deposited his $5, he had already paid income tax on it. That is the core mechanic of a Roth IRA: contributions go in after tax. In exchange, everything that grows inside the account, every dollar of the $202,670 profit, comes out tax-free at retirement, provided two conditions are met. You must be at least 59½ years old, and the account must have been open for at least five years.
That is the deal. You pay tax on the seed. You never pay tax on the harvest.
Your contributions (the original $5/day principal) can actually be withdrawn tax-free at any time, with no penalties. The earnings are what you want to leave untouched until both conditions are satisfied.
At $1,825 per year, the $5/day contribution sat well below the annual Roth IRA limit throughout the entire experiment, meaning the full strategy ran within legal bounds without any adjustments.
Now consider the alternative. In a traditional IRA, your contributions go in pre-tax, which feels like a benefit upfront. But every dollar you withdraw in retirement is taxed as ordinary income. In a standard taxable brokerage account, you pay tax on dividends annually and capital gains tax when you sell. The same investment, the same returns, a materially different outcome at withdrawal.
| Account Type | Tax on Contributions | Tax on Growth | Tax on Withdrawal |
|---|---|---|---|
| Roth IRA | Yes (after-tax dollars) | None | None (if qualified) |
| Traditional IRA | No (pre-tax dollars) | None (tax-deferred) | Yes (taxed as income) |
| Taxable Brokerage | Yes (after-tax dollars) | Yes (dividends and gains) | Yes (capital gains tax) |
Choosing the wrong account type for the same investment strategy could cost you a meaningful share of that $202,670 gain at withdrawal. The Roth wrapper is not a detail. It is a structural decision that shapes the final number as much as the fund selection does.
The Roth wrapper is one layer of a broader tax-efficient account structure that determines how much of your compounding you actually keep; the mechanics of asset location, dividend handling, and the step-up in basis provision can add or subtract tens of thousands of dollars from the same underlying investment strategy.
Market crashes, account values, and the discipline that held through each one
The $248,325 result reads cleanly from a distance. Up close, the path included four periods where quitting looked perfectly rational.
The early years: losing money on paper and staying anyway (2001-2008)
Ryan started contributing in January 2001, directly into the teeth of the dot-com collapse. The index dropped 11.89% across that first year, then declined a further 22.10% through 2002.
By 31 December 2002, Ryan had put in $3,650 across those two full years, and his account had settled at $2,948.71, leaving him $701.29 in the red, a shortfall of 19.2% against his own contributions. At the same time, confidence in equities had largely evaporated in the broader market, and the prevailing mood made continuing feel like the irrational choice rather than the sensible one.
Then five consecutive positive years arrived. By 31 December 2007, Ryan had contributed $12,780, and his account stood at $17,027.10, a 33.2% gain. During those recovery years, the housing boom made colleagues appear to be accumulating wealth faster through leveraged real estate, making steady index investing feel underwhelming. But the account was objectively working.
Then 2008 happened. The S&P 500 fell 37%, the worst annual performance for U.S. equities since 1931. Ryan’s account dropped to $12,188.20 on $14,610 in total contributions, erasing every dollar of accumulated gain and consuming part of his own capital. Eight years in, and he was underwater again.
The later crashes: bigger dollar losses, faster recoveries (2020-2022)
By the start of 2020, after 19 years and $34,695 in contributions, Ryan’s account crossed $100,000 for the first time. Then the COVID crash arrived: the S&P 500 fell 33.9% in 33 days. But the full-year 2020 return was +18.40%. Investors who held experienced no net annual cost from the event. Those who sold locked in permanent losses.
The 2022 drawdown told a different story about scale. The S&P 500 fell 18.11%, roughly half the 2008 percentage decline. But Ryan’s account dropped from $156,226.18 to $129,548.80, a single-year dollar loss of $26,677.38.
In 2022, that $26,677 single-year decline was larger than every contribution Ryan had made across his first 14 years combined, a total of $25,565. What most long-term investing discussions fail to mention is that the heaviest psychological and financial pressure tends to arrive toward the end of the journey, not the beginning.
| Milestone | Date | Total Contributed | Account Value | Gain/(Loss) |
|---|---|---|---|---|
| End of year 2 (dot-com trough) | 31 Dec 2002 | $3,650 | $2,948.71 | -$701.29 (-19.2%) |
| Pre-crisis peak | 31 Dec 2007 | $12,780 | $17,027.10 | +$4,247.10 (+33.2%) |
| Post-2008 crisis | 31 Dec 2008 | $14,610 | $12,188.20 | -$2,421.80 |
| Six-figure milestone | Start of 2020 | $34,695 | $100,000+ | — |
| Pre-2022 peak | 31 Dec 2021 | — | $156,226.18 | — |
| Post-2022 drawdown | 31 Dec 2022 | — | $129,548.80 | -$26,677.38 (year) |
| Final value | 31 Dec 2025 | $45,655 | $248,325.35 | +$202,670.35 (5.4x) |
Each of these episodes represented a rational-sounding case for stopping. None of them, viewed from the end of the full period, warranted it.
The crashes described in Ryan’s account are the moments where buying the dip would have looked most rational, yet the experiment’s result came not from timing entries but from ignoring them entirely; the same discipline that prevents panic-selling also prevents the overconfident repositioning that turns a temporary drawdown into a permanent strategy shift.
How compounding builds wealth back-loaded: the case for staying invested through the slow years
Here is the number that reframes the entire experiment: the final five years, from 2021 through 2025, produced more than half the total account value, on just $9,130 in new contributions across that period.
That is not a lucky streak. That is how compounding actually works, and it is the reason the early years feel so unrewarding.
The pattern moves through three phases:
- Seed phase (years 1-10): Your base is small. Contributions make up most of the account value. Dollar gains from market returns are modest because the amounts are modest. Progress feels invisible.
- Growth phase (years 11-20): The base is expanding. Market returns start producing dollar gains that rival your annual contributions. The account crossed $100,000 at the start of 2020, after 19 years and $34,695 in contributions.
- Acceleration phase (years 21-25): The base is large enough that normal percentage moves create large absolute dollar changes. More than half the total wealth was generated here, on a fraction of the total contributions.
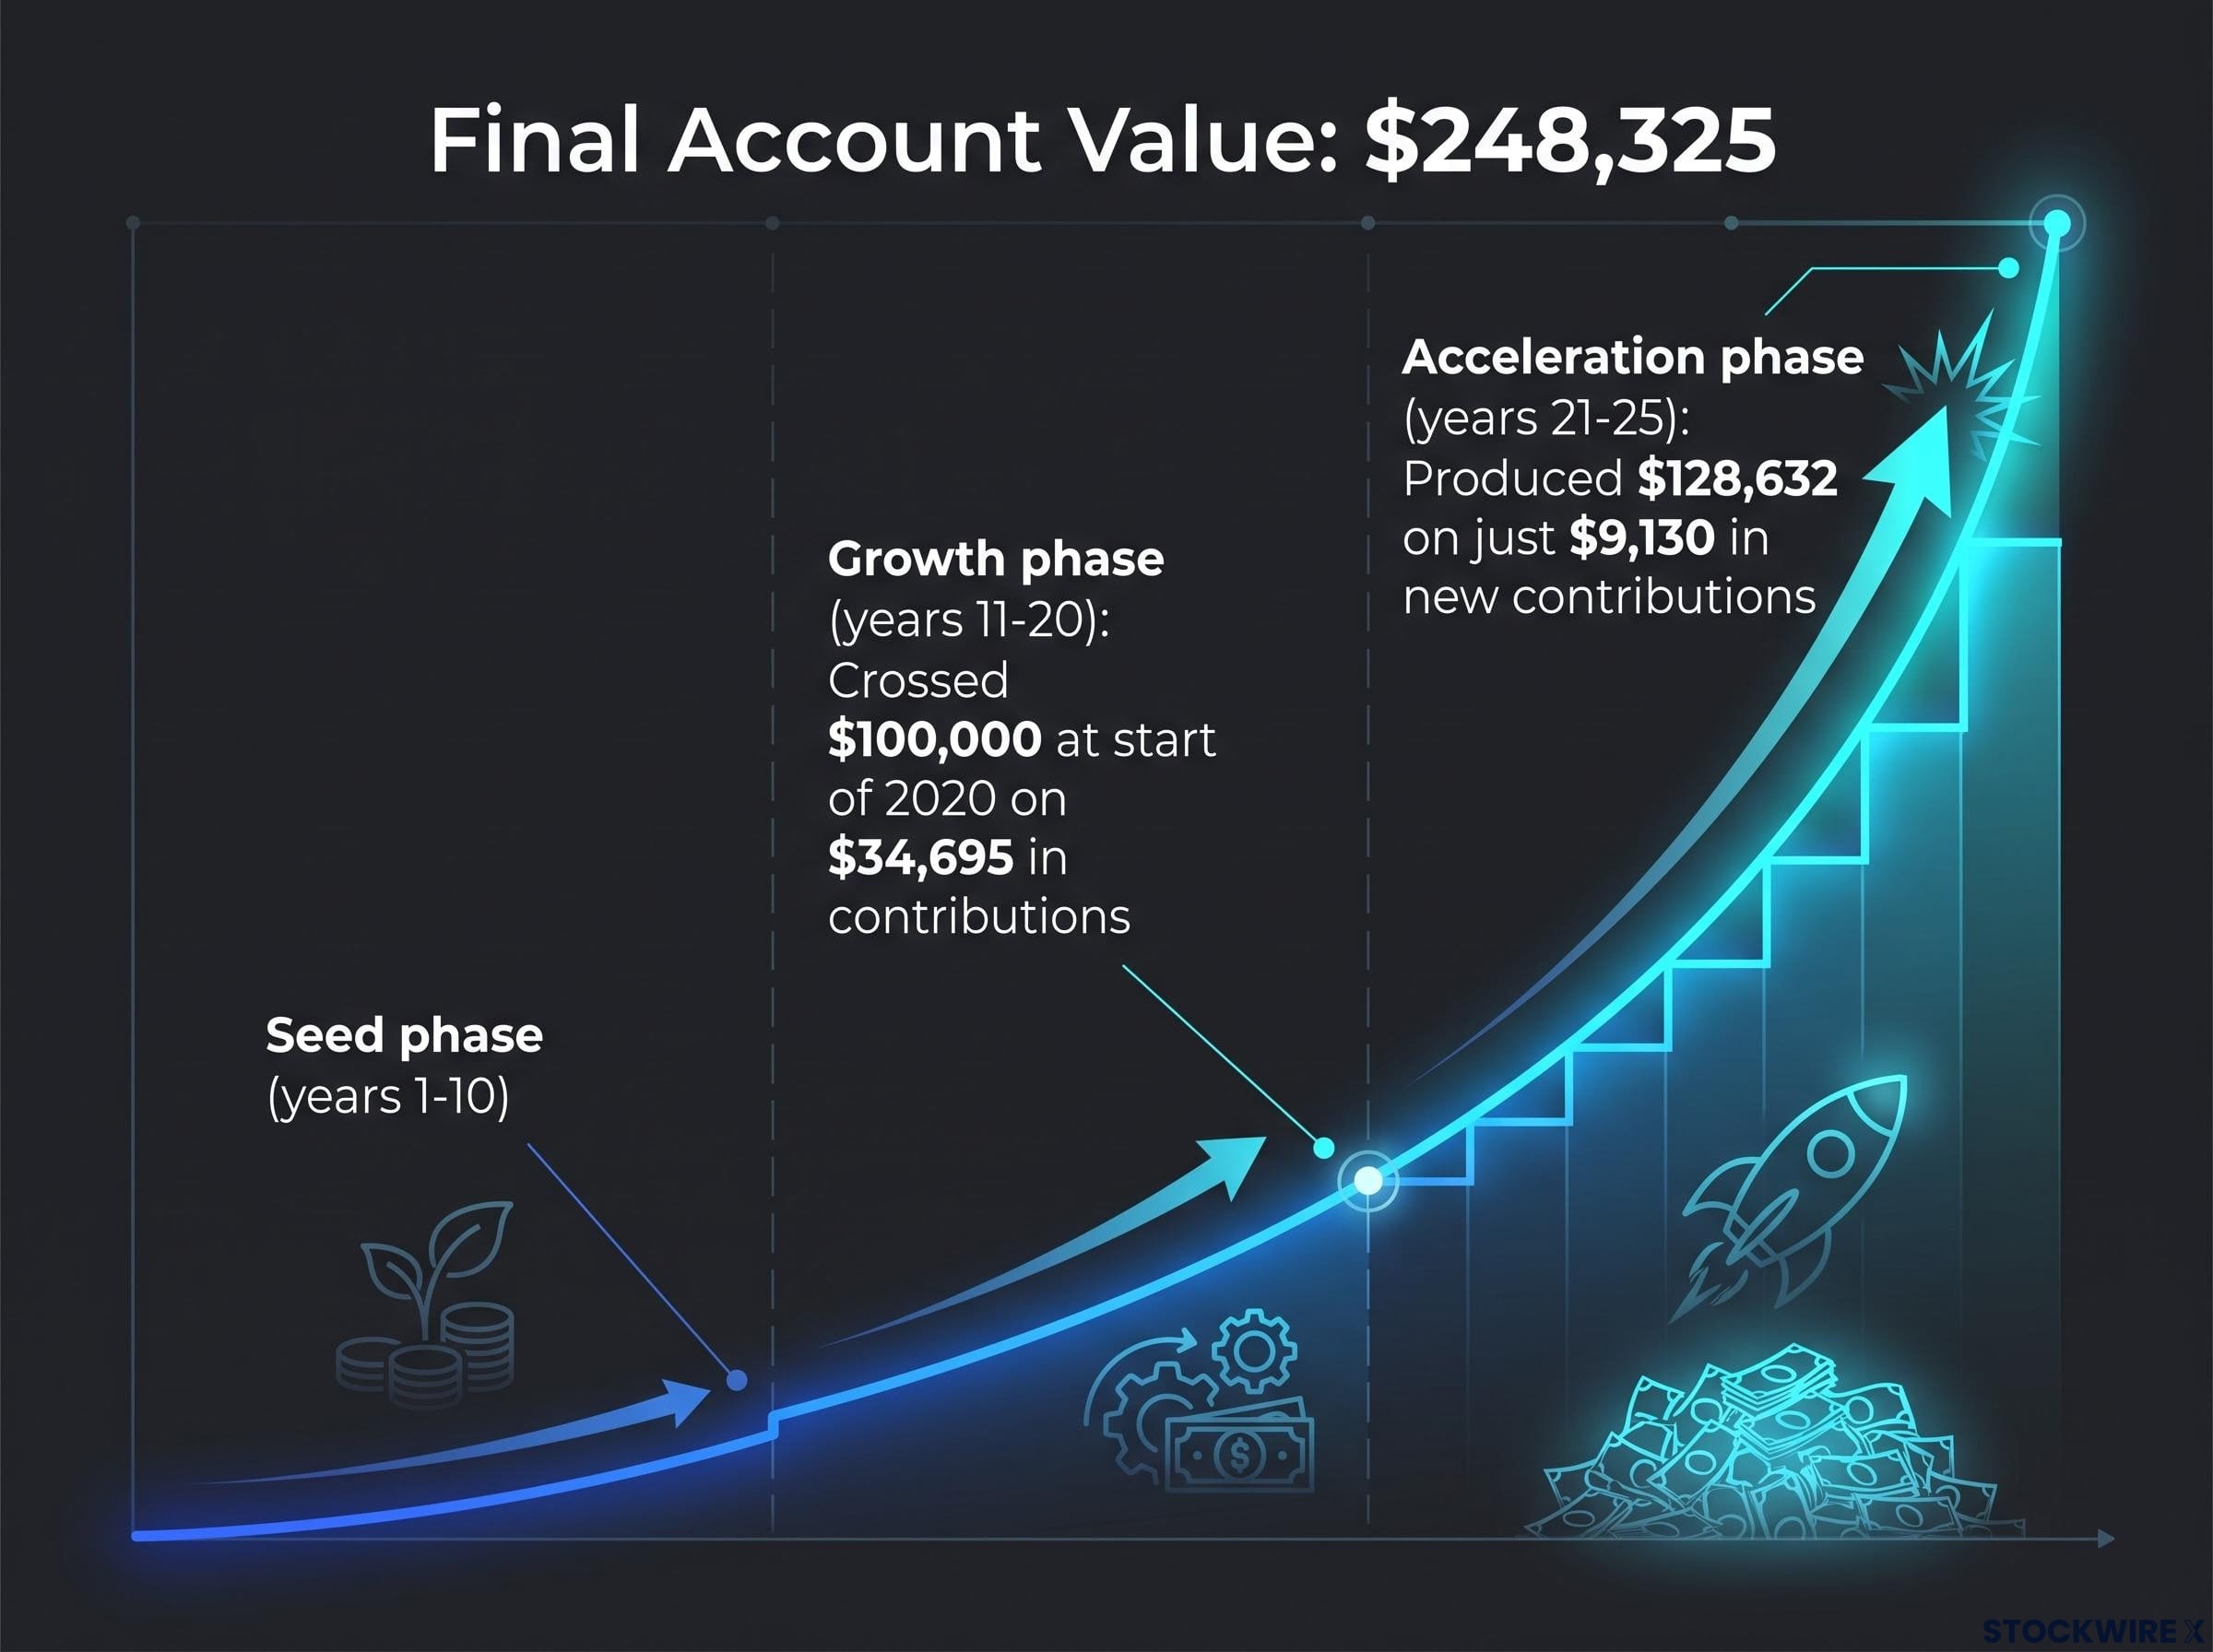
More than half the final account value, $128,632 of the $248,325, arrived in the last five years on just $9,130 of new contributions.
The same dynamic works in reverse. When the account is large, percentage losses translate into dollar losses that dwarf anything experienced early on. The 2022 drawdown illustrated this directly: a smaller percentage decline than 2008 produced roughly ten times the dollar loss.
For planning purposes, benchmark comparisons help calibrate expectations. At 6% annually, $5 a day for 20 years yields approximately $66,214. At 8% over 50 years, the figure approaches $1.1 million. Ryan’s outcome sits between those bookends because his return sequence was stronger than 6% but his time horizon was shorter than 50 years.
Enduring those slow, uncomfortable early years is not a warm-up act for the real work. Showing up consistently through that period, when nothing appears to be happening, is where the outcome is actually built. Anyone who quit at year five or ten forfeited the bulk of the outcome.
How to run your own version of this experiment starting today
The experiment is a historical case study. The mechanism behind it, small consistent contributions compounding in a tax-advantaged account, is something you can set up this week.
Here are the five steps:
- Open a Roth IRA at a low-fee broker that offers access to S&P 500 index funds or ETFs. Income limits apply and vary by filing status, so verify your eligibility before opening the account.
- Automate a recurring monthly transfer of approximately $150 (roughly $5 a day) directly into the account. Many platforms allow recurring investments on every market day.
- Select a broad, low-cost index fund tracking the S&P 500 or total U.S. market, with an expense ratio below 0.10%. The experiment used a fund charging 0.03%.
- Enable automatic dividend reinvestment so distributions buy additional shares without requiring any action from you.
- Commit to the strategy through downturns. Expect multiple significant drawdowns over a multi-decade horizon. They are part of the process, not deviations from it.
Three things to avoid:
- Market timing (attempting to sell before declines and buy at bottoms)
- Stopping contributions during downturns (the opposite of what works)
- Chasing sector-specific funds (which adds concentration risk and emotional trading)
Set accurate expectations. The $248,325 figure reflects one specific 25-year historical path with particularly strong returns. At a more conservative 6% return, $5 a day for 20 years yields approximately $66,214, and for 30 years approximately $142,304. The gap between the conservative projection and the historical outcome is not a reason to discount the approach. It is a reason to understand that starting earlier and staying invested longer is the variable that matters most.
This article is for informational purposes only and should not be considered financial advice. Investors should conduct their own research and consult with financial professionals before making investment decisions. Past performance does not guarantee future results. Financial projections are subject to market conditions and various risk factors.
What $248,325 from $5 a day actually tells you about long-term investing
The experiment demonstrated one mechanism through one specific market period. It does not promise that every 25-year window will deliver the same return sequence. What it does demonstrate is that three variables within your control produced the outcome:
- Contribution consistency: $5 a day, every day, for 25 years, with no breaks
- Crash discipline: Four significant market crashes, zero changes to the strategy
- Account structure: A Roth IRA that sheltered $202,670.35 in profit from taxation
Everything else, the specific annual returns, the sequence of crashes and recoveries, the timing of the acceleration phase, was outside Ryan’s control.
Ryan finished the experiment at 51 years old with $248,325.35 already compounding inside a tax-free account. A second 25-year period remains before typical retirement age, with that base already in place.
The real question this experiment raises is a practical one: if you are 30, 35, or 40 today, what would it actually take to begin building your own version of this, and is there a compelling reason to wait any longer?
The cost of delaying a single year is not the contribution skipped but the compounding base that never forms: a one-year delay on a 30-year horizon costs approximately $28,000 in terminal wealth, roughly eight times the annual contribution avoided, which is why the practical question at the end of this article is not rhetorical.
—