How Warsh’s 130-Word Statement Reshaped Federal Reserve Policy
5 hrs ago
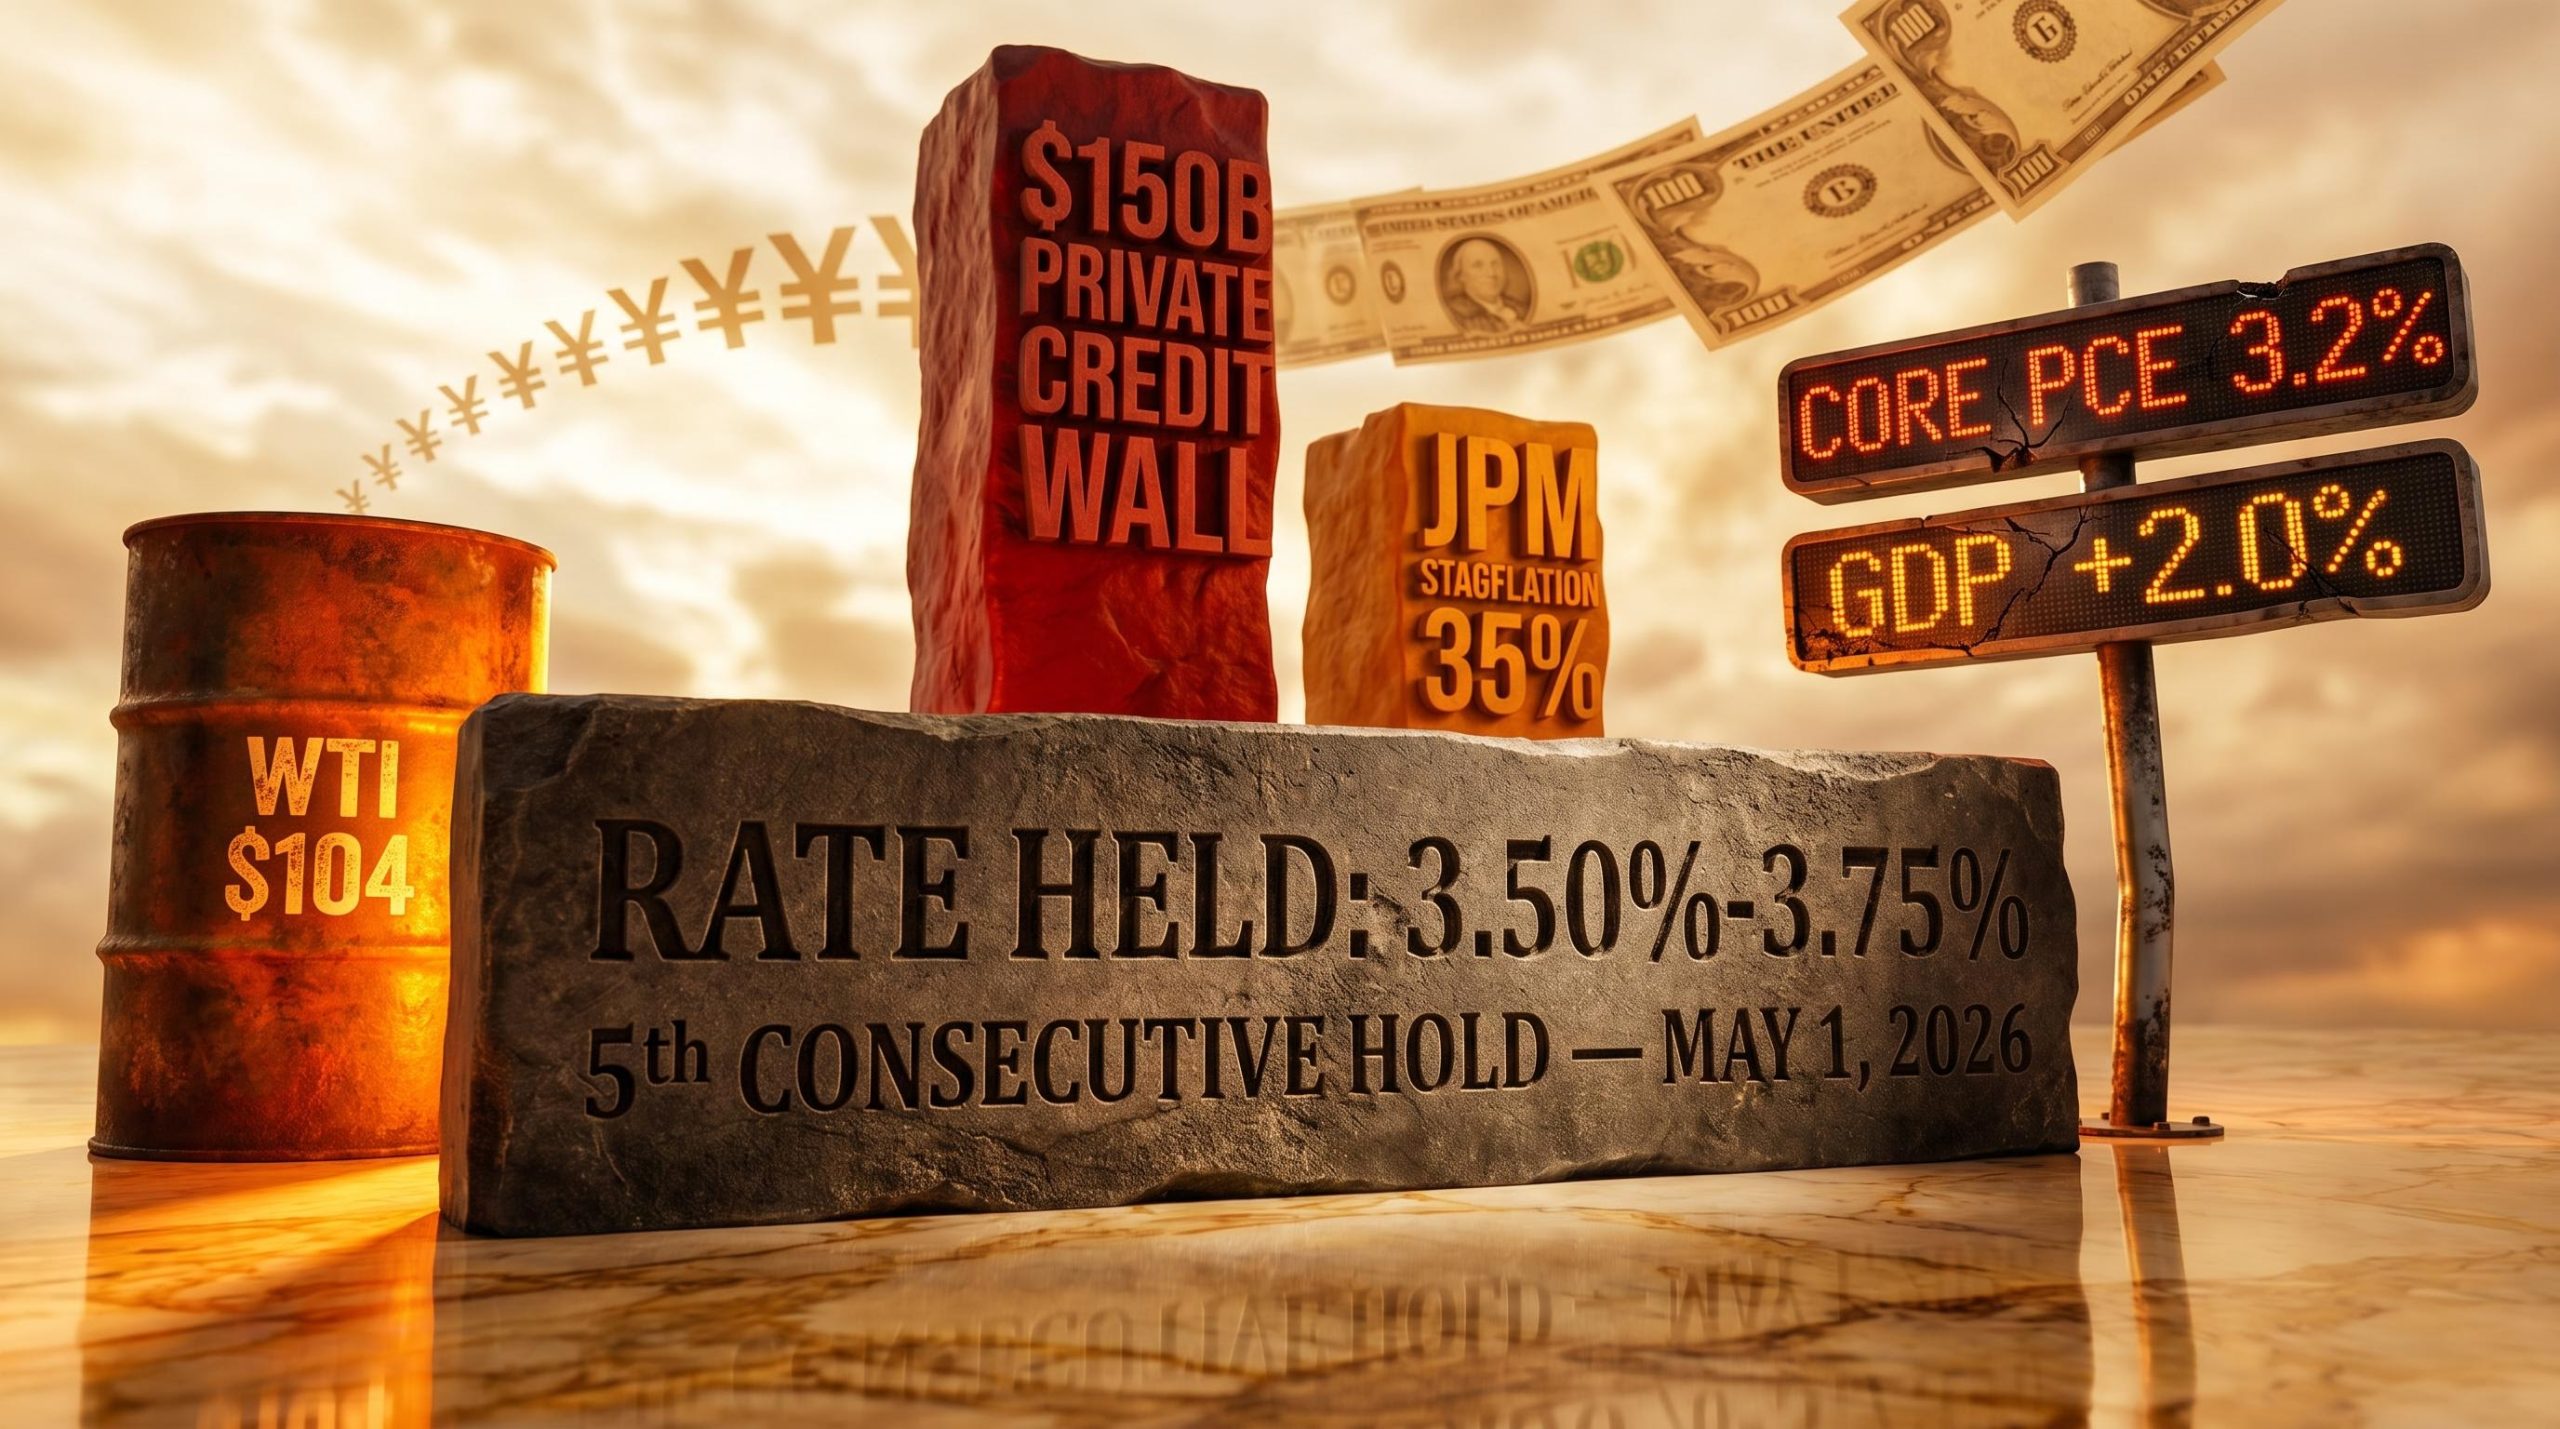
The Federal Reserve held rates steady for a fifth consecutive meeting on 1 May 2026, and the decision captured the precise bind facing policymakers: inflation running at 3.2% on core PCE, growth moderating to 2.0% annualised in Q1, and no clean policy move in either direction. The stock market outlook for the remainder of 2026 hinges less on what the Fed does next and more on understanding why it cannot act at all. With oil prices above $100 per barrel compressing consumer budgets, private credit stress building toward a $150 billion maturity wall, and a Japanese bond market transmitting pressure directly into US credit spreads, the macro picture is considerably more complicated than equity index levels suggest. What follows is an examination of the specific mechanisms binding the Fed, how that constraint is already rippling through banks, credit markets, and alternative assets, and where the resulting valuation dislocations may matter most for US investors in mid-2026.
A rate hold sounds like a non-event. The Fed reviewed the data, decided conditions did not warrant a move, and adjourned. Five consecutive holds under the conditions facing the May 2026 FOMC tell a different story.
The federal funds rate sits at 3.50%-3.75%, where it has remained since the last adjustment. The median dot plot projects rates steady through Q3 2026, and no cut was signalled in the May statement. The reason is not patience. It is paralysis.
The policy bind visible in May deepened from foundations laid at the April 2026 FOMC meeting, where four simultaneous dissents, the highest count since 1992, exposed a committee pulling in contradictory directions even before the May hold was recorded.
The FOMC policy statement confirmed the federal funds rate target range held at 3.50%-3.75%, with language offering no signal of imminent adjustment in either direction, reinforcing the paralysis characterisation rather than the patience narrative some commentators have applied.
The Fed faces a three-way trap:
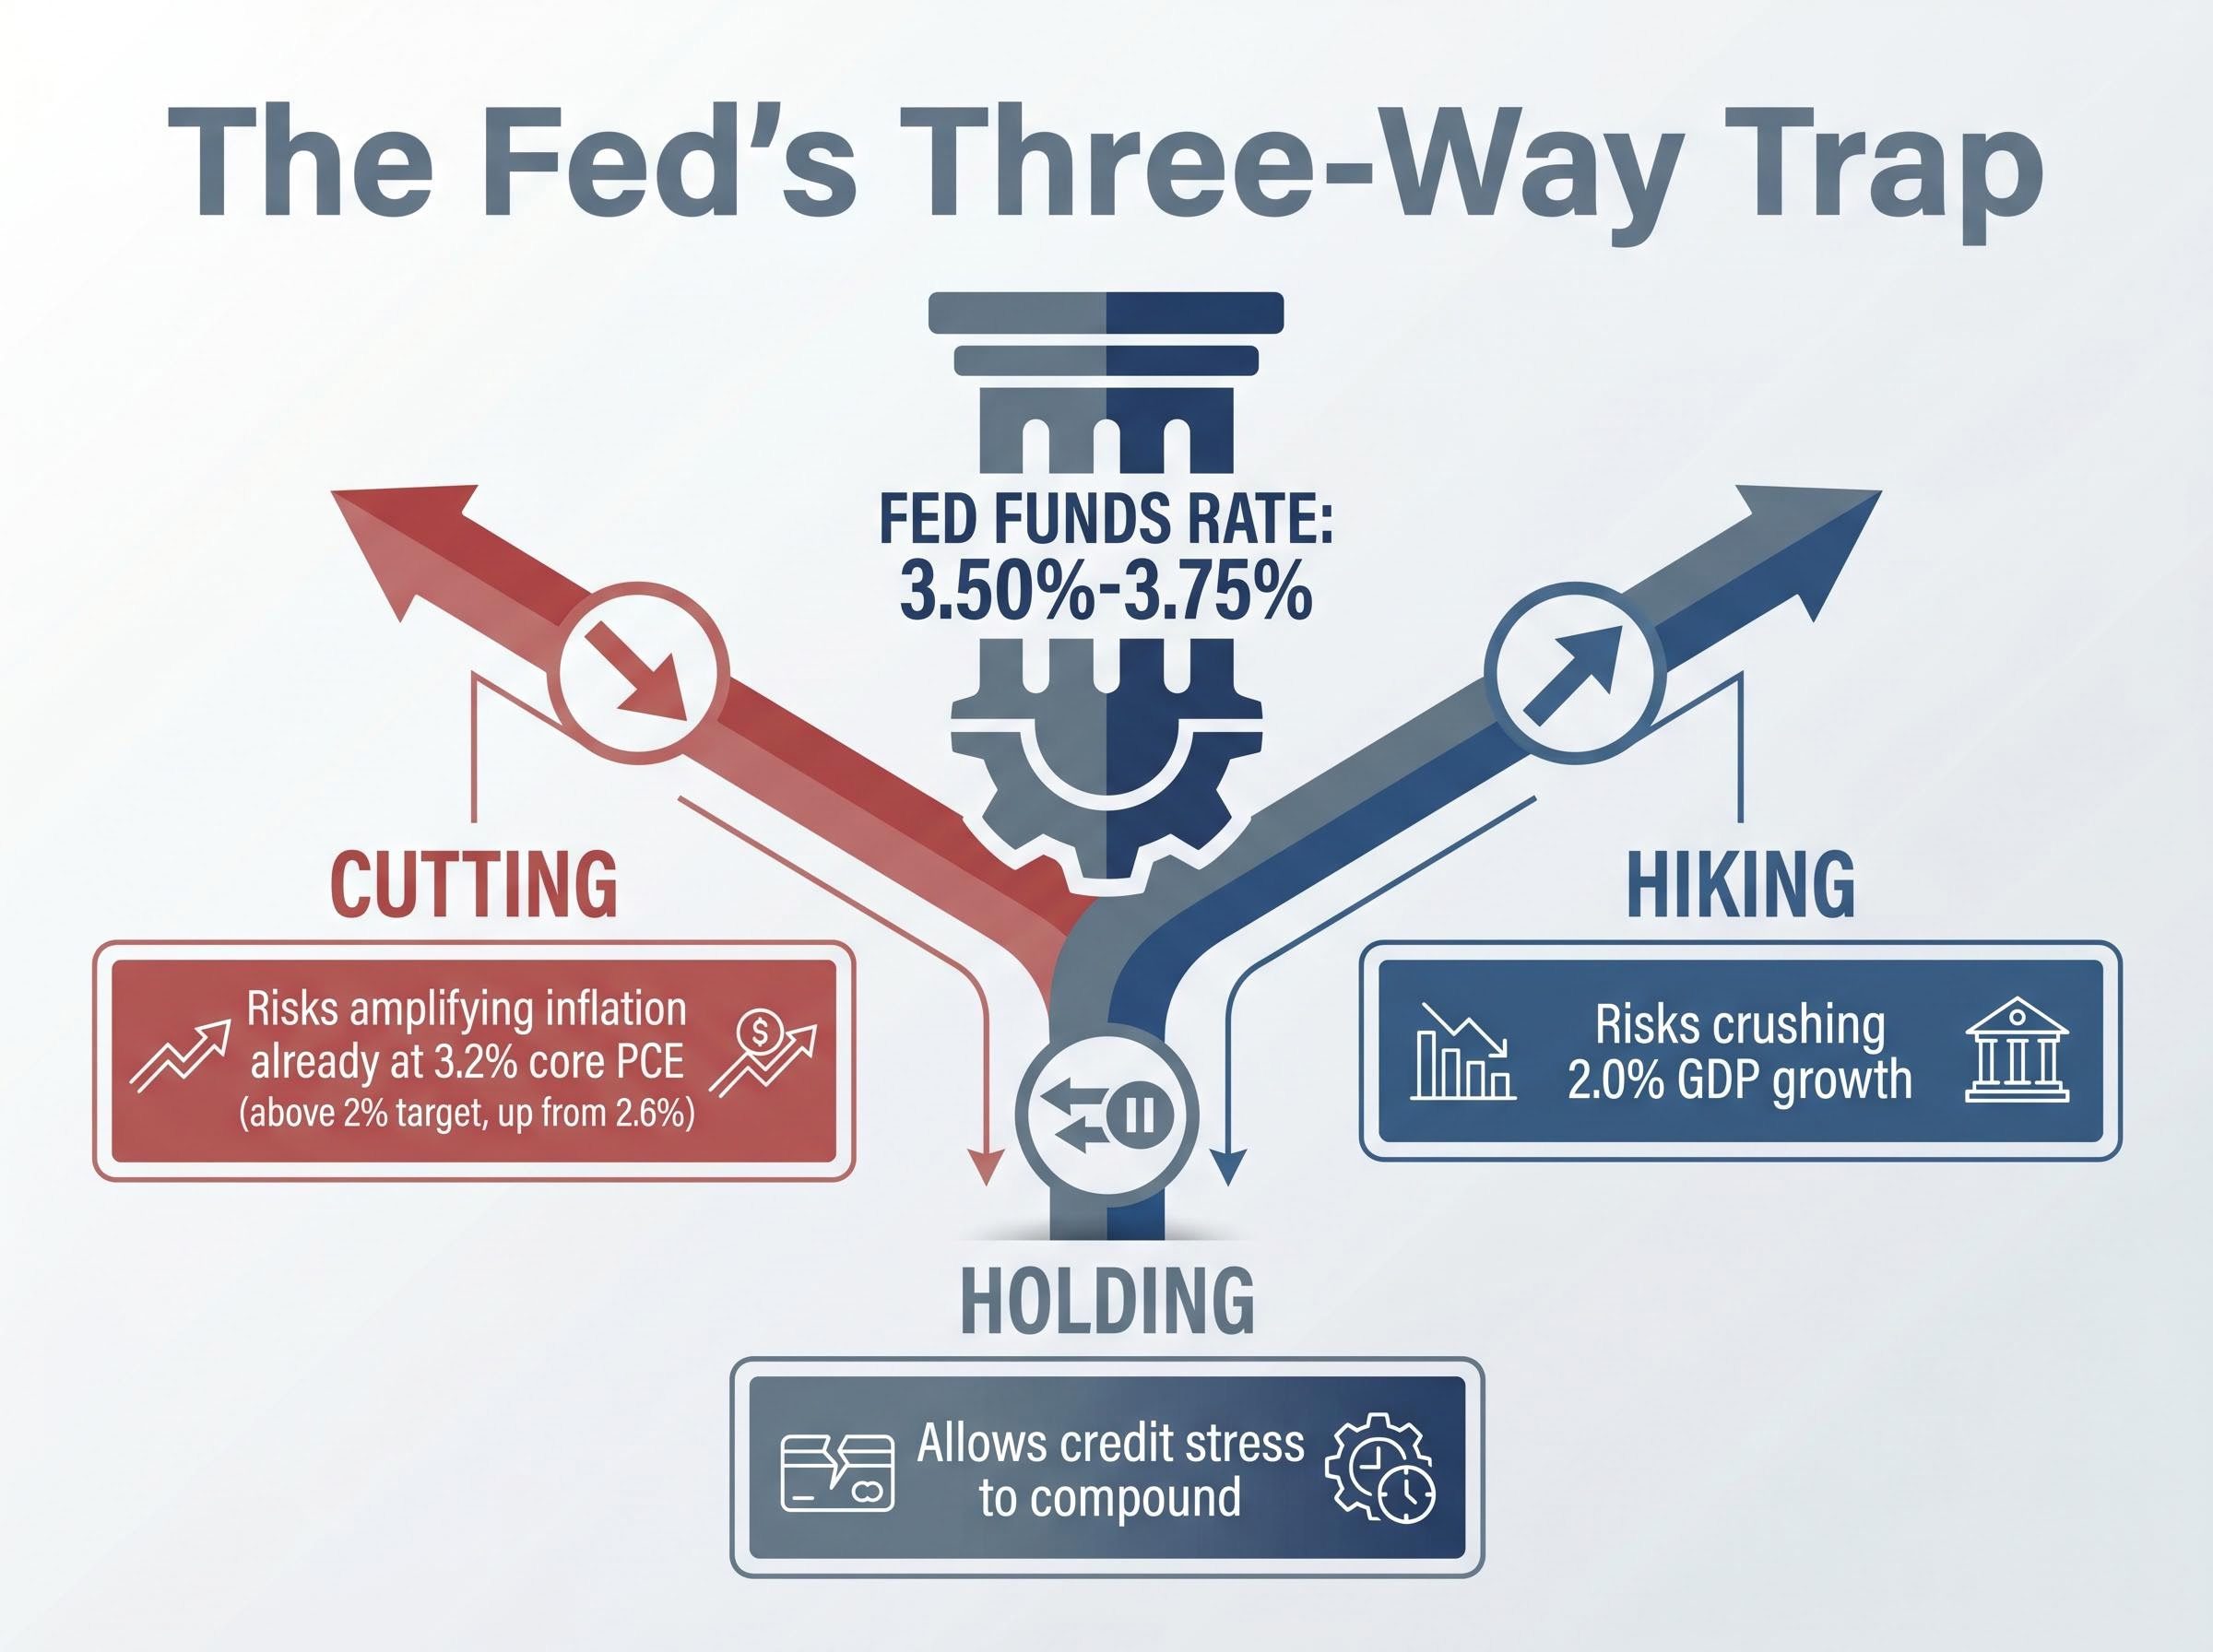
None of these options is cost-free. The hold is the least disruptive in the short term, but it carries its own compounding price.
The CME FedWatch Tool prices less than a 10% probability of a July rate cut, with no meaningful easing expected before September 2026.
The 10-year Treasury yield trading in the 4.39%-4.45% range reinforces this signal. That yield level reflects a market that believes the hold extends rather than resolves quickly. For rate-sensitive sectors, from housing to consumer credit to bank net interest margins, this is not a waiting game with a visible end date.
Stagflation describes an economy where growth stalls or contracts while inflation remains persistently above target. It forces central banks into an impossible trade-off: fighting inflation requires tighter policy that worsens the growth problem, while supporting growth requires easier policy that worsens inflation. The 1970s remain the reference point, when double-digit inflation collided with recession to produce a decade of eroded purchasing power and policy failure.
The 2026 configuration does not fit the classical definition. GDP at +2.0% is positive. The economy is not contracting.
| Dimension | Classical stagflation | 2026 configuration |
|---|---|---|
| GDP growth | Negative or near-zero | +2.0% (positive but decelerating) |
| Inflation | Well above target, persistent | +3.2% core PCE, above 2% target |
| Fed response options | No good move available | Same constraint applies |
The constraint column is where the parallel tightens. Even without contraction, the Fed’s hands are tied in the same way they would be under classical stagflation.
Goldman Sachs projects H2 2026 GDP growth of just 0.8% with CPI at 3.5%, a trajectory that moves considerably closer to the classical definition. JPMorgan raised its stagflation scenario probability to 35% as of 29 April 2026, up from 20% in March.
That shift from 20% to 35% is the signal that matters for positioning. Stagflation is not a condition investors can wait to confirm before acting. By the time the data matches the textbook, the window for calibrated portfolio adjustments has already narrowed. The forward trajectory, not the current snapshot, is what warrants attention.
Recession probability estimates from Moody’s Analytics reached nearly 49% by late April 2026, with PNC Financial Services Group warning that odds exceed 50% if oil reaches $160 per barrel, a threshold that current Brent pricing is approaching from below.
WTI crude at approximately $104 per barrel and Brent at approximately $109-$116 (as of early May 2026) represent more than an energy sector story. Elevated oil prices, driven by Middle East tensions and OPEC+ supply constraints, function as an inflation persistence mechanism with a specific transmission chain:
JPMorgan’s Energy Outlook (2 May 2026) estimates 20%-30% of elevated energy costs pass through to consumer prices within 3-6 months, the most precise quantification available of how crude translates to household budgets.
Goldman Sachs warned on 30 April 2026 that sustained elevated oil exerts upward pressure on core PCE via second-round effects, while Barclays flagged persistent pass-through compounded by wage stickiness.
Core PCE is already running at 3.2% before the full oil pass-through materialises. If crude remains above $100, any dovish pivot from the Fed risks embedding inflation expectations at precisely the level the “higher for longer” posture was designed to prevent.
The macro constraint sounds abstract until it reaches specific balance sheets. Three channels are already absorbing the cost of the Fed’s inaction.
| Sector | Mechanism of impact | Key data point |
|---|---|---|
| Banks | Prolonged hold suppresses net interest income growth expectations | Financials moved from most overvalued to slight discount in Q1 2026 (Morningstar) |
| Consumers | Elevated oil + higher borrowing costs compress discretionary spending | Core PCE at 3.2% with WTI above $104 |
| Private credit | Refinancing costs up ~200 basis points; defaults elevated | $150 billion in maturities by 2027 (Bloomberg) |
Bank stocks declined through Q1 as the hold reduced forward net interest income expectations. Consumers face the squeeze from both directions: oil above $100 hitting household budgets while borrowing costs remain elevated.
The private credit pressure warrants particular attention. Bloomberg reports approximately $150 billion in private credit maturities approaching by 2027, with refinancing costs up roughly 200 basis points at a time when Moody’s estimates a 7.9% probability of default for US corporate private credit.
According to the Wall Street Journal (30 April 2026), leveraged loan spreads have widened to 550 basis points, the widest since 2023, and approximately 10% of business development companies (BDCs, listed funds that lend to middle-market companies) now trade at discounts to net asset value.
This is not yet a systemic event. But the combination of a $150 billion maturity pipeline, elevated default rates, and a Fed unable to deliver rate relief creates a pressure test for an asset class that expanded substantially during the low-rate era. The BDC discount is a market-based stress signal, not just analyst modelling.
For investors tracking the BDC discount as a stress signal, our dedicated guide to BDC NAV erosion in the 2026 leveraged loan market names the specific funds cutting dividends, documents the K-shaped divide opening between high-rated and CCC-rated debt, and explains why the headline leveraged loan index is masking a more severe deterioration in lower-rated credit than aggregate spreads suggest.
Most US investors have not been watching Japanese government bond (JGB) yields. That is about to change.
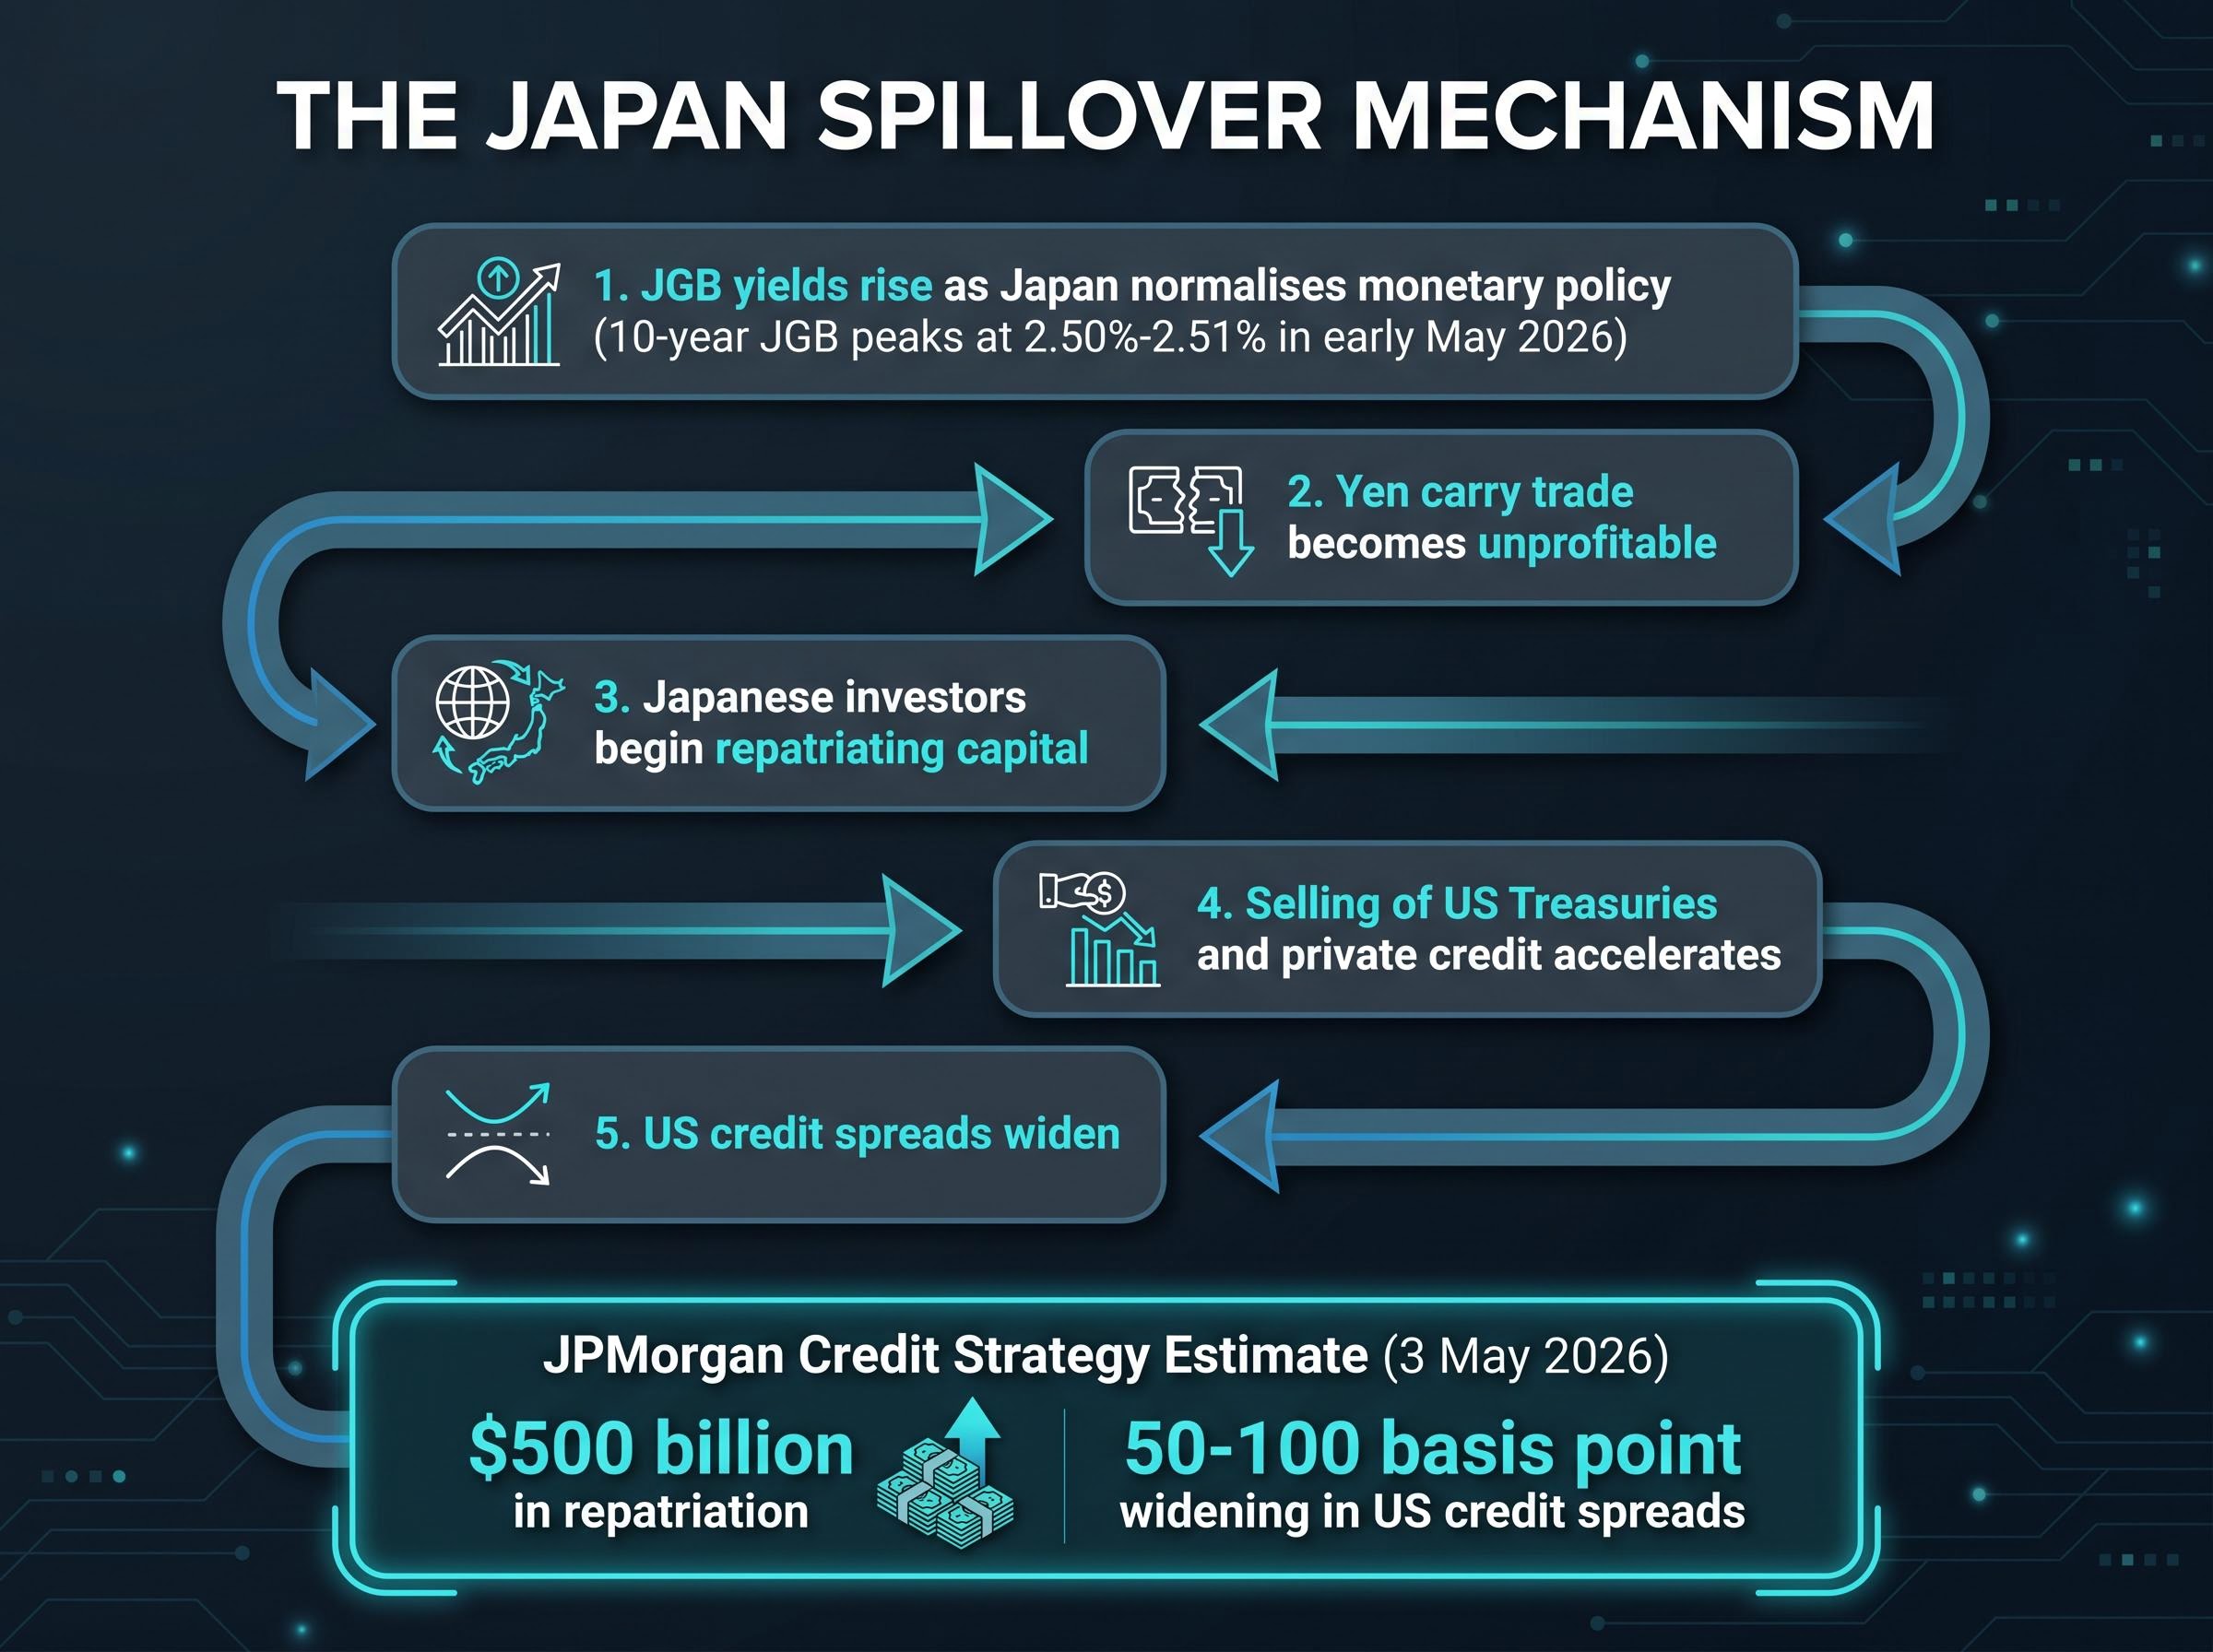
The 10-year JGB yield peaked at approximately 2.50%-2.51% in early May 2026 (per Trading Economics and Yomiuri Shimbun), with the 30-year near 4% and the 40-year near 3.91%. These levels represent a significant departure from the near-zero era that funded global carry trades for over a decade.
The spillover into US markets follows a specific sequence:
JPMorgan Credit Strategy (3 May 2026) estimates $500 billion in repatriation from US private credit and Treasuries as the yen carry trade unwinds, projecting 50-100 basis point widening in US credit spreads.
Reuters (4 May 2026) reports that private credit collateralised loan obligations (CLOs, investment vehicles that bundle corporate loans into tradable securities) have seen approximately 15% drops in net asset value since the January JGB surge. This compounds the domestic private credit deterioration described above.
ING Think has characterised JGB yield levels as “not overly elevated,” offering a more measured view of spillover risk. The debate is legitimate, but JPMorgan’s $500 billion estimate represents the tail risk that warrants monitoring.
The accumulated weight of the prior sections points to a Fed constrained through at least Q3 2026. That constraint is not a reason for inaction in portfolios; it is a map of where valuation dislocations have accumulated.
The most visible dislocation is sectoral. Energy advanced approximately 34% in 2026 through 23 March (per Morningstar), moving from the most undervalued sector to the most overvalued. The trade has run its course for investors who entered early.
Equity mispricing of geopolitical risk has been amplified by algorithmic trading models that treat oil supply shocks as routine dips rather than structural disruptions, creating an artificial elevation in index levels that physical supply chain realities and sustained crude above $110 will eventually force the market to reprice.
Meanwhile, the sectors that absorbed the most damage from prolonged higher rates are now priced at historically rare discounts:
Four signals emerge for portfolio positioning:
The April 2026 CPI report, scheduled for release on 12 May by the Bureau of Labor Statistics, is the nearest catalyst. A hotter-than-expected print above the already elevated core PCE would push the September cut timeline further out, reinforcing the hold and extending the constraint.
Kevin Warsh’s nomination as Fed Chair (with Jerome Powell’s term ending 15 May 2026) adds a second layer of policy uncertainty. Market interpretation of the nomination has leaned hawkish; S&P 500 futures fell approximately 0.18%-0.20% on 4 May in response. A restraint-biased posture from Warsh during confirmation hearings would reinforce the hold and potentially push any easing into late 2026 or beyond.
The Fed is constrained by forces that pull in opposite directions: positive but decelerating growth, inflation 60% above target, oil prices reinforcing price pressures, and cross-border capital flows from Japan tightening credit conditions from the outside in. That constraint will persist at minimum through Q3 2026 based on current market pricing and FOMC guidance.
The analytical uncertainty is real. Q1 GDP at +2.0% moderates the acute stagflation case. But Goldman Sachs projects H2 growth of just 0.8%, and JPMorgan’s 35% stagflation probability keeps the risk live and directional.
Goldman Sachs projects US GDP growth of just 0.8% for the second half of 2026, a forward risk the market is only beginning to price.
The sectors and styles that have absorbed the most valuation damage from this environment, technology, growth, and small-cap, are now priced for a continuation of the worst-case scenario. Investors who understand the mechanics of the macro bind are better positioned to identify where that pricing has become excessive and where it still has room to deteriorate.
This article is for informational purposes only and should not be considered financial advice. Investors should conduct their own research and consult with financial professionals before making investment decisions. Past performance does not guarantee future results. Financial projections referenced are subject to market conditions and various risk factors.
As of the May 2026 FOMC meeting, the federal funds rate target range sits at 3.50%-3.75%, where it has remained unchanged through five consecutive holds since the last adjustment.
Stagflation describes a condition where inflation stays persistently above target while economic growth stalls, forcing the Fed into a policy trap where neither cutting nor hiking rates is a clean option, which tends to compress valuations across rate-sensitive equity sectors.
Rising JGB yields are unwinding the yen carry trade, prompting Japanese investors to repatriate capital by selling US Treasuries and private credit assets; JPMorgan estimates up to $500 billion in repatriation could widen US credit spreads by 50-100 basis points.
According to Morningstar data as of 23 March 2026, technology trades at a 23% discount to fair value, growth stocks broadly at a 21% discount, and small-cap equities at a 17% discount, levels seen less than 5% of the time since 2011.
The private credit maturity wall refers to approximately $150 billion in private credit loans maturing by 2027 that must be refinanced at rates roughly 200 basis points higher than when they were issued, at a time when Moody's estimates a 7.9% default probability for US corporate private credit.