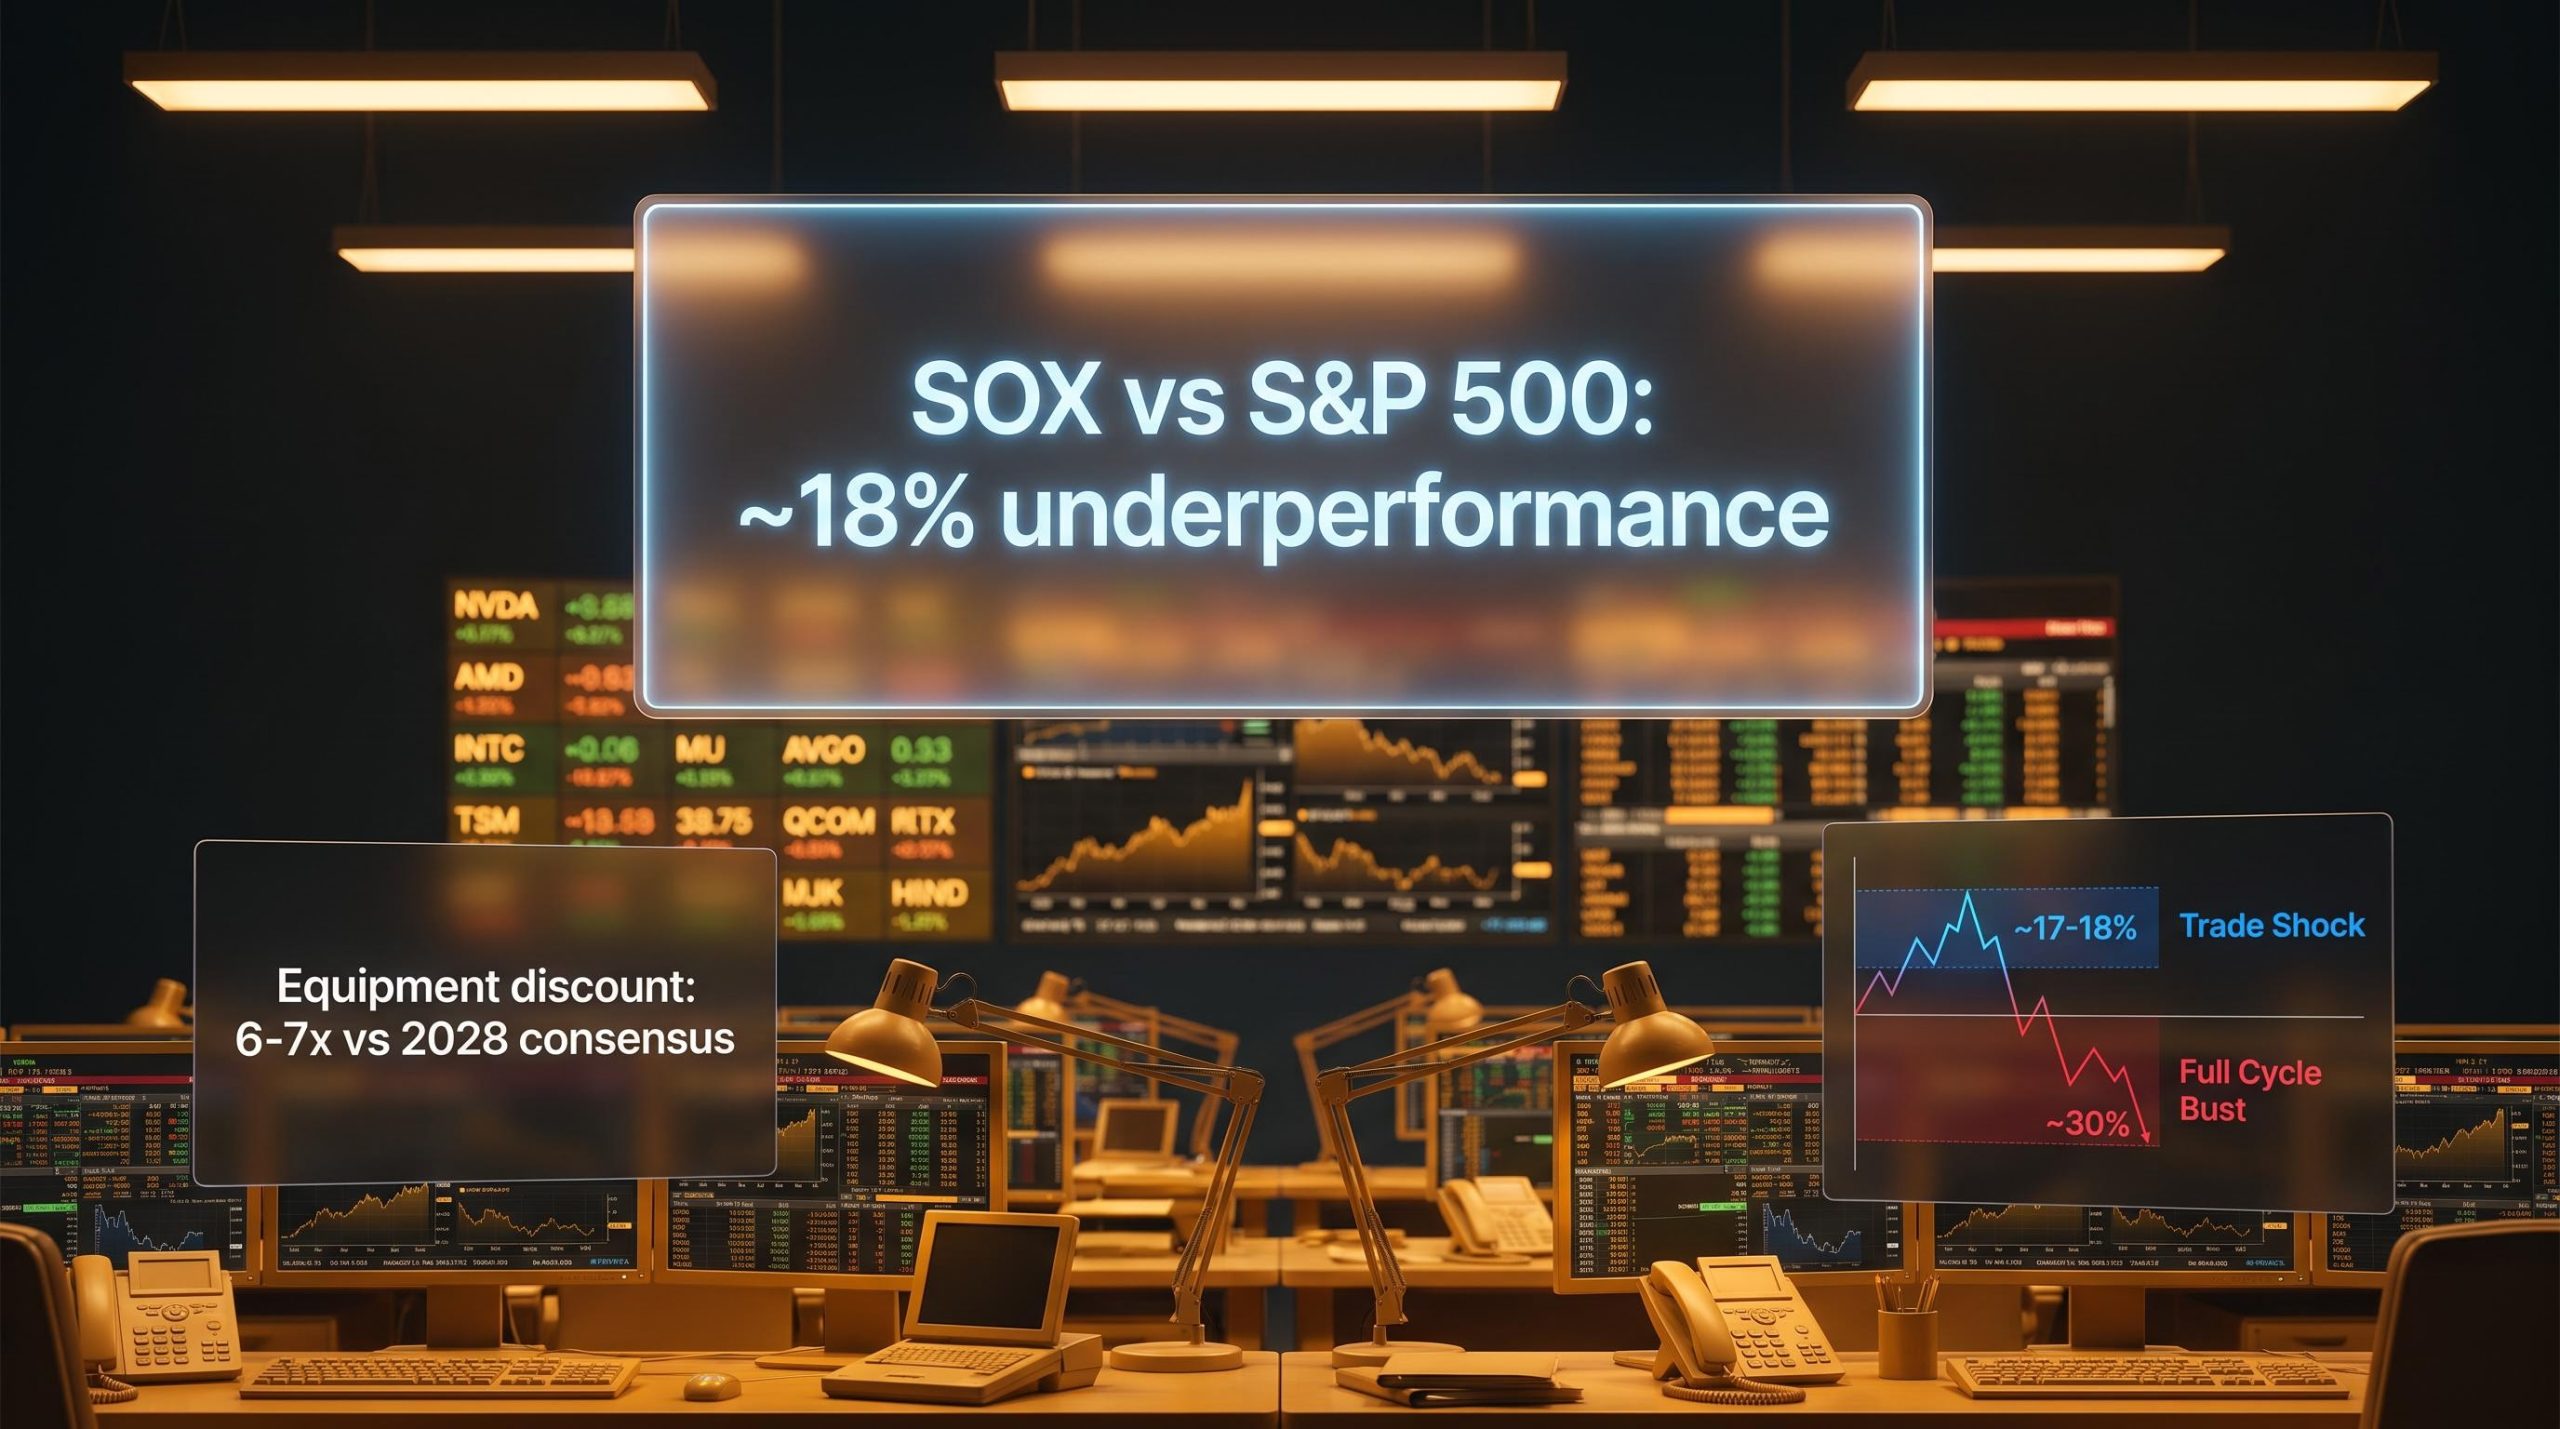
Bank of America published a research note this morning arguing that chip stocks are sitting at a rare entry point, and the argument is built not on sentiment but on a specific data comparison most retail investors have never encountered.
The Philadelphia Semiconductor Index (SOX), which tracks the largest U.S.-listed chip companies, has underperformed the S&P 500 by roughly 18% peak-to-trough. That number matters because BofA has mapped it against every significant semiconductor drawdown of the past 15 years and found it lands in a very specific historical zone: trade-tension shock territory, not full cyclical bust territory. The distinction carries real implications for whether the current selloff is a buying window or a warning.
Here is a breakdown of BofA’s analytical framework, the data behind the entry point call, and the specific conditions you should monitor to know whether the thesis is holding or breaking down.
What Bank of America actually said, and why it matters today
The note was published on Monday 27 July 2026, led by analyst Didier Scemama, BofA’s European semiconductor coverage lead, with U.S. semiconductor contributions from Vivek Arya. That matters because this is not an anonymous desk call. It carries named institutional provenance from two of the bank’s senior semiconductor analysts.
BofA’s core position: the market is pricing in a cyclical collapse that underlying demand data does not support. Sentiment and positioning have moved faster than fundamentals. The bank characterises the current selloff explicitly as an enhanced buying opportunity.
BofA’s current note is not an isolated contrarian view: the semiconductor bubble narrative has faced sustained pushback from institutional research throughout 2026, with free cash flow yield data, earnings revision momentum, and positioning well below 2017 cycle peaks each cited as evidence that fundamentals are more durable than the selloff implies.
“A summer reset, not a fundamental reversal.”
The structural demand anchors BofA cites are specific: more than two years of forward project visibility, a wave of new chip factories coming online, and sustained demand from artificial intelligence workloads, high-bandwidth memory (HBM, the specialised memory chips AI processors require), and gate-all-around (GAA) transistors, the next-generation chip architecture replacing current designs.
What separates this from a generic contrarian call is the framework behind it. BofA is making a regime classification argument: the 18% drawdown is not just a number, it is a data point that lands in a specific historical cluster, and which cluster it belongs to determines whether it is a buy signal or a midpoint on the way to something worse.
When big ASX news breaks, our subscribers know first
The historical drawdown map that anchors the call
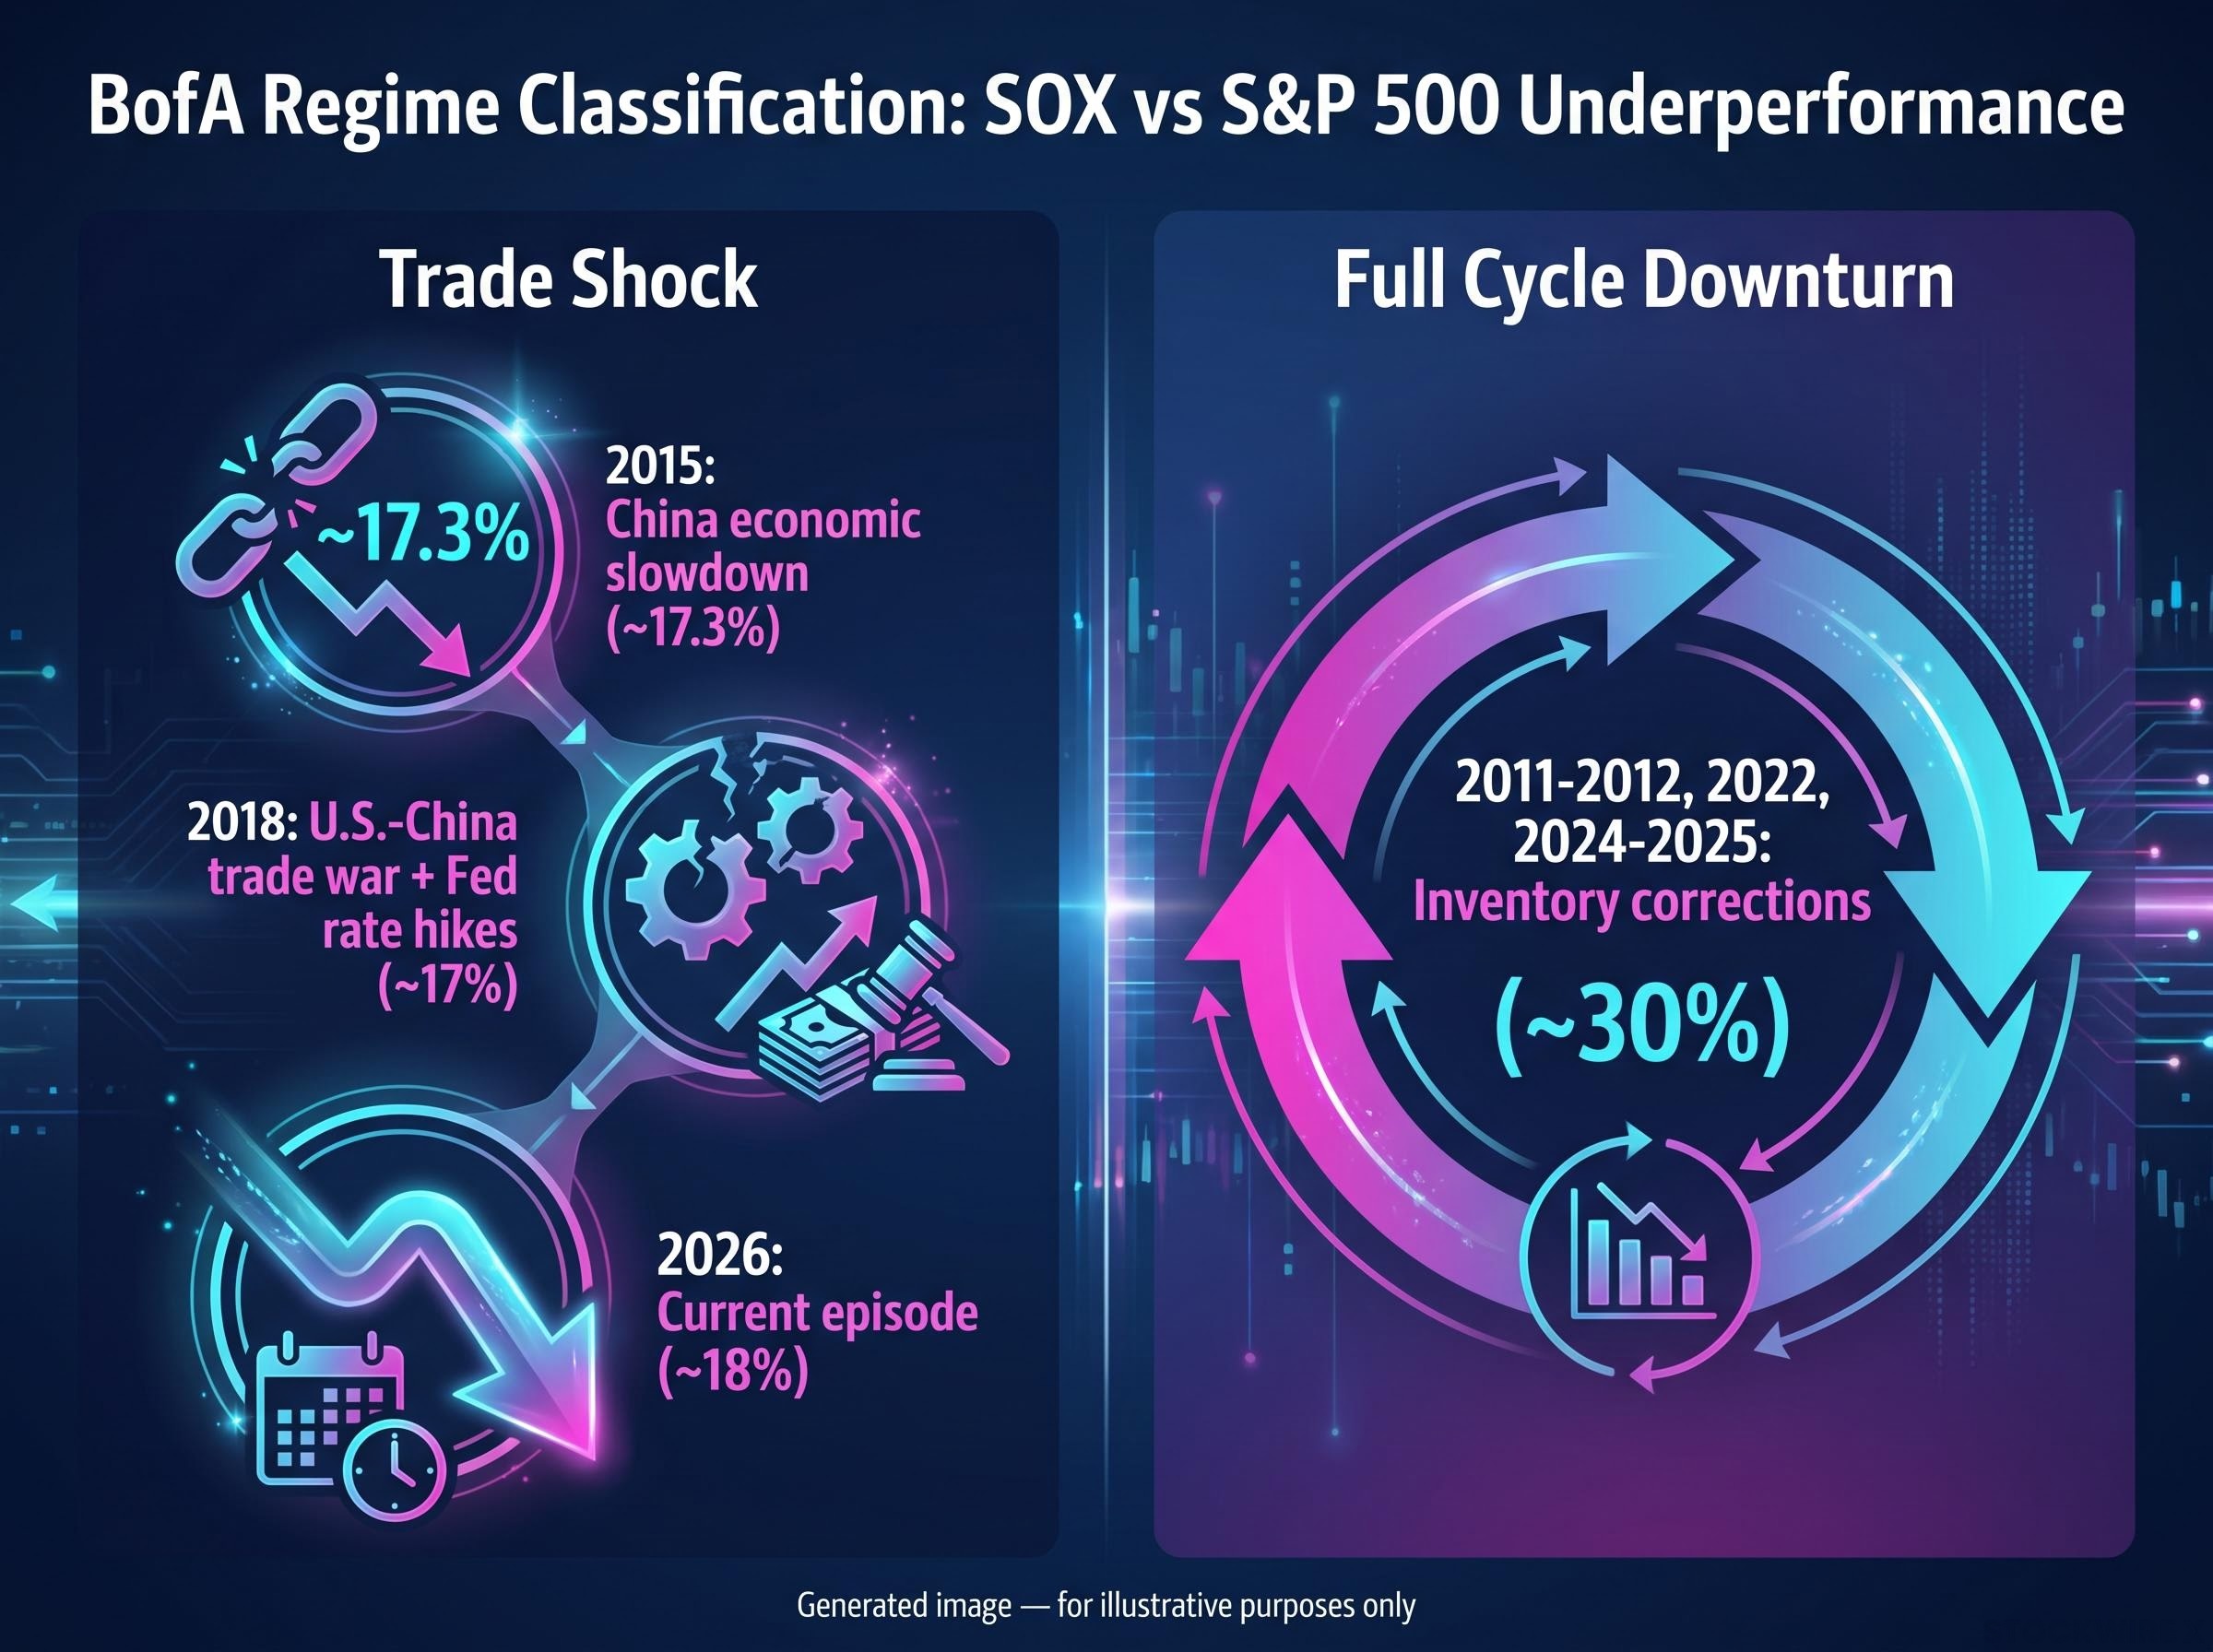
BofA’s analytical spine is a comparison of past semiconductor drawdowns, measured by how much the SOX underperformed the S&P 500 in each episode. The data separates into two distinct clusters.
The first cluster is trade-tension and macro-shock episodes, externally driven selloffs where the semiconductor industry itself was not fundamentally broken. The second cluster is full cyclical downturns, inventory-driven busts with broad demand destruction and sustained earnings collapses.
The gap between the two clusters is significant.
| Episode | Year | SOX vs S&P 500 underperformance | BofA classification |
|---|---|---|---|
| China economic slowdown | 2015 | ~17.3% | Trade shock |
| U.S.-China trade war + Fed rate hikes | 2018 | ~17% | Trade shock |
| Inventory corrections | 2011-2012, 2022, 2024-2025 | ~30% | Full cycle downturn |
| Current episode | 2026 | ~18% | Trade shock (BofA view) |
The pattern is clear in the numbers. Trade-shock episodes cluster in the mid-to-high teens. Full cyclical downturns cluster around 30%. The current 18% reading sits squarely in the trade-shock zone.
What the 18% reading signals now
BofA’s argument depends on the current episode staying in that trade-shock cluster. At 18%, the framework says this is a recoverable shock driven by trade friction, export restriction fears, and sentiment compression, not a structural demand collapse.
The figure to watch is the trajectory. If SOX underperformance stays near 18% or begins to recover, BofA’s regime classification holds. If it migrates toward 30%, the classification shifts from trade shock to full cycle downturn, and the entry point thesis would require serious reassessment. That distinction is the difference between buying the dip and catching a falling knife.
Why valuation compression makes the timing unusually compelling
The drawdown framework is one lens. The valuation data is a second, independent lens, and BofA argues both are pointing in the same direction.
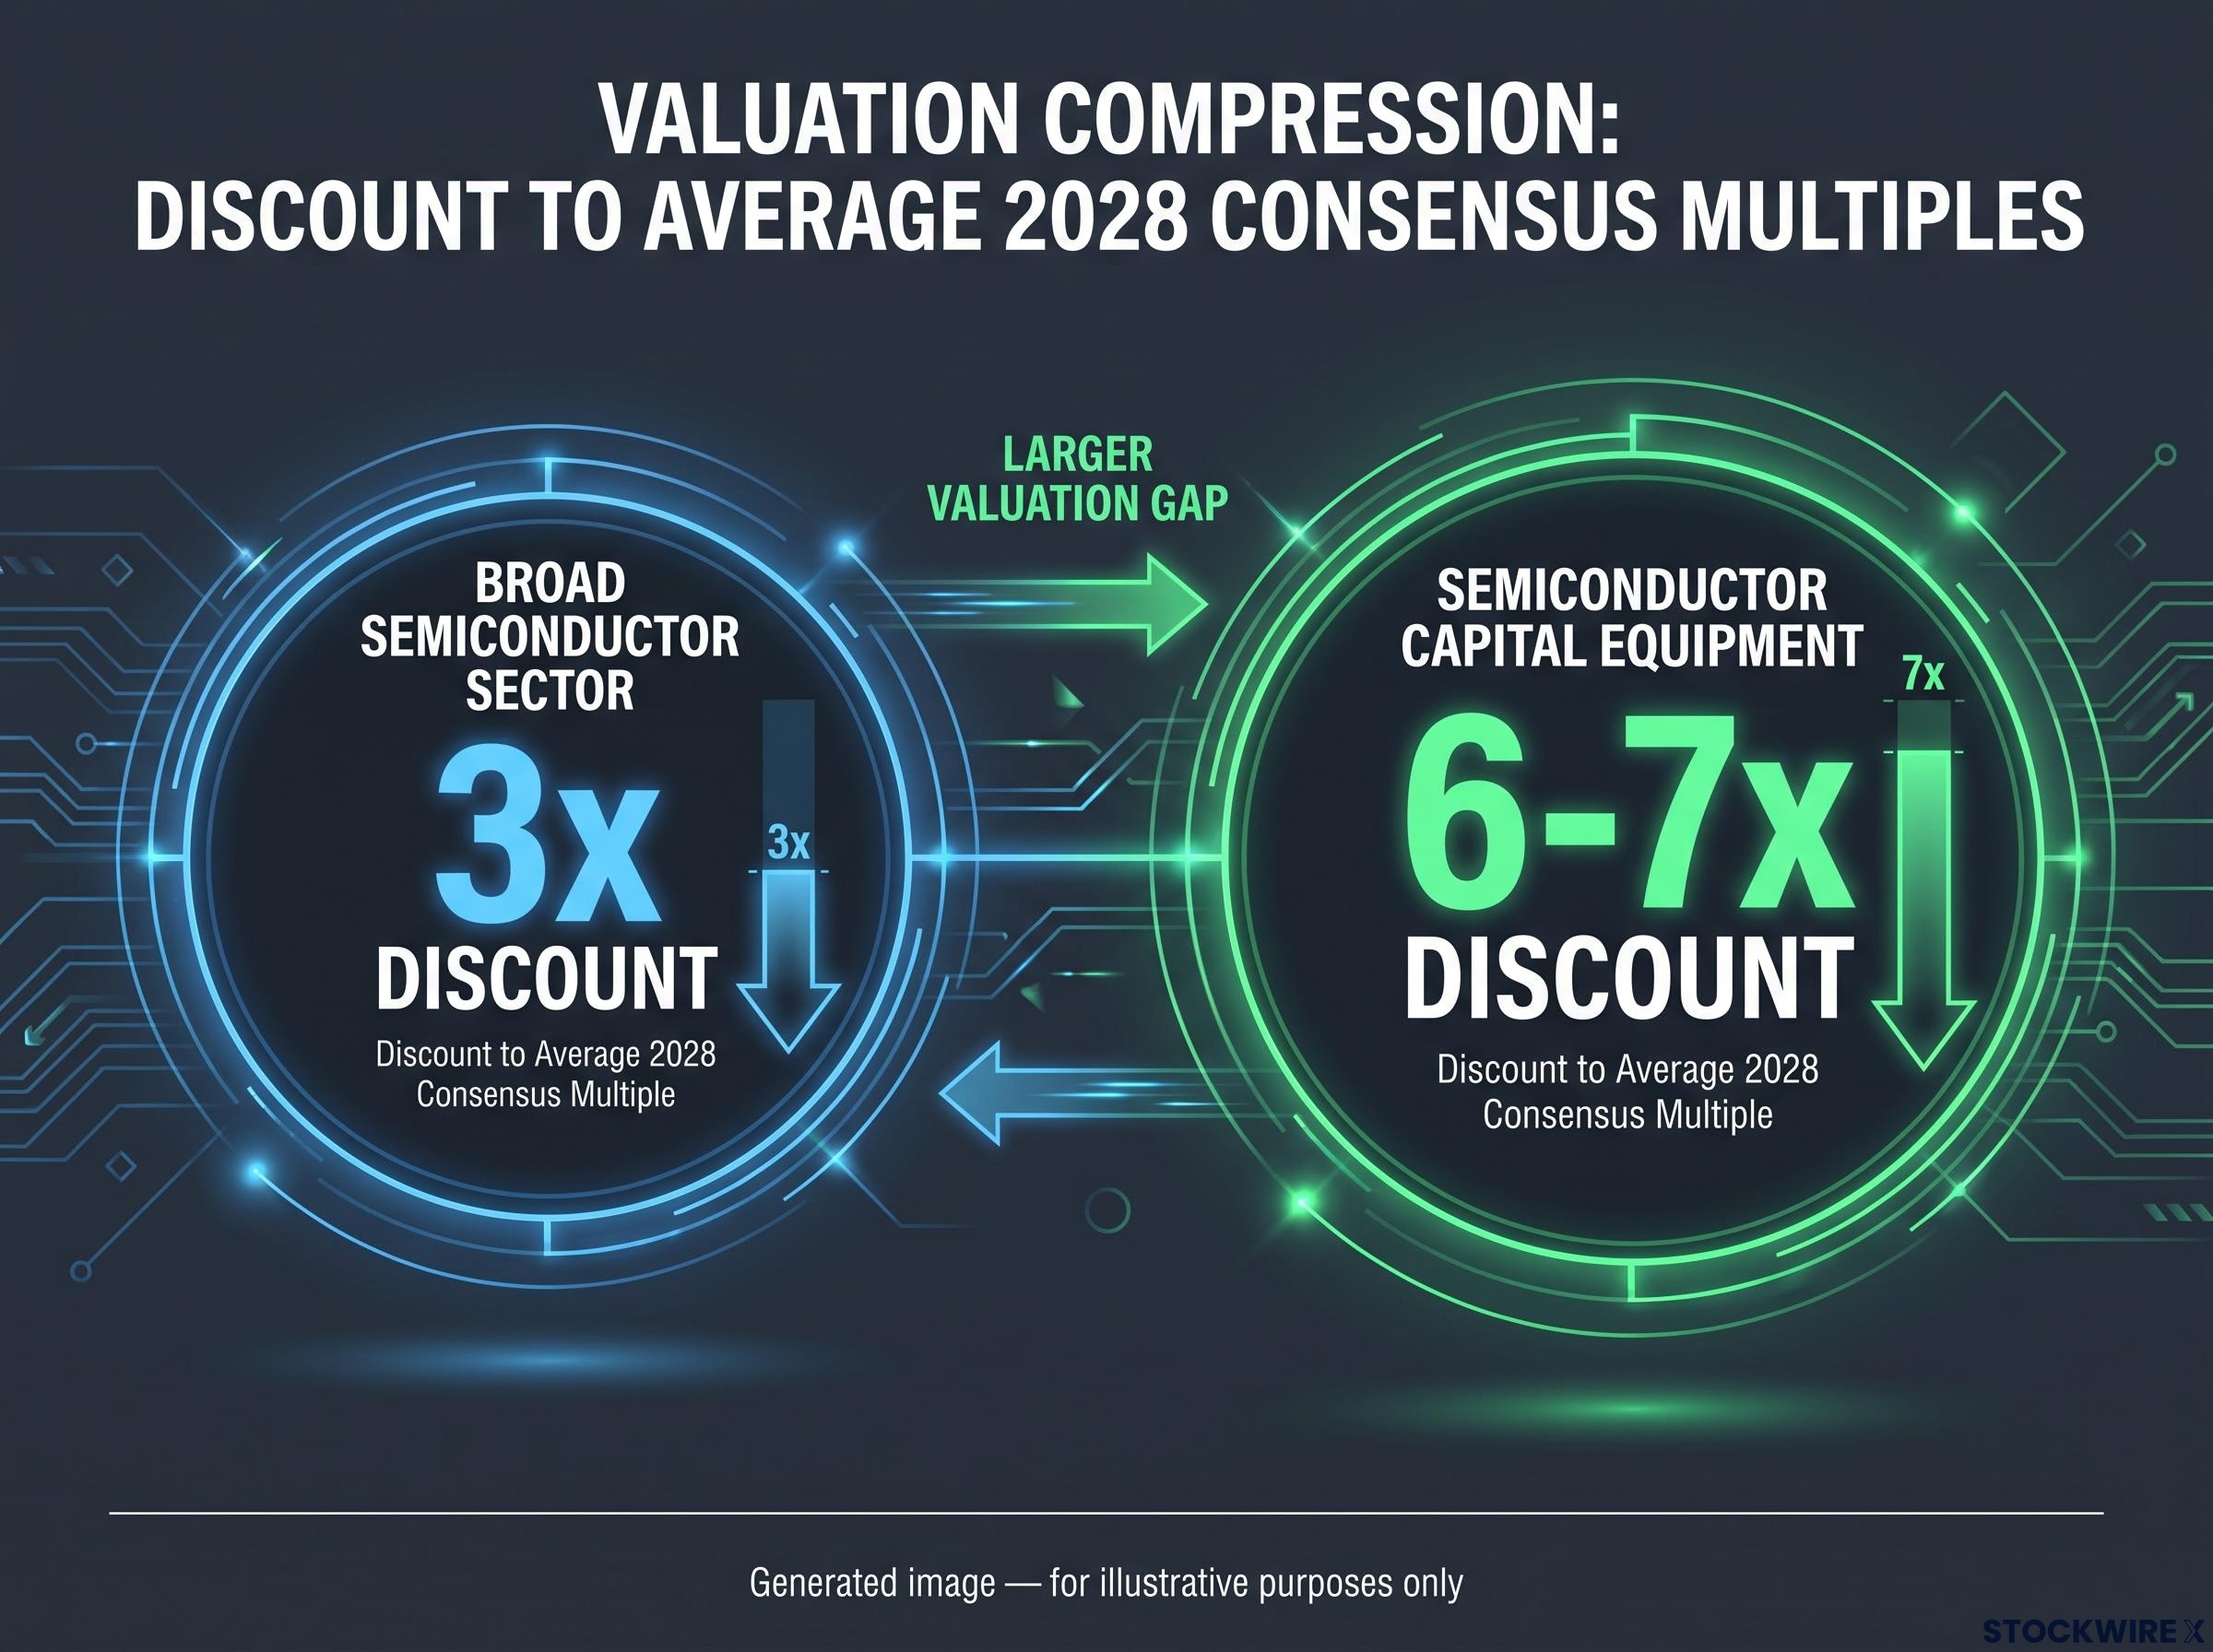
According to BofA’s analysis, the broader chip sector is currently valued at roughly a 3x discount to where average 2028 consensus multiples would place it. That discount is even more pronounced within semiconductor capital equipment, where the gap widens to approximately 6-7x relative to average 2028 consensus figures.
- Broad semiconductor sector: roughly 3x below average 2028 consensus multiples, a reading that implies the market has already baked in a substantial degree of pessimism across the sector
- Semiconductor capital equipment names: a 6-7x gap to average 2028 consensus multiples, pointing to an even heavier concentration of bearish pricing within the equipment sub-segment
The 6-7x equipment discount is the most actionable data point in BofA’s note for investors specifically evaluating capital equipment exposure. It quantifies how much pessimism is already priced in relative to multi-year earnings projections.
The valuation discount argument is only as durable as the 2027-2028 earnings estimates it is measured against. If consensus earnings are revised materially downward, the apparent discount shrinks or disappears entirely.
That conditionality matters. BofA is not claiming chip stocks are cheap in absolute terms. The bank is arguing they are cheap relative to a specific earnings trajectory, and the thesis holds only if that trajectory remains credible.
The case for semiconductor capital equipment over chip designers
BofA’s preference within the sector is specific: equipment makers over chip designers. The reasoning is structural, not tactical.
Semiconductor capital equipment companies, the firms that build the machines used to manufacture chips, derive their revenues from multi-year fabrication plant (fab) build-outs and wafer fab equipment (WFE) budgets. Those contracts are signed years in advance. Chip designers, by contrast, are more exposed to near-term pricing, unit shipment volatility, and competitive dynamics that can shift quarter to quarter.
The demand floor BofA cites is made concrete in current capex commitments: TSMC raised its 2026 guidance to $60-64 billion explicitly attributing the increase to AI demand, Intel’s tool purchases grew 40% year-over-year with 2027 spending flagged as meaningfully greater, and Tesla’s Terafab represents a third independent demand stream, all converging in the same window that fab build-out contracts are translating into equipment order backlogs.
| Dimension | Equipment stocks | Chip designers |
|---|---|---|
| Revenue visibility | Multi-year fab build-out contracts and WFE budgets | Near-term chip pricing and unit shipments |
| Key demand driver | AI data centre fabs, HBM, GAA transistor adoption | End-market demand, product cycles, competition |
| Primary risk factor | Capex cycle cancellations or deferrals | Pricing pressure, sentiment-driven earnings swings |
The $250 billion WFE forecast and what drives it
BofA’s projection has WFE spending hitting a minimum of $250 billion by 2028, a trajectory that would require roughly 30% year-over-year growth sustained across two consecutive years. That projection is anchored by three structural demand drivers: AI data centre fab construction, HBM memory demand, and GAA transistor adoption across the industry.
SEMI’s mid-year equipment forecast projects global semiconductor equipment sales reaching a record $229.5 billion by 2028, with the WFE segment alone expanding to $200 billion, a trajectory that provides independent industry-body corroboration for BofA’s $250 billion WFE floor projection.
Recent capex guidance upgrades from both TSMC and Intel are cited by BofA as corroborating evidence from the supply chain. The bank also points to a claimed five-year foundry contract between Samsung and Broadcom worth $200 billion as an additional demand anchor, while noting this deal has been described as “reported” and has not been independently confirmed.
For investors weighing equipment stocks against chip designers, BofA’s argument is that the multi-year fab build-out provides a demand floor that near-term sentiment cannot easily erode. That floor is visible in signed contracts and announced capex plans, which is why the bank views equipment names as offering the greatest investment visibility within the sector.
How to stress-test BofA’s thesis before acting on it
BofA’s note is more useful than most institutional research for one reason: it contains its own falsification conditions. The bank names three scenarios under which the bullish call would break:
- Trade frictions escalate into outright sanctions or broad bans beyond current scope
- Major hyperscalers and original equipment manufacturers slash AI capital expenditure rather than merely normalising it
- Current cycle earnings are materially more overestimated than BofA’s models assume
Those are not throwaway disclaimers. They are the conditions that would shift the regime classification from trade shock to full cycle downturn. Monitoring them is how you determine whether the thesis is holding.
Trade escalation risk is the first and most consequential of BofA’s three falsification conditions, and it cannot be assessed without understanding the structural fault lines that survive bilateral summits: AI chip export controls are grounded in national-security law with bipartisan Congressional backing, placing them outside trade negotiators’ jurisdiction and making them durable regardless of diplomatic progress on tariffs or agricultural purchases.
BofA’s framework implies three specific signals to watch, in order of priority:
- SOX vs S&P 500 underperformance trajectory: Is the reading staying near 18%, or migrating toward 30%? The direction matters more than the current level.
- Consensus earnings and capex revision direction for 2027-2028: Are estimates holding steady, or are analysts cutting numbers? The valuation discount evaporates if the earnings it is measured against come down.
- Equipment order backlogs: For any specific equipment names under consideration, are orders and backlogs consistent with the multi-year fab build-out thesis?
BofA’s analysts have a clear bullish prior on semiconductors and AI. This framework reflects one institutional lens, not a certainty. The call depends materially on trade escalation remaining contained and multi-year earnings estimates proving durable.
The framework is most useful to you not as a buy signal to accept passively but as a stress-testing checklist. If any of those three monitoring signals shifts materially, the entry point argument weakens and position sizing logic should be revisited.
What the data actually resolves, and what it leaves open
BofA has constructed a two-part argument: the drawdown regime classification places the current selloff in the trade-shock cluster, and the valuation compression, particularly the 6-7x equipment discount versus 2028 consensus multiples, suggests meaningful pessimism is already priced in. When both analytical lenses point in the same direction simultaneously, that alignment is worth taking seriously.
What the framework resolves:
- The current 18% underperformance fits a specific historical pattern with identifiable precedents
- The valuation discount, especially in equipment names, quantifies how much downside the market has already priced
- The thesis has named falsification conditions, giving you a structured way to monitor it
What it cannot resolve: the future trajectory of trade tensions, whether consensus earnings hold through 2027-2028, and the speed at which any deterioration would show up in the monitoring signals.
This call was made on 27 July 2026, and its durability depends on how trade and earnings dynamics develop from here. BofA has given you a principled framework for deciding not just whether to consider entry, but when to reassess. The decision still belongs to you.
For investors wanting a structured exit and de-risking framework to pair with this entry analysis, our dedicated guide to semiconductor cycle positioning covers the five-indicator framework for identifying cycle peaks, the graduated de-risking sequence across memory, foundry, and equipment names, and the specific supply wave timeline BofA’s own capex data implies for 2027-2029.
This article is for informational purposes only and should not be considered financial advice. Investors should conduct their own research and consult with financial professionals before making investment decisions. These statements are speculative and subject to change based on market developments and company performance.