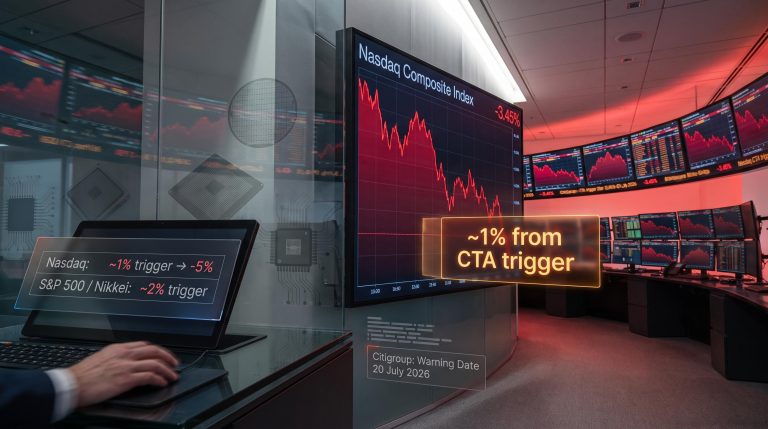
Goldman Sachs has identified what amounts to a tripwire sitting beneath the surface of U.S. equity markets: trend-following funds holding $93 billion in net long equity exposure that could flip into more than $100 billion in mechanical selling if prices decline over the next month. The warning, published in early June 2026 and reported via Bloomberg, arrives while equity markets appear stable on the surface. Near-term projections show these funds still buying. The tension between that short-horizon calm and the one-month downside scenario is what makes the Goldman note significant. What follows breaks down the core finding, the near-term buying picture, how commodity trading advisors (CTAs) operate, why the one-month asymmetry is the number to watch, and what this positioning dynamic means for anyone holding U.S. equities right now.
Goldman Sachs flags $100 billion in potential selling lurking in trend-following funds
The numbers arrive first. Trend-following funds hold approximately $93 billion in net long global equity exposure as of early June 2026, according to Goldman Sachs. Of that total, roughly $34 billion is concentrated in S&P 500 futures specifically.
Over a one-month horizon, a prolonged market decline could trigger more than $100 billion in CTA selling, a figure that dwarfs what these funds would purchase in stable or rising conditions.
Goldman Sachs estimates that a sustained equity market decline over one month could produce more than $100 billion in mechanical CTA selling, concentrated heavily in U.S. equity futures.
Goldman characterised this as an asymmetric risk profile, not a prediction that selling will occur, but a scenario-based warning about the magnitude of mechanical positioning if price trends reverse. The note also observed that CTA positions grew by approximately $3 billion over the preceding week, meaning these funds were still adding to longs when the warning was published.
The CTA asymmetry Goldman identified in June 2026 sits within a broader market structure where contrarian sell signals across major banks were converging simultaneously, with Bank of America’s Bull and Bear Indicator hitting 8.0 for only the 18th time since 2002, a reading historically associated with average global equity declines of 2-3% within three months.
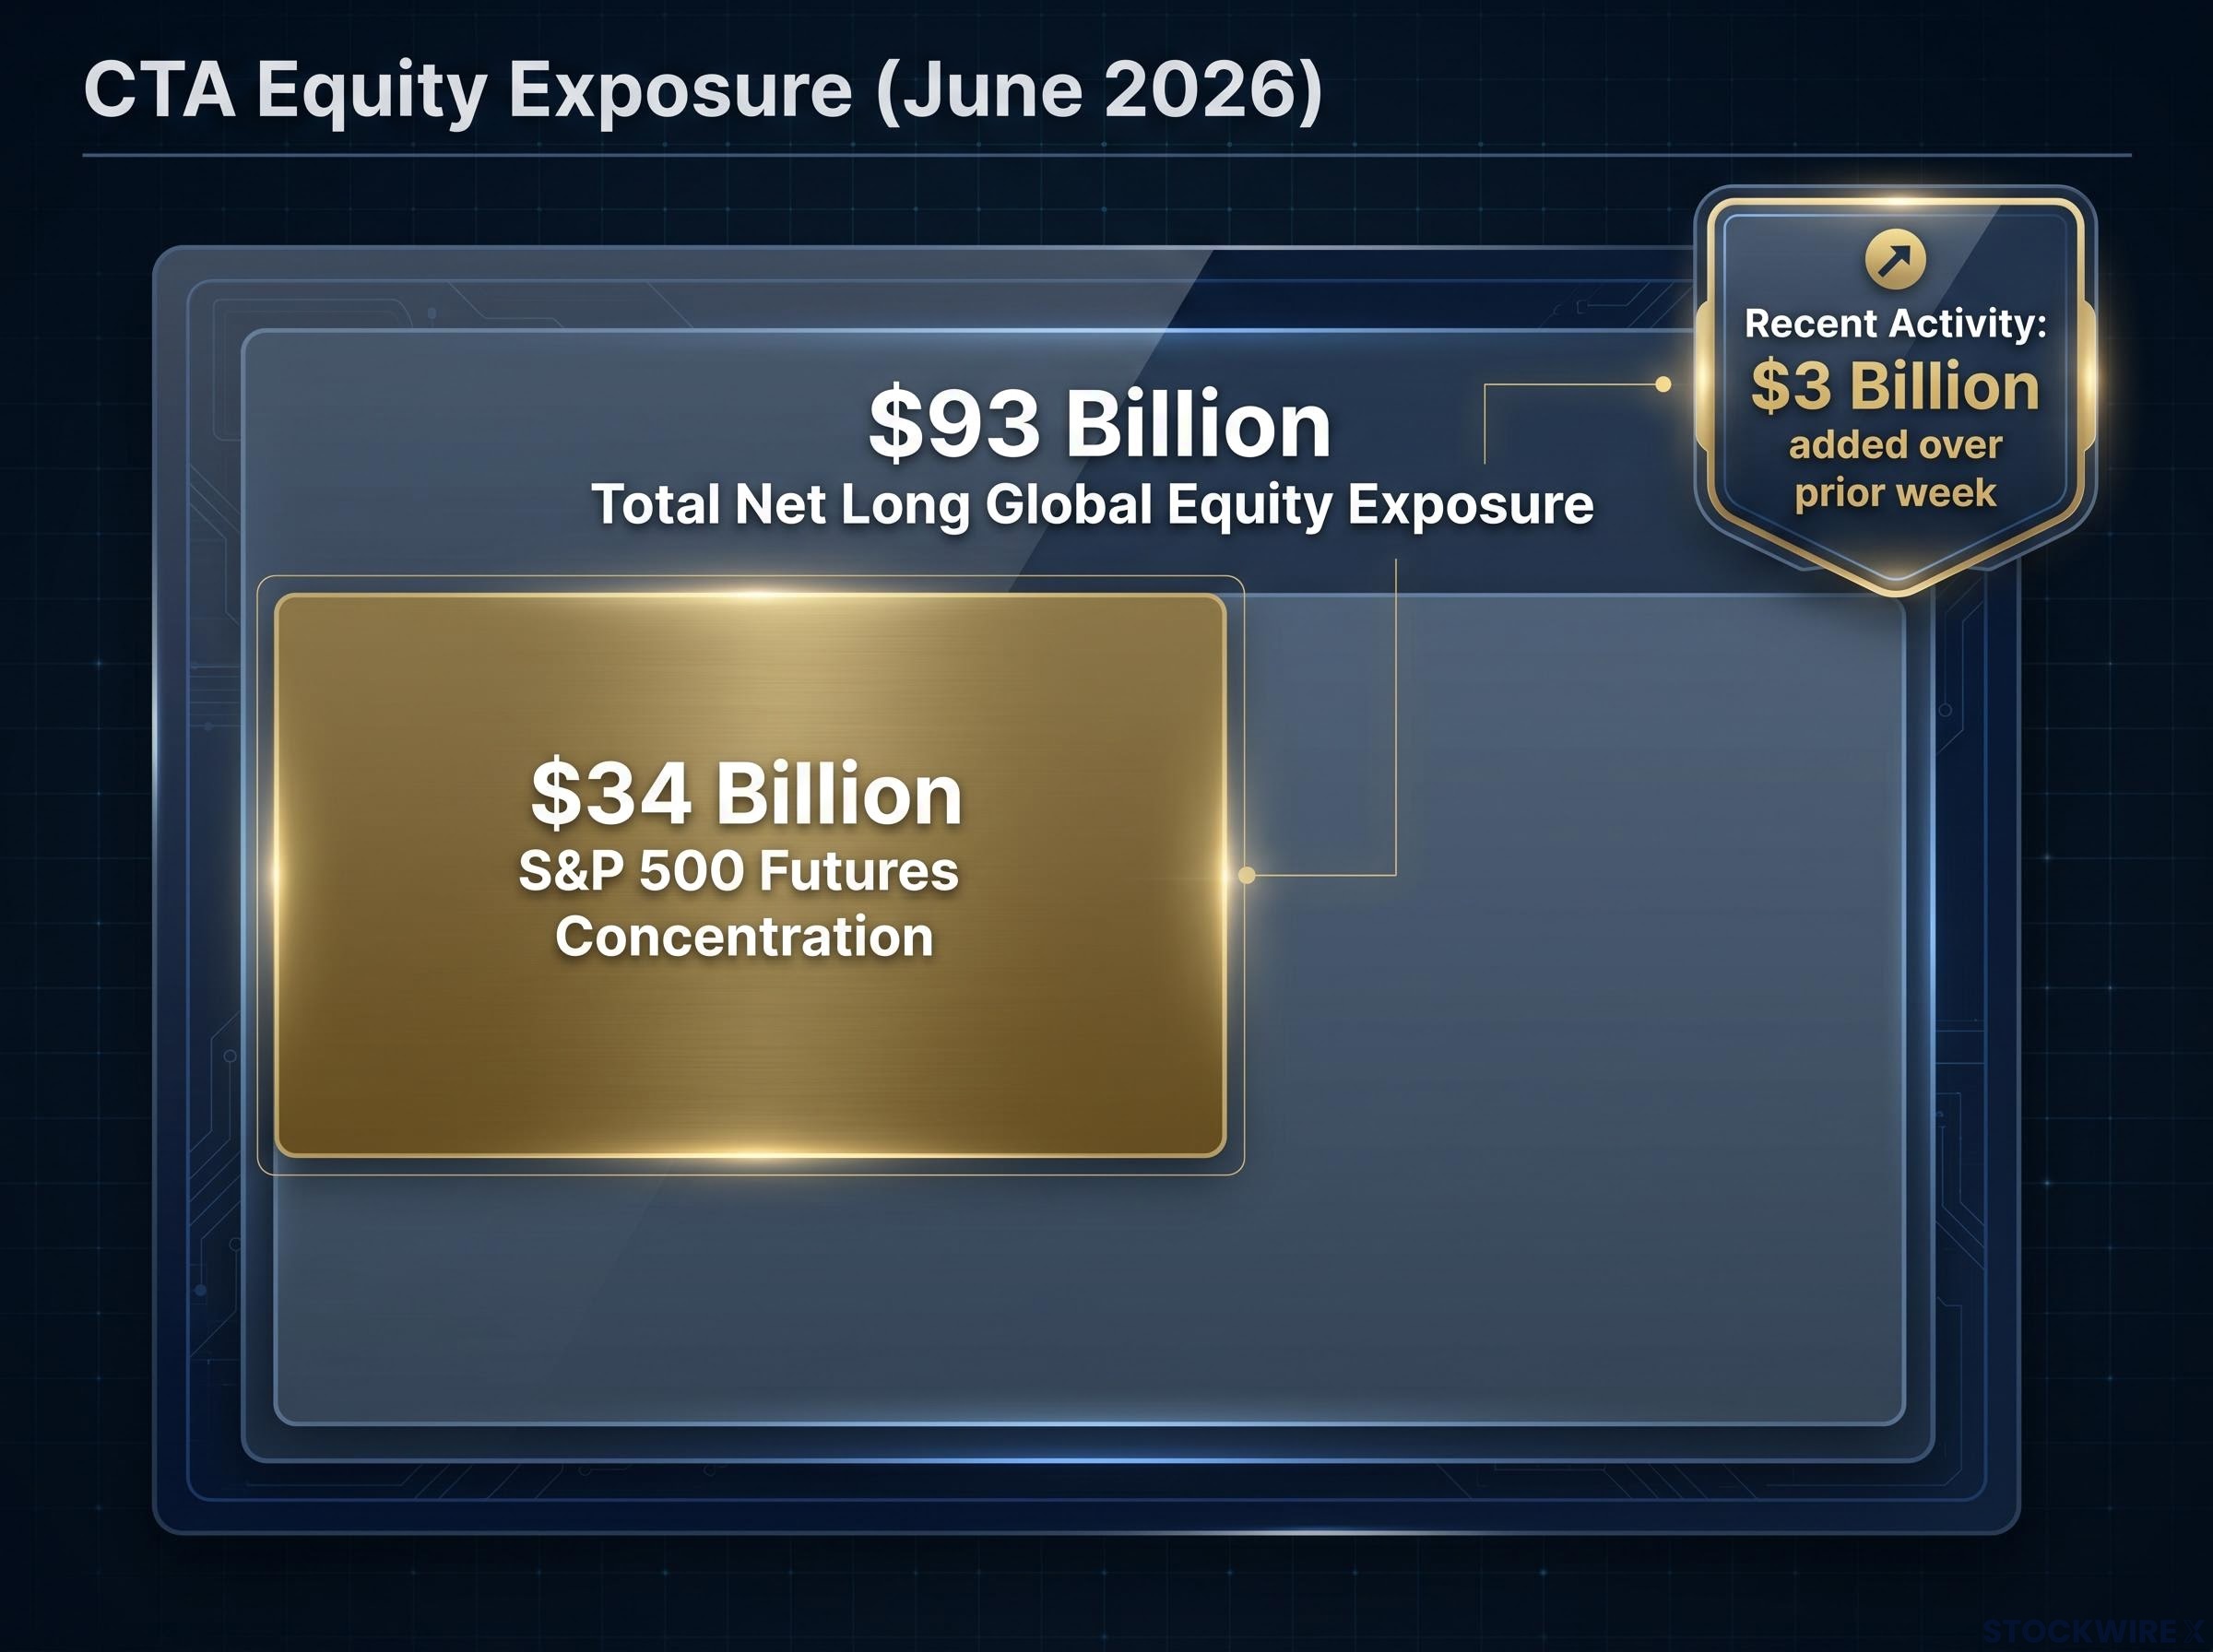
The three core exposure figures:
- $93 billion in total net long global equity exposure
- $34 billion allocated specifically to S&P 500 futures
- $3 billion added to positions over the prior week
When big ASX news breaks, our subscribers know first
The short-term picture looks different: CTAs are still buying
Over the next week, the outlook is benign. Goldman’s scenario modelling projects approximately $5.5 billion in CTA equity purchases if markets remain flat, and more than $7 billion in buying if equities rise. North American trend-following signals remain well above the thresholds that would trigger broad-based mechanical selling.
Extend the horizon to one month under stable or positive conditions, and the buying grows further. A flat market over one month produces an estimated $18 billion in CTA purchases. A continued equity advance could push buying past $37 billion.
| Scenario | Time Horizon | Estimated CTA Activity | Direction |
|---|---|---|---|
| Flat market | One week | $5.5 billion | Buying |
| Rising market | One week | $7 billion+ | Buying |
| Flat market | One month | $18 billion | Buying |
| Rising market | One month | $37 billion+ | Buying |
The near-term buying is real, but it is a function of current price trends remaining intact. The same positioning that generates support now is what produces the $100 billion overhang if the trend reverses.
What CTAs actually are, and why their mechanics matter to every equity investor
Commodity trading advisors are professional investment managers who run systematic, algorithm-driven strategies that follow price trends across futures markets, including equity index futures. They do not make discretionary calls on whether a company’s earnings justify its stock price. They buy when price trends rise above programmed thresholds, and they sell when trends fall below them.
The distinction matters because it explains the mechanical nature of the risk Goldman identified. CTA position changes are rule-driven. There is no portfolio manager overriding the signal on judgement.
The mechanical nature of CTA behaviour distinguishes it sharply from how most investors imagine professional fund management works: algorithm-driven trading systems execute against price signals without any portfolio manager overriding the output on judgement, which is precisely why simultaneous threshold breaches across funds can generate selling pressure that compounds faster than any discretionary selloff would.
How CTA signals translate into market-moving futures orders
CTAs operate primarily through futures contracts rather than direct equity purchases, making the S&P 500 futures market the transmission channel for their activity. The signal-to-execution sequence runs in a tight chain:
- Price trend is monitored continuously against programmed threshold levels
- Threshold is breached (either above for buying or below for selling)
- Algorithmic sell or buy order is generated automatically
- Futures contracts are sold or purchased into the market
- S&P 500 index price reflects the resulting buying or selling pressure
When multiple CTAs hold $34 billion in the same futures contract and their sell signals trigger at similar price levels, the concentration of simultaneous selling is what creates meaningful downward pressure on the index most retail portfolios track.
Why the one-month horizon reveals the real asymmetric risk
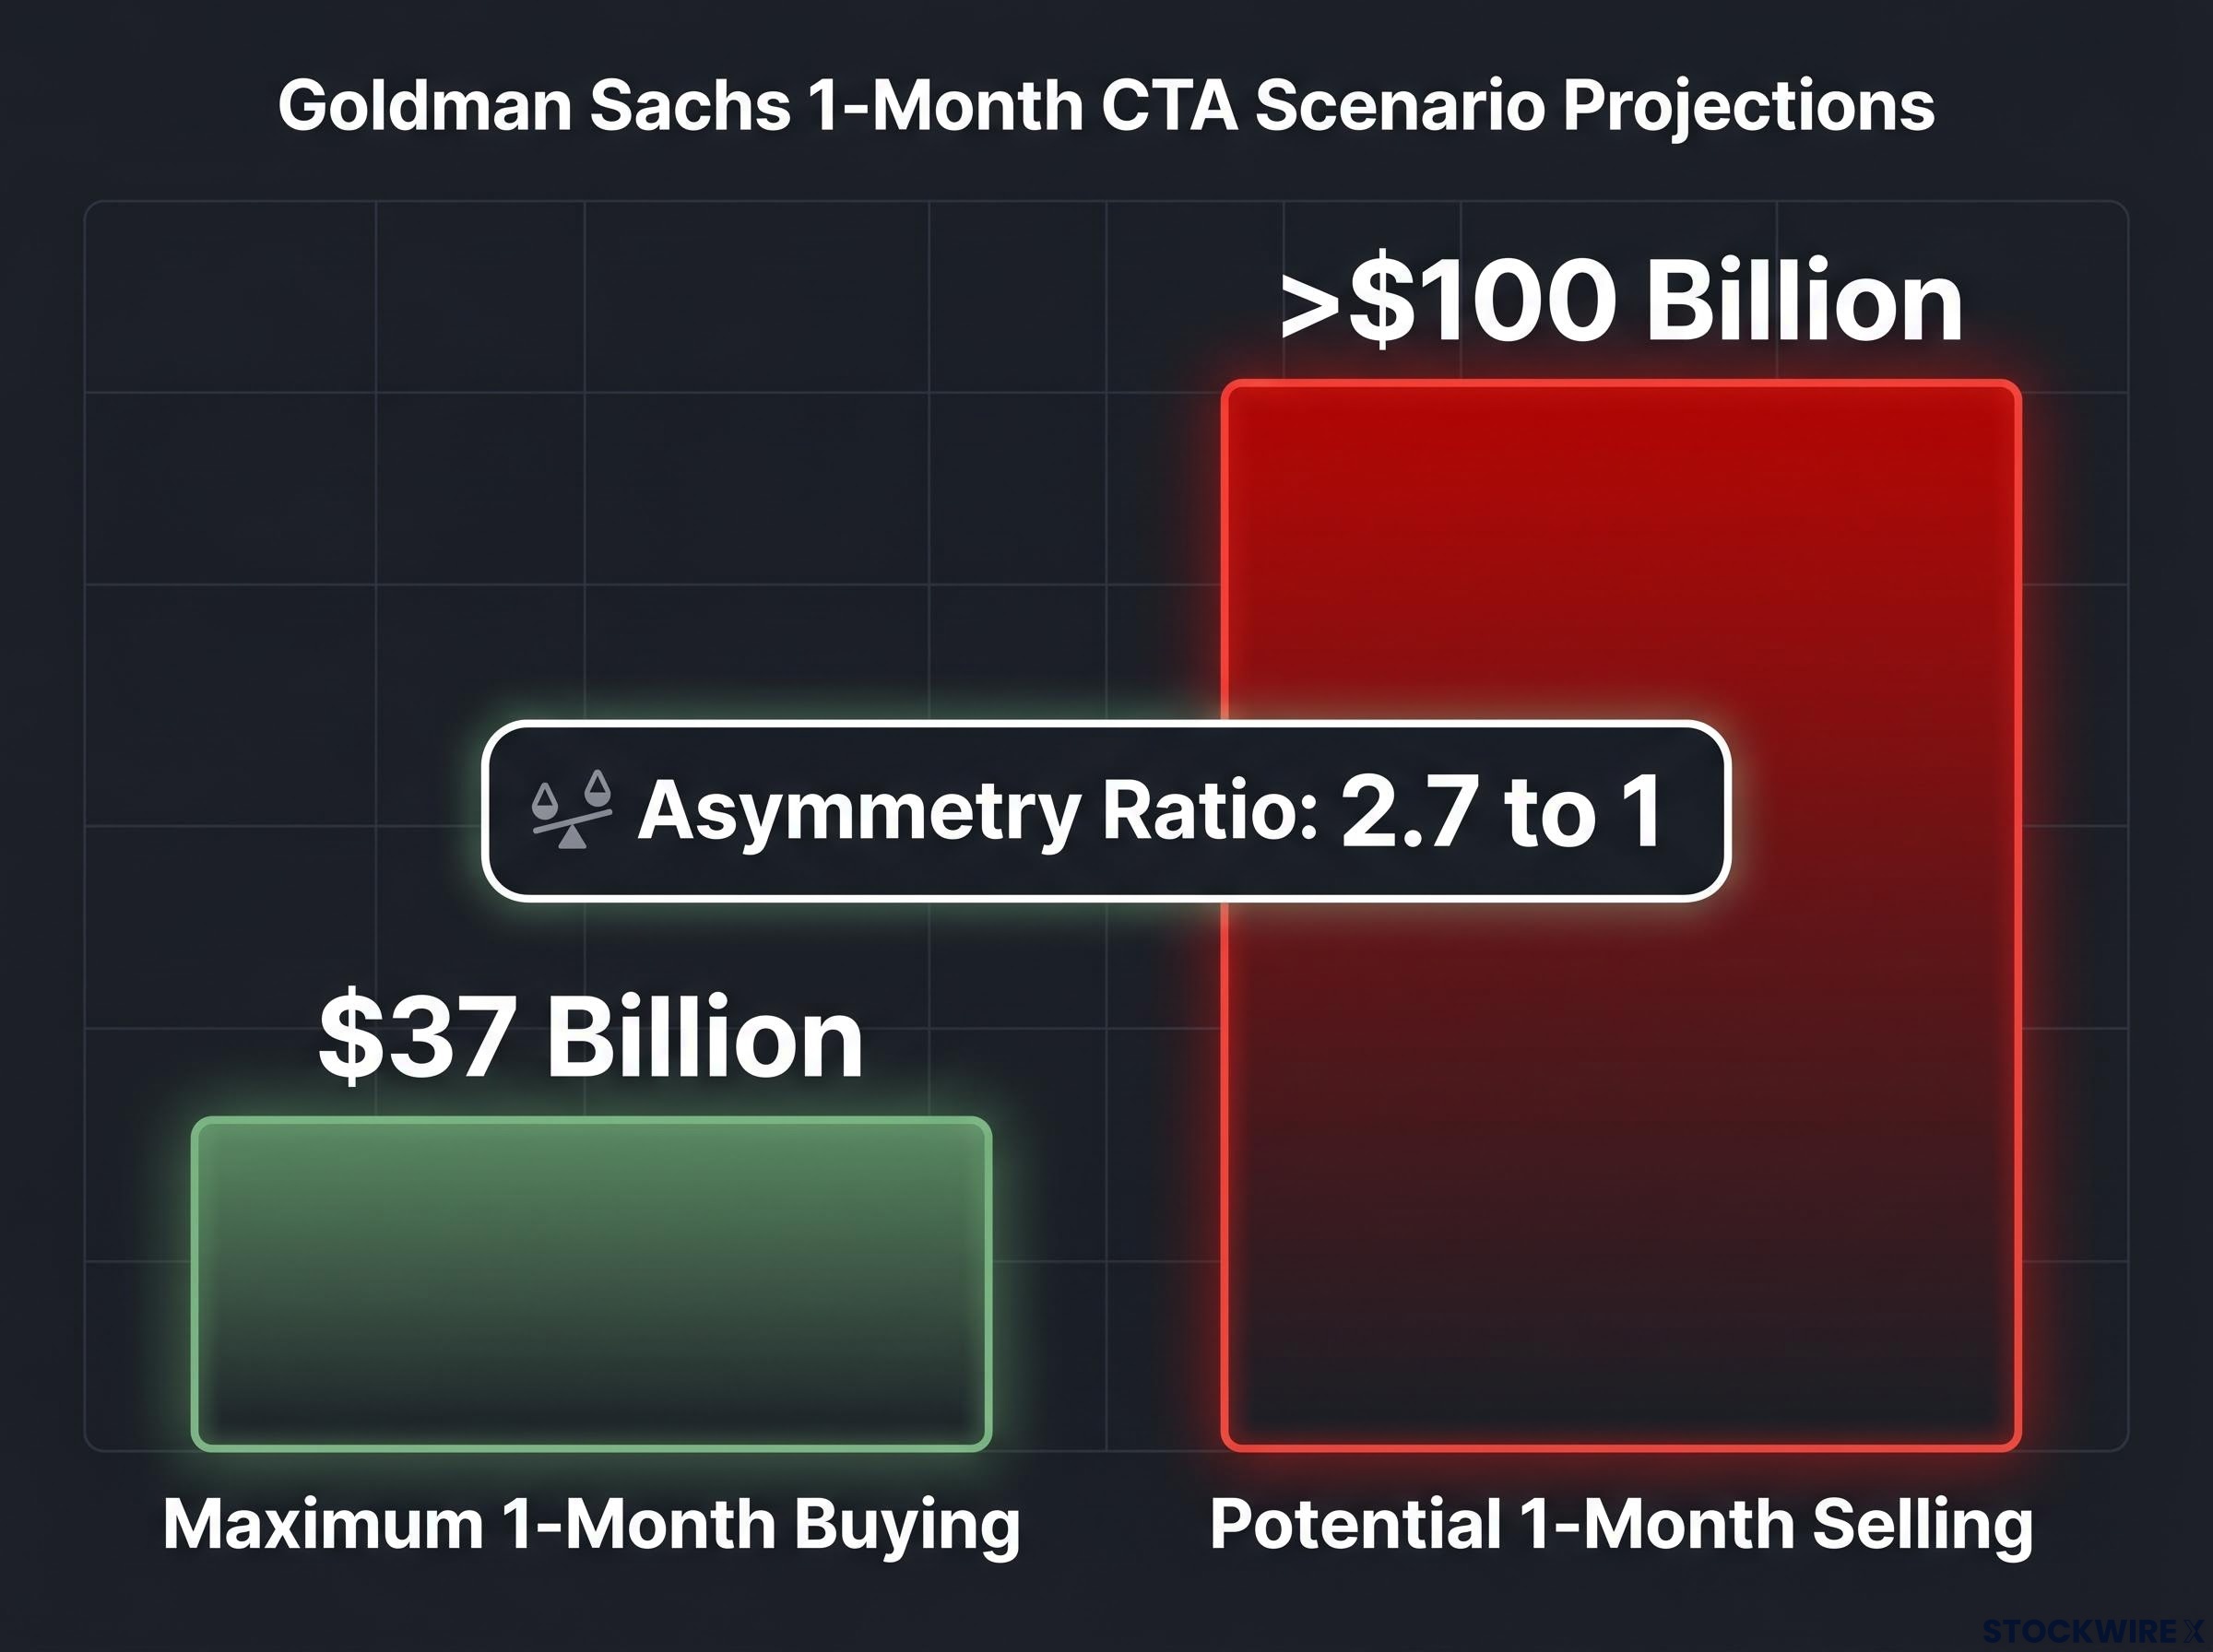
The arithmetic of the asymmetry is specific. Over one month in a rising market, Goldman projects a maximum of approximately $37 billion in CTA buying. Over one month in a declining market, the estimate exceeds $100 billion in selling.
Maximum one-month CTA buying: approximately $37 billion. Potential one-month CTA selling: more than $100 billion.
The ratio of maximum downside selling to maximum upside buying is approximately 2.7 to 1. For every dollar of support CTAs could provide in a rally, they could deliver nearly three dollars of selling pressure in a sustained decline.
The one-month window amplifies risk relative to the one-week window because trends have more time to establish directional momentum, giving CTA algorithms a clearer signal and increasing the likelihood that multiple funds breach sell thresholds simultaneously.
Goldman’s related modelling provides additional granularity on the S&P 500 specifically:
- Up to $33 billion in weekly CTA selling under specific declining scenarios
- As much as $80 billion over a month in S&P 500-focused downside scenarios
These figures sit within the broader $100 billion global estimate and illustrate where the selling pressure would concentrate.
Feedback loop: How CTA selling intensifies market moves
CTA selling is not merely a symptom of a falling market. It can become a cause of further decline. The amplification mechanism runs in a cascading sequence:
- An initial equity market decline occurs from any catalyst
- CTA sell signals are triggered as price trends breach thresholds
- Futures selling adds downward pressure to the index
- Additional CTAs breach their own sell thresholds as prices fall further
- Selling pressure intensifies beyond what the original catalyst would have produced alone
This is the feedback loop embedded in Goldman’s warning. The $34 billion in S&P 500 futures concentration is the specific channel through which CTA signals transmit into the benchmark. A discretionary fund manager selling on deteriorating earnings is responding to business fundamentals. A CTA selling on a price-trend signal is responding to price alone, meaning the selling can accelerate even if the underlying corporate environment is unchanged.
Forced deleveraging from momentum reversals amplifies the feedback loop beyond what CTA mechanics alone would produce: Goldman separately identified the current AI-driven momentum surge as one of only 11 comparable episodes since 1980, each of which reversed within roughly one month of peaking, and noted that hedge fund gross leverage was near five-year highs, meaning any reversal trigger intersects with both CTA sell signals and discretionary fund deleveraging simultaneously.
Conditional risk: Current trend signals hold steady
North American trend-following signals remain above the thresholds that would trigger broad-based selling. The feedback loop is conditional on a sustained price decline, not imminent under present conditions. Goldman’s warning concerns the potential magnitude if those thresholds are breached, not an assertion that breach is likely.
The $100 billion question: what U.S. equity investors should take from this warning
Goldman’s note distils to a specific proposition for U.S. equity investors: CTA positioning is currently a source of near-term support but carries asymmetric risk over a one-month horizon if price trends reverse. The appropriate response is not alarm but awareness of the specific conditions that would activate mechanical selling and amplify any broader drawdown.
Three conditions would need to materialise for the selling threat to activate:
- A sustained equity price decline over a multi-week period
- North American trend signals breaching sell thresholds
- S&P 500 futures prices trending below CTA algorithm reference levels
The $93 billion net long position and $34 billion S&P 500 futures concentration remain the live exposure figures to monitor. In a flat market over one month, Goldman projects $18 billion in CTA buying, meaning stable conditions produce support rather than selling.
Investors who understand the conditionality of this risk are better positioned to interpret market moves: a sharp equity decline accompanied by elevated futures volume may signal CTA unwind activity, a distinct dynamic from a gradual fundamental-driven selloff.
This article is for informational purposes only and should not be considered financial advice. Investors should conduct their own research and consult with financial professionals before making investment decisions. Goldman Sachs scenario projections are conditional estimates, not forecasts, and actual market outcomes may differ materially from modelled scenarios.
Asymmetric by design: Goldman’s warning as a standing feature of systematic markets
Goldman’s June 2026 warning is part of a pattern of recurring CTA-risk commentary earlier this year, signalling that systematic fund positioning is a standing feature of modern equity market structure rather than an episodic anomaly. The bank’s positioning notes in this period have consistently emphasised the bifurcated near-term versus one-month risk picture as the defining characteristic of current CTA exposure.
The calm surface of equity markets and the $100 billion downside scenario coexist precisely because CTAs do not respond to fundamentals. They respond to price. That property makes the transition from support to selling fast and mechanical when thresholds are crossed.
The same $93 billion net long position that provides near-term buying support is the position that, under a sustained decline, generates more than $100 billion in mechanical selling. The two scenarios live in the same trade.
Goldman’s note is not a sell signal. It is a structural map of a risk that lives beneath the index level and activates under specific, identifiable conditions.
Investors wanting to translate the asymmetric risk profile into concrete portfolio action will find our dedicated guide to tail risk hedging strategies useful; it covers SPX collar structures, long-dated put mechanics, and why Goldman Sachs and JPMorgan both identified cost-efficient crash insurance as a practical priority when consensus forecasting tools systematically underestimate the probability of sharp positioning-driven declines.