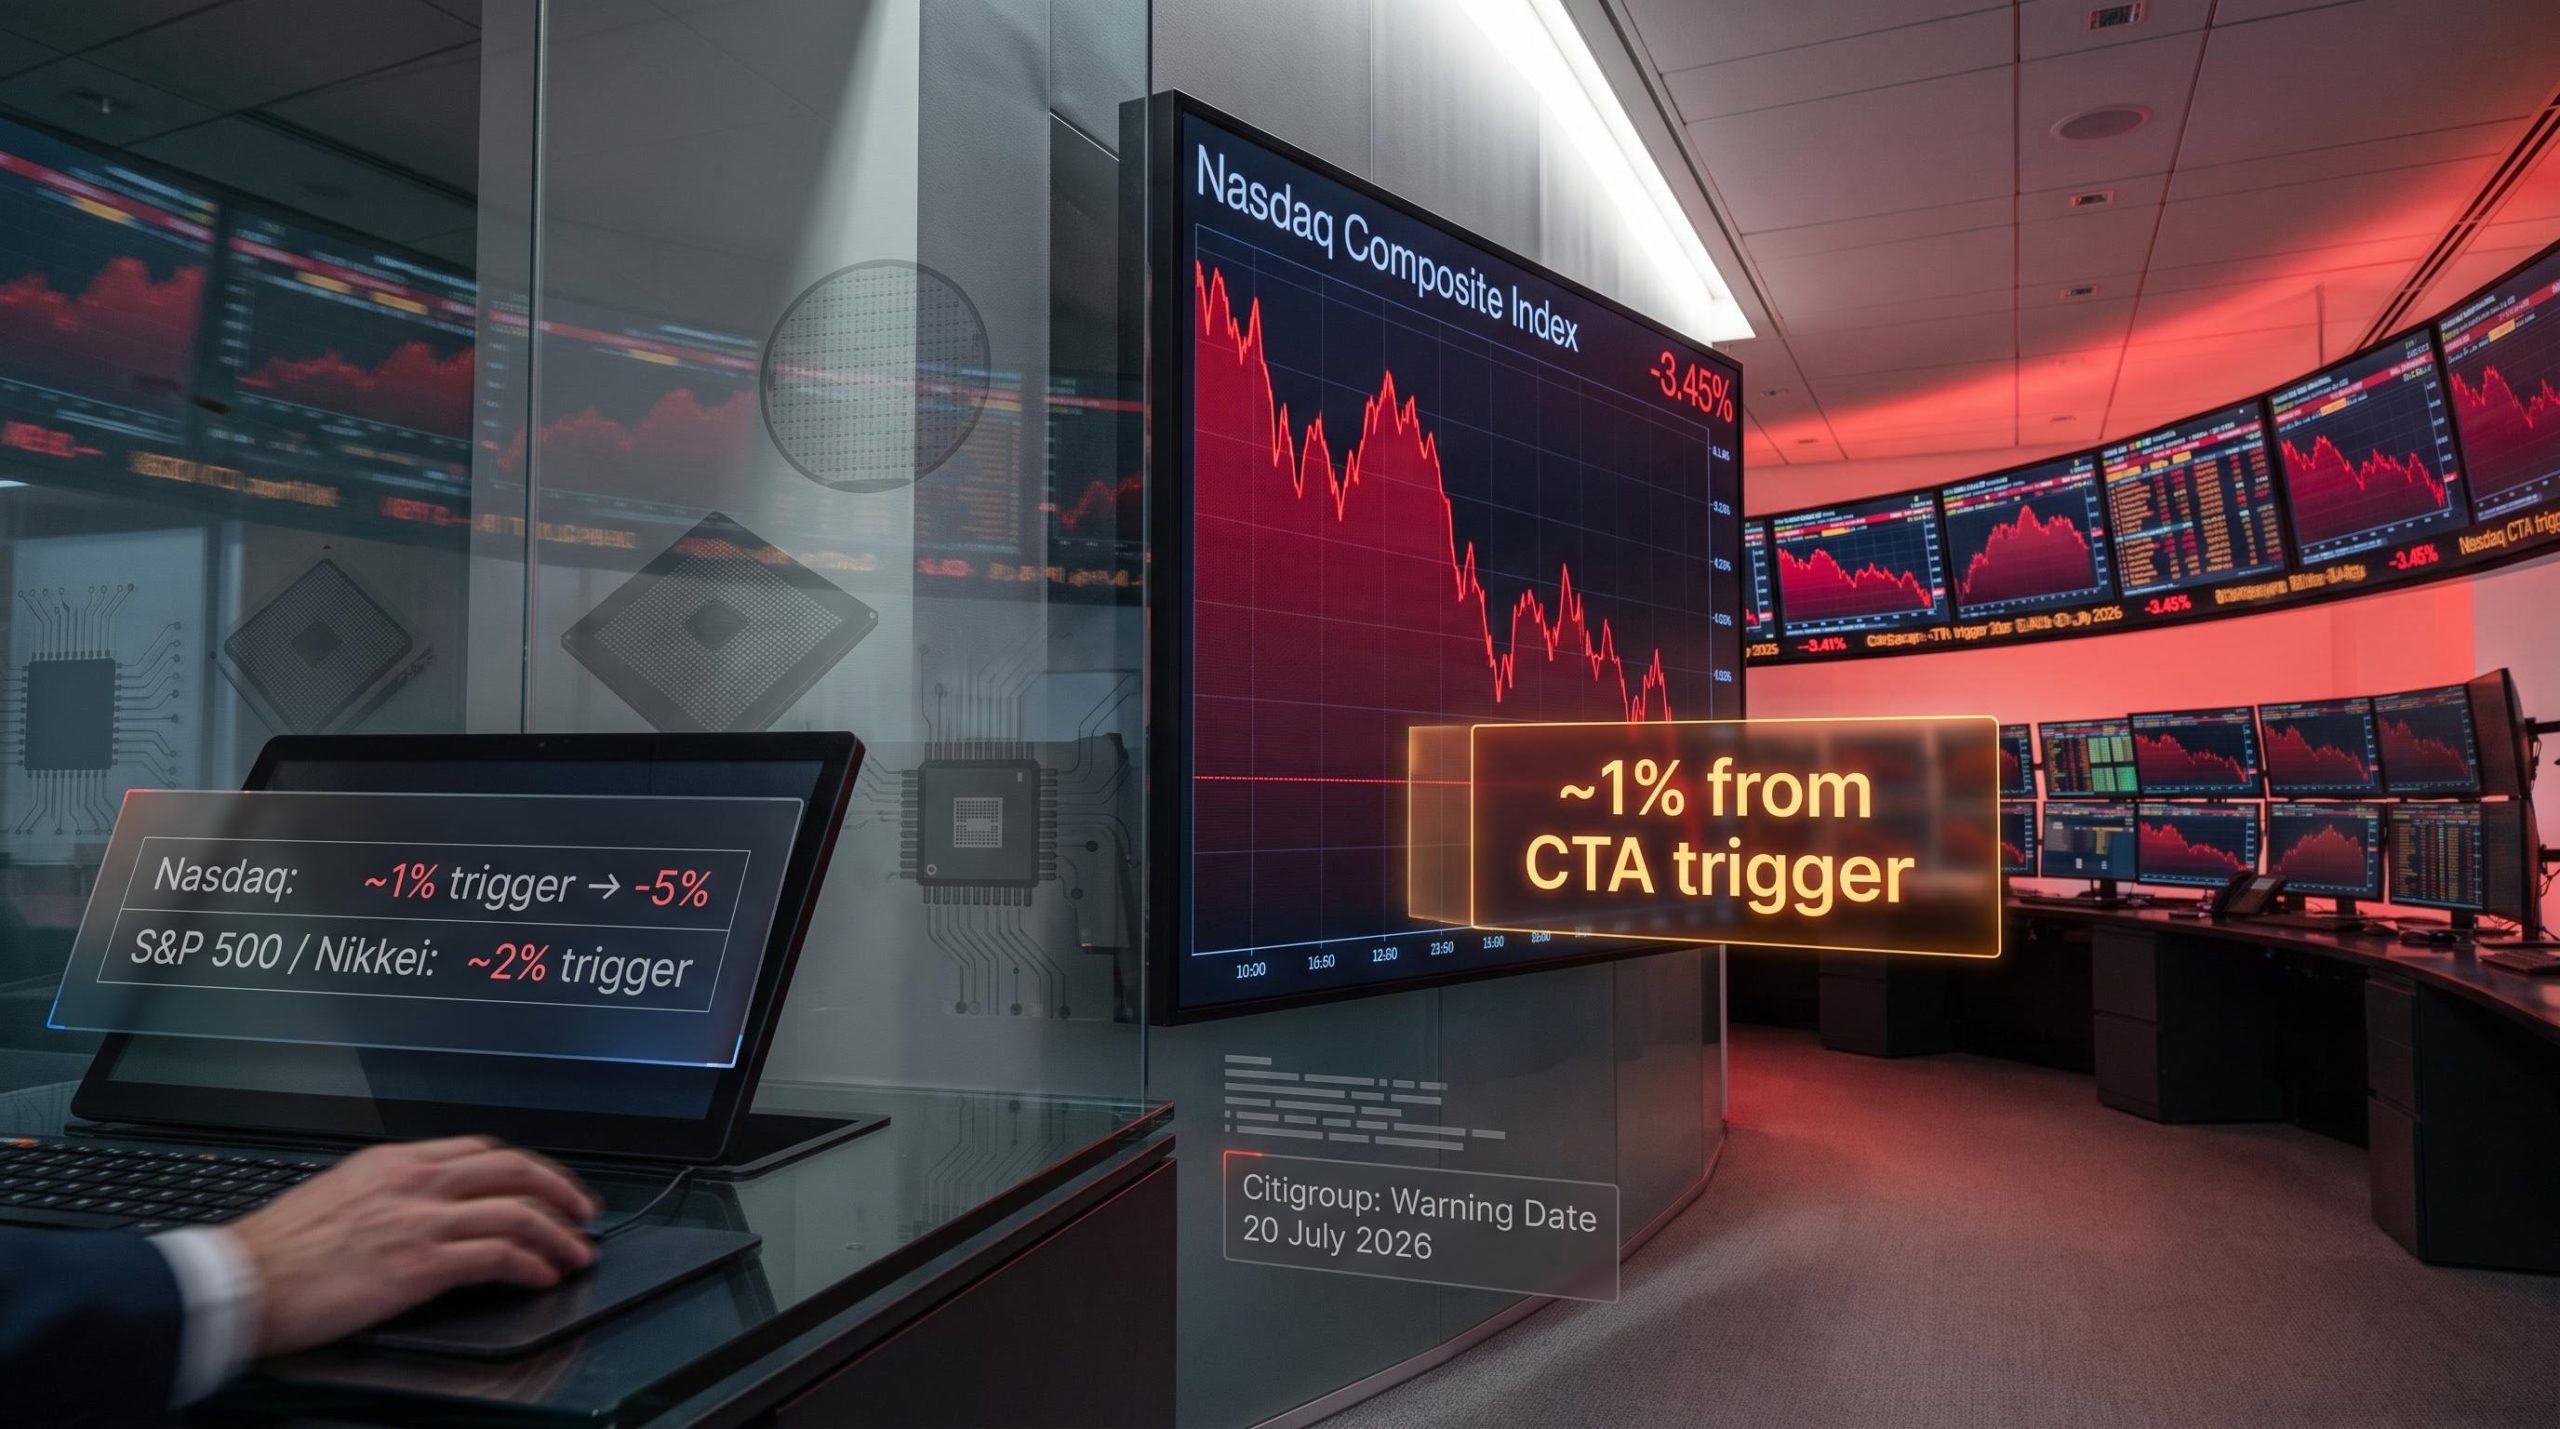
Citigroup strategists have flagged that the Nasdaq is now sitting roughly 1% away from the price level where trend-following funds are programmed to start selling in size.
The warning arrives after a week that saw semiconductor stocks drag both the Nasdaq and the Nikkei lower, and Citi’s models project that selling pressure could extend the index’s decline to approximately negative 5% if the threshold is crossed. The concern here is not a new macro shock. It is a mechanical one: rule-based selling programmes that can accelerate a decline already in motion, regardless of whether any new information about companies or earnings has changed.
Here is the framework for understanding exactly how these selling programmes work, where the specific trigger levels sit across major indices, and what to watch in chip stocks this week before making any portfolio decisions. This is situational intelligence for a week where the Nasdaq’s proximity to a systematic selling threshold makes semiconductor price action unusually consequential.
Why the Nasdaq is more exposed than other major indices right now
The gap between the Nasdaq and every other major index on Citi’s trigger map is not subtle.
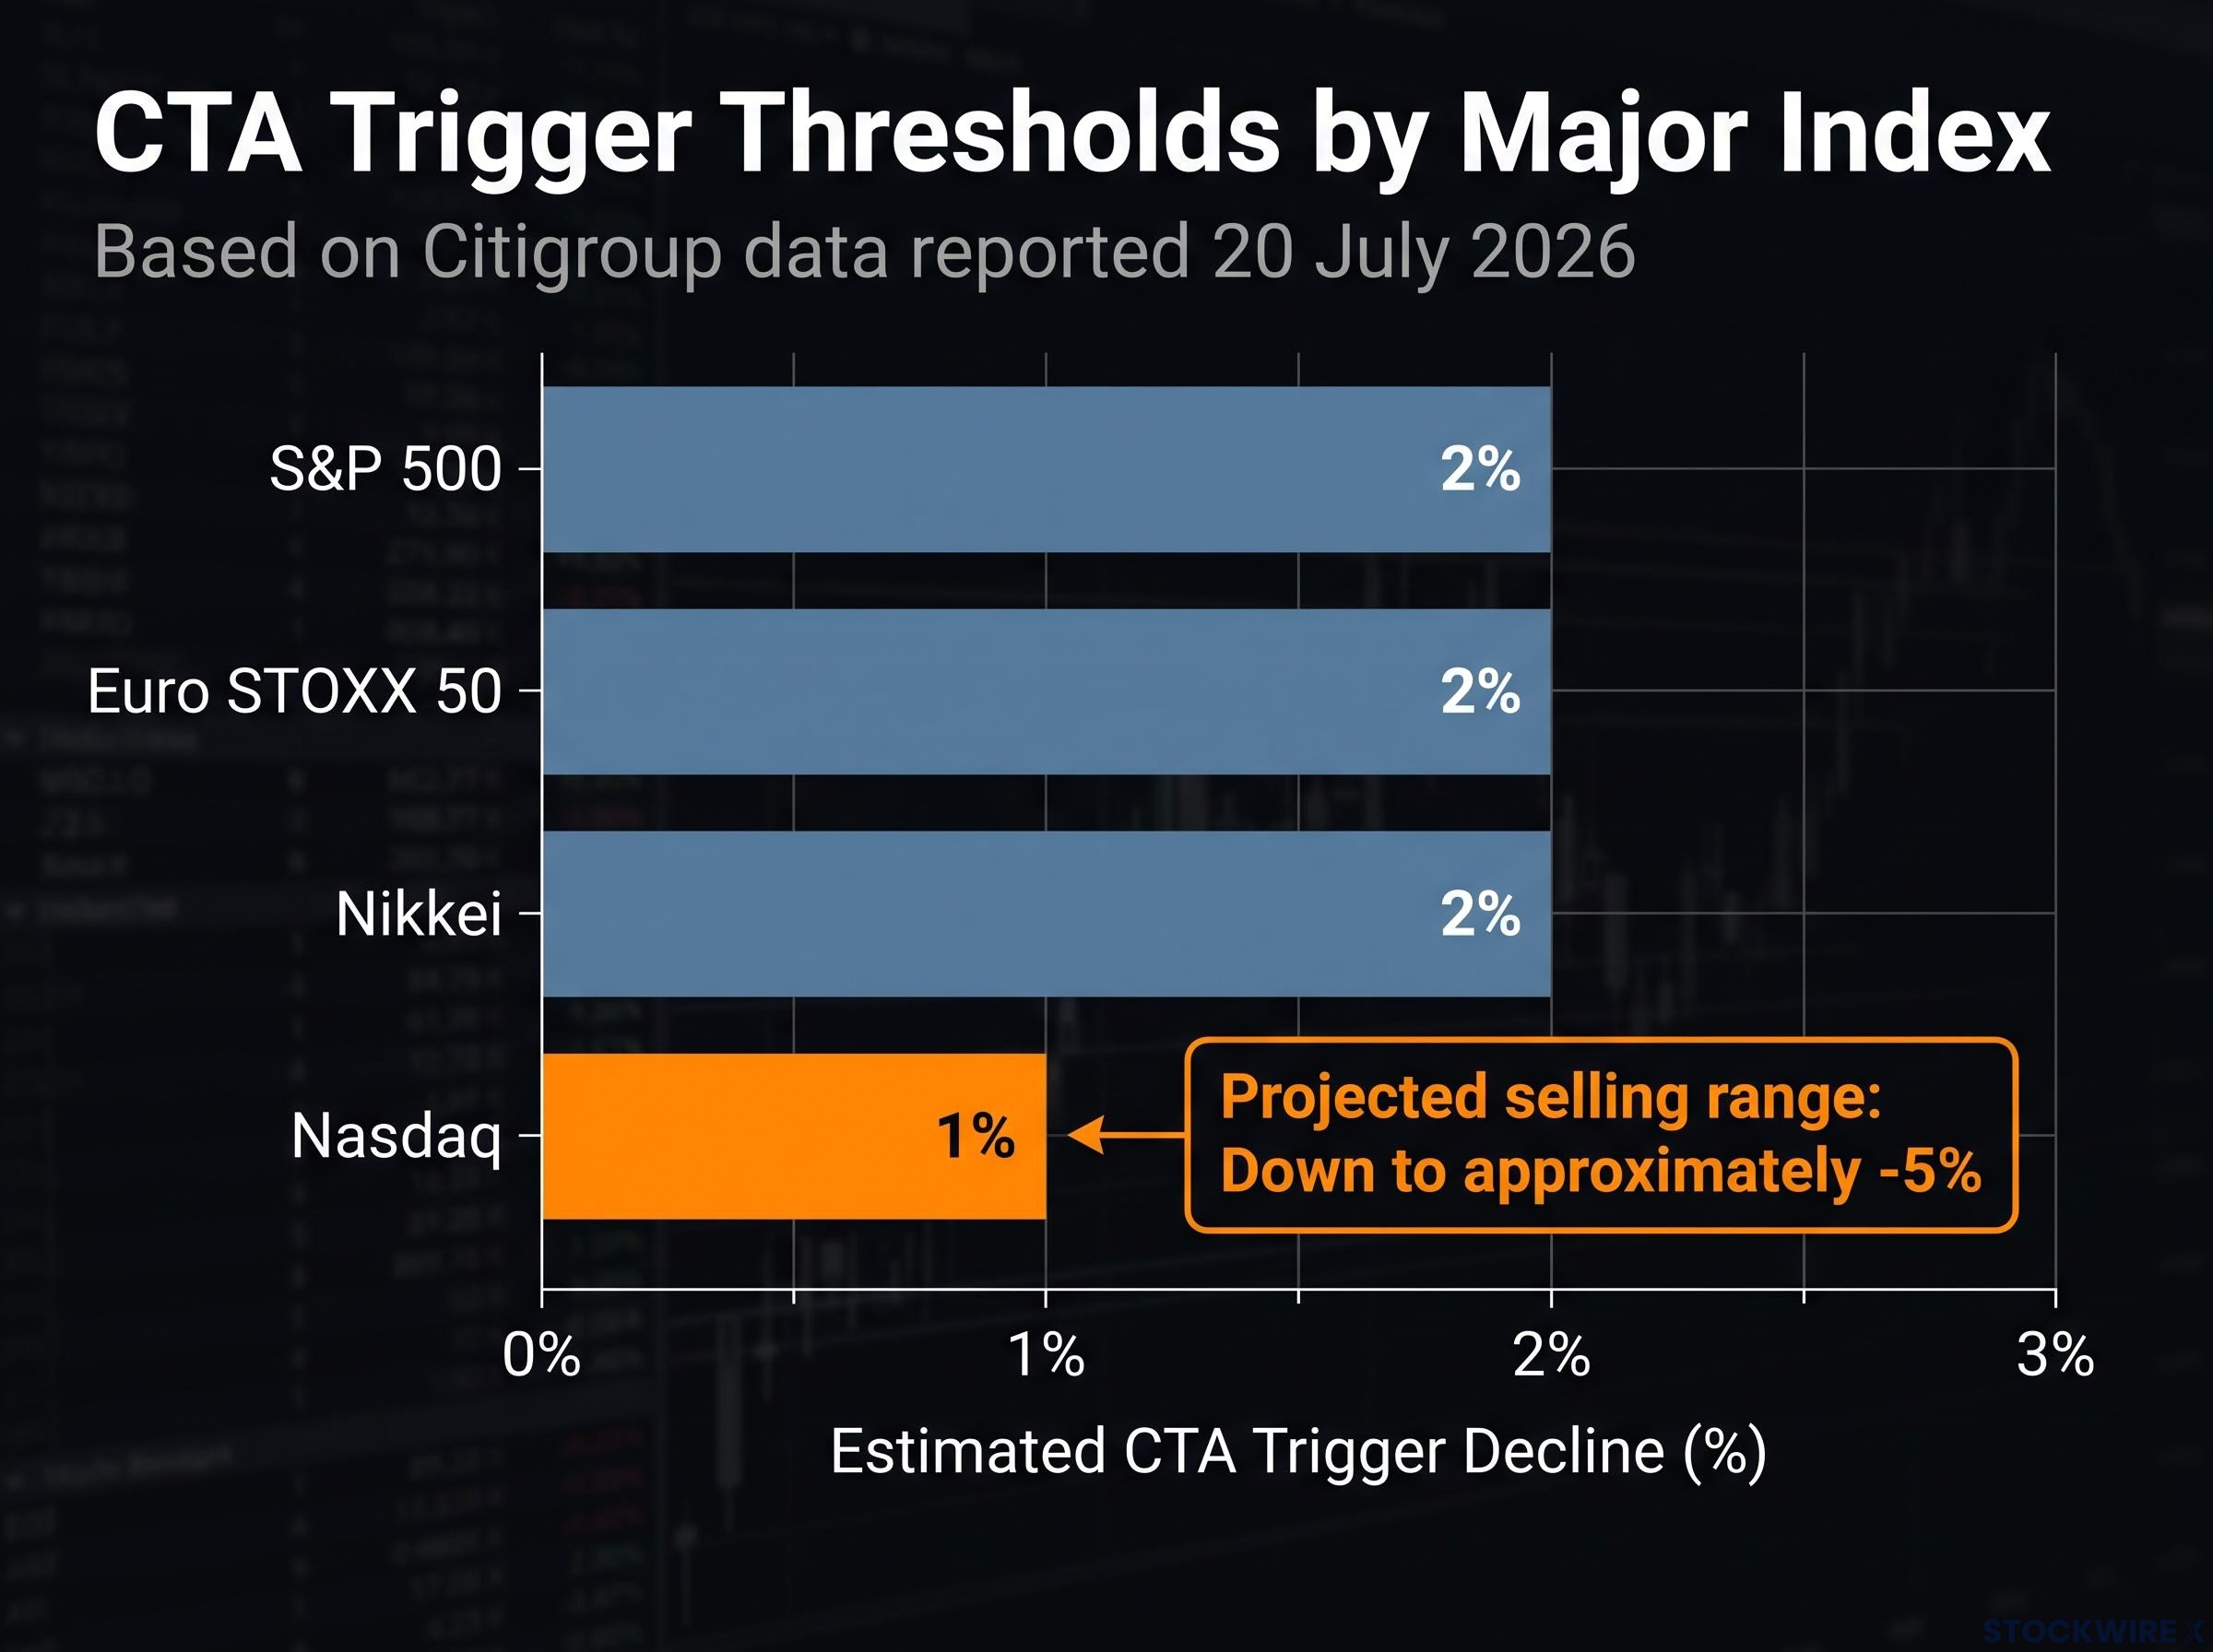
According to Citigroup strategists, as reported by Investing.com on 20 July 2026, the bank’s models indicate that selling in the Nasdaq intensifies once the index falls around 1% from current levels, with pressure continuing toward approximately negative 5%. For the S&P 500, Euro STOXX 50, and Nikkei, equivalent selling is estimated to kick in only on declines of closer to 2%. That is twice the buffer.
| Index | Estimated CTA trigger decline | Projected selling range |
|---|---|---|
| Nasdaq | ~1% | Down to approximately -5% |
| S&P 500 | ~2% | Not specified |
| Euro STOXX 50 | ~2% | Not specified |
| Nikkei | ~2% | Not specified |
The 1% proximity figure tells you that the Nasdaq is not in a theoretical danger zone but a live one. A single session of continued weakness in chip stocks could be enough to activate the selling cascade Citi is warning about, and once triggered, the models project continued pressure down to roughly negative 5%. That is not symmetrical risk across equity markets this week. The Nasdaq carries the smallest margin for error.
Bank of America’s CTA trigger map, published in June 2026, placed the S&P 500 approximately 3% from a threshold that would release roughly $100 billion in programmatic selling, with the geographic breakdown splitting across U.S., European, and Asian equities, a framework that illustrates how localised index weakness can propagate into coordinated cross-market liquidations.
When big ASX news breaks, our subscribers know first
What CTAs are and how their selling programmes work
Sometimes an index drops sharply and there is no obvious headline to explain it. No earnings miss, no rate decision, no geopolitical event. The price just falls, hard and fast, as though the market received information that you did not.
There is a good chance the selling came from Commodity Trading Advisors, or CTAs. These are trend-following funds that use algorithmic, rules-based models to trade based on price momentum rather than fundamental analysis of individual companies. They do not care what a company’s earnings look like. They do not read analyst reports. They follow one variable: price direction.
Goldman Sachs quantified the scale of this mechanic in early June 2026, estimating that trend-following funds held $93 billion in net long global equity exposure and that a sustained one-month decline could trigger more than $100 billion in CTA selling threat, a downside-to-upside ratio of approximately 2.7 to 1 compared with projected buying under stable conditions.
How stop-outs get triggered
The mechanic is straightforward. A CTA model monitors price levels continuously. Once an index declines through a pre-set threshold, the model generates a sell order automatically. The price level alone is the decision variable; news headlines, earnings revisions, and analyst commentary are irrelevant to the algorithm.
The problem compounds when multiple CTA strategies, calibrated to similar thresholds, respond to the same trend signal at roughly the same time. That produces clustered selling: a wave of automated liquidations that amplifies the initial move.
Three features define this type of selling:
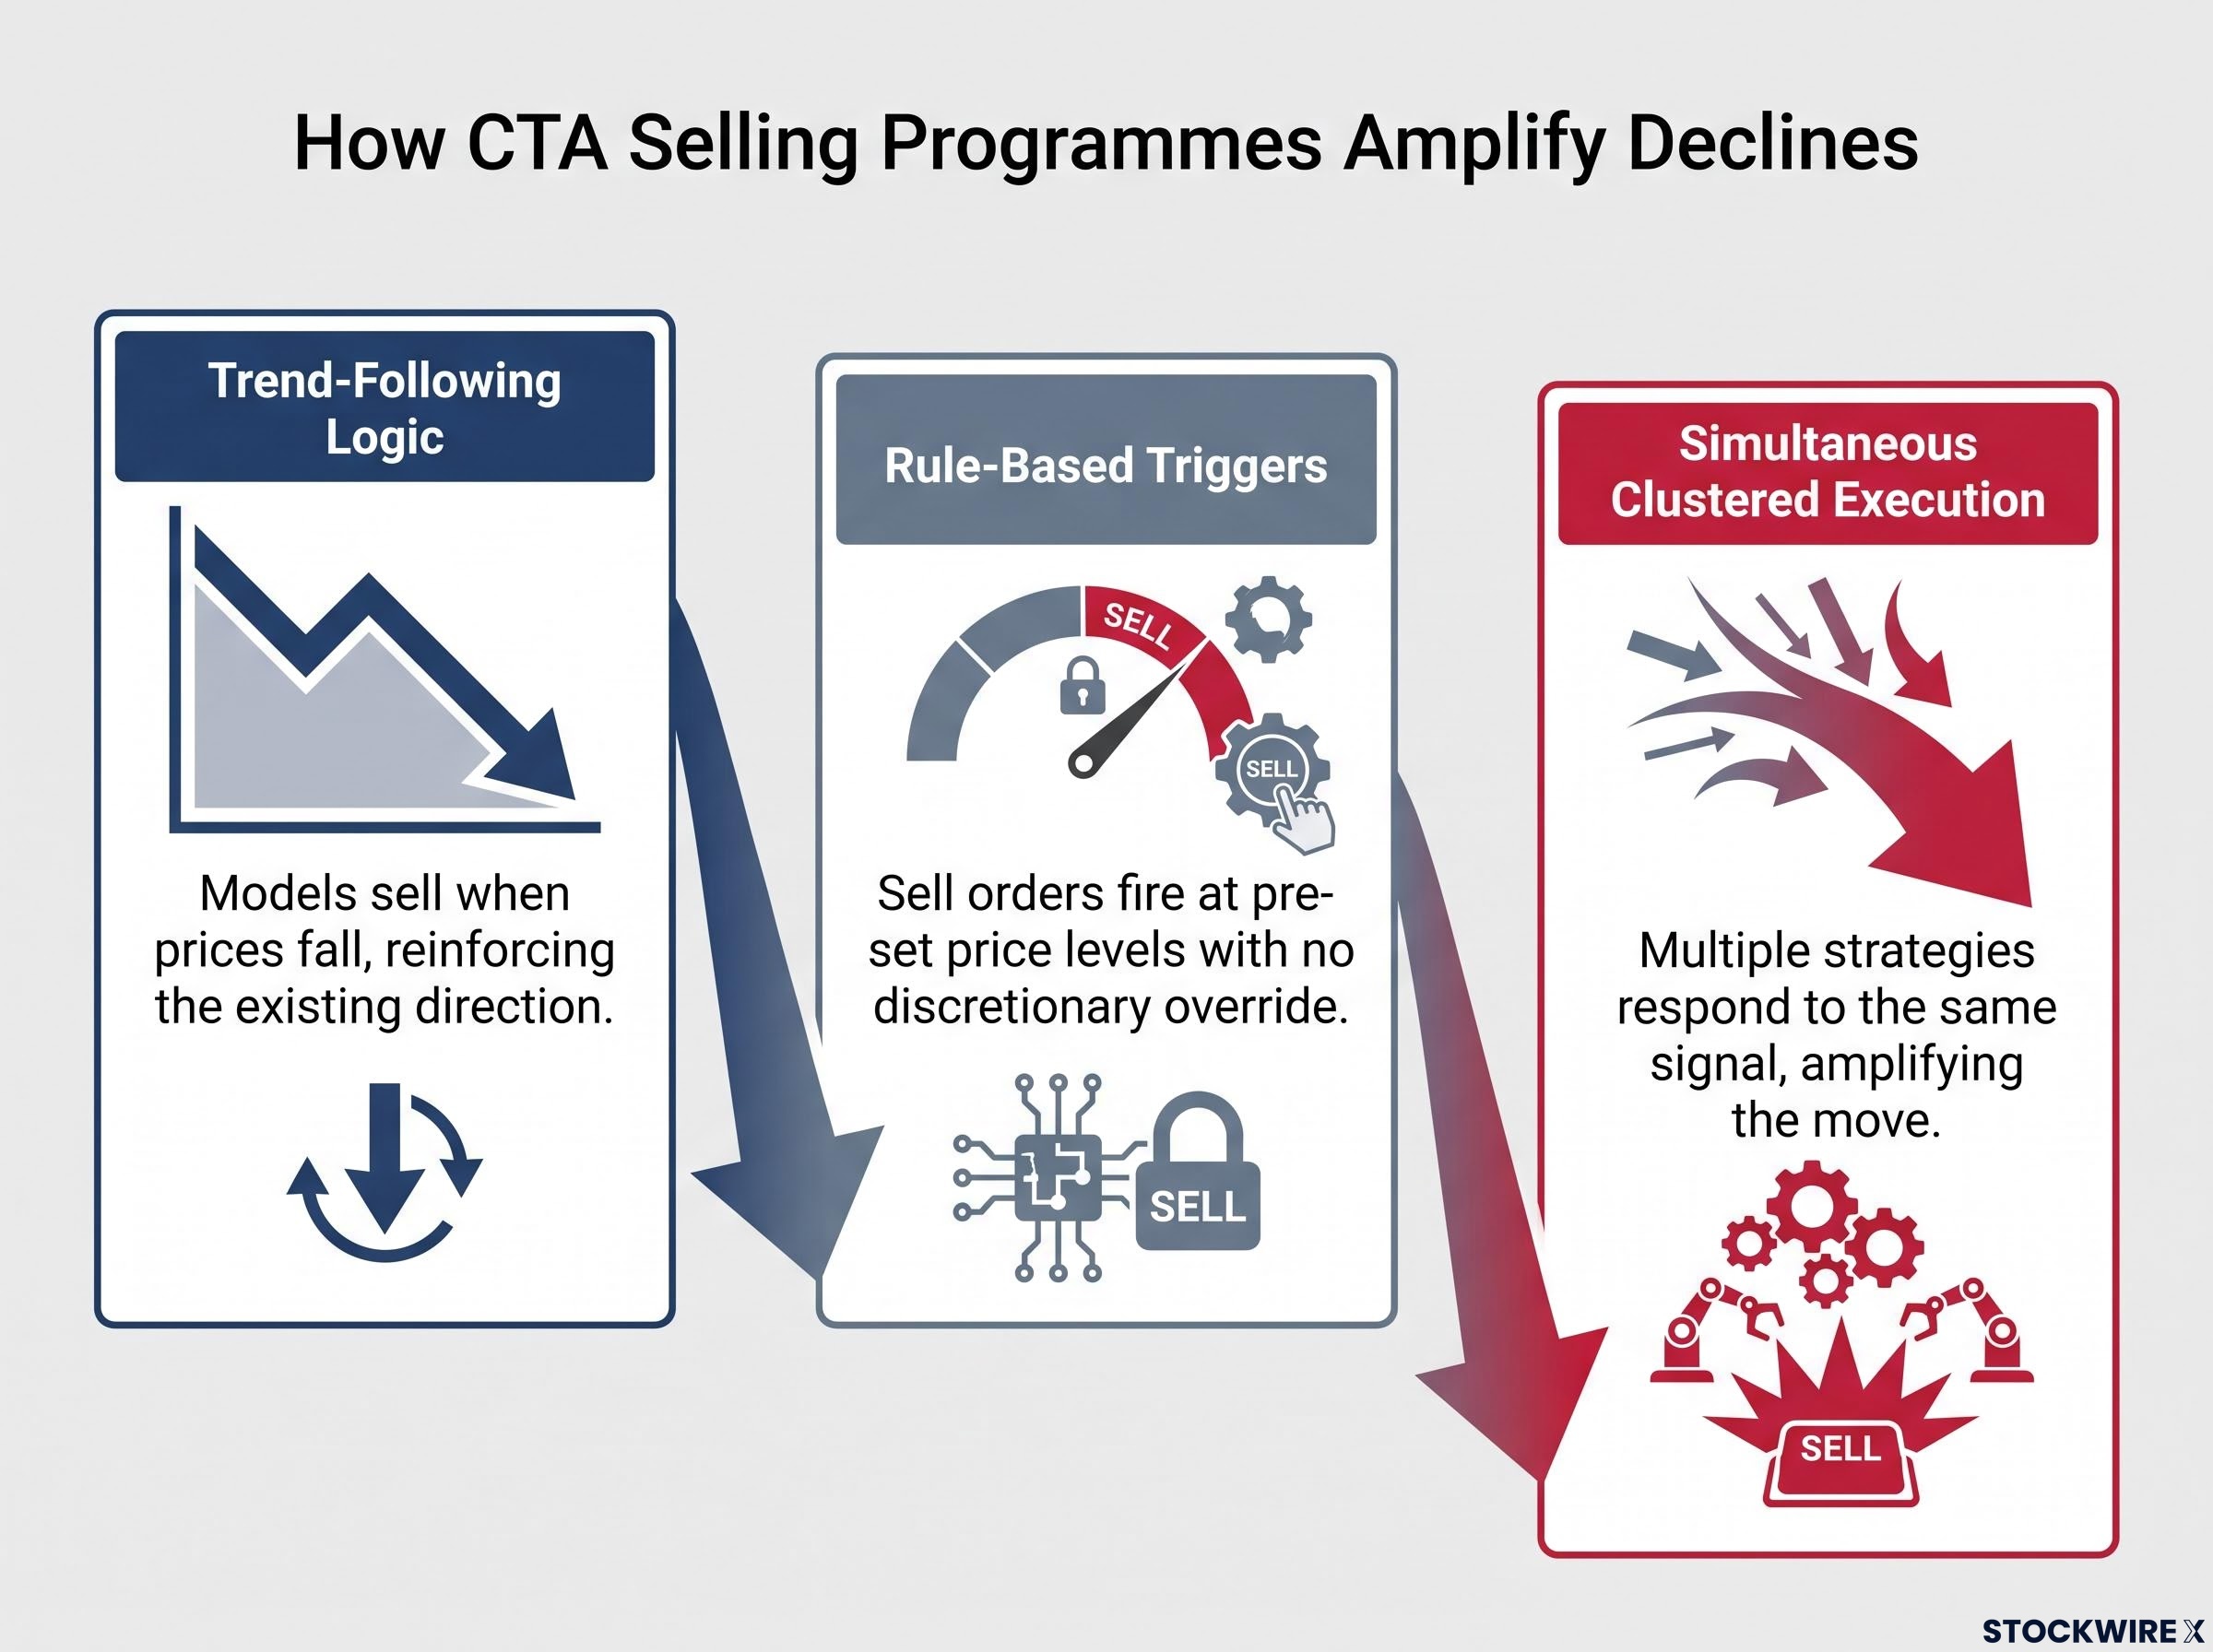
- Trend-following logic: Models buy when prices are rising and sell when prices are falling, reinforcing the existing direction rather than reversing it
- Rule-based triggers: Sell orders fire at pre-set price levels with no discretionary override
- Simultaneous clustered execution: Multiple strategies with similar calibrations can respond to the same signal within minutes, amplifying the move
As of this week, overall CTA exposure to global equities remains on the long side, given that medium-term price trends have stayed positive across the majority of markets. But quicker-reacting models have already begun picking up signs of weakening momentum in the S&P 500 and Nasdaq specifically. And Japan’s sharp market decline in the prior week proved sufficient to force stop-outs among certain more cautious trend-following strategies, illustrating how rapidly these mechanisms can engage once a threshold is breached.
For you as a retail investor, the practical implication is this: a sharp Nasdaq drop this week may not signal any new information about the companies you own. It may instead reflect mechanical selling by funds following price rules that have nothing to do with fundamentals.
The semiconductor selloff as the live catalyst
The sector doing the pushing is not ambiguous. Citigroup pointed to semiconductors as a critical trigger for the current period, noting that chip stocks hold significant weight within the Nasdaq index, meaning that prolonged weakness across semiconductor names exerts direct downward pressure on the index itself. That is what moves the Nasdaq toward the CTA trigger thresholds described above.
The SOX posted its strongest first-half performance on record through June 2026 before pulling back more than 20% from its peak, and the dynamic across semiconductor stocks in the weeks heading into July illustrates exactly why prolonged sector weakness can accumulate to index-level consequences even when year-to-date returns appear strong.
The prior week’s decline in both the Nasdaq and the Nikkei was the setup that brought the index to within 1% of its trigger level. If chip stocks stabilise, the buffer holds. If they do not, the Nasdaq crosses into territory where automated selling programmes begin to fire.
Citigroup analysts cautioned that a continuation of the semiconductor weakness could result in this week seeing considerably larger equity unwinds from trend-following funds, with the Nasdaq at greatest risk of leading other major benchmarks lower.
For investors watching markets this week, the daily performance of leading semiconductor stocks is functioning as an early indicator of whether the Nasdaq is moving toward or away from the threshold that activates systematic selling. It reduces a complex, multi-variable situation to a single sector to monitor.
What Citigroup’s positioning data reveals about the broader risk
The Nasdaq’s proximity to its trigger level is one piece of a larger structural picture, and the pieces fit together in a way that warrants attention.
Start with the positioning itself. Despite recent weakness, Citi’s data shows that CTA strategies have maintained a broadly long orientation toward global equities, as positive price trends across most markets have yet to reverse. That means most trend-following strategies have not yet been forced to sell. Their exposure is still on the table.
A separate Citi analysis from 30 June 2026 identified that approximately 80% of Nasdaq-100 long positions were loss-making by that date, a structural condition that introduces forced selling risk through three mechanical channels: margin calls on leveraged positions, institutional VaR limits that trigger automatic reductions, and investor redemptions requiring managers to liquidate holdings.
Now add the early-warning signal. Quicker-reacting systematic models have begun registering signs of trend deterioration in the Nasdaq and S&P 500 in particular, putting those strategies closer to potential selling than their slower-moving counterparts. Some systematic funds are already beginning to reposition; this is not a purely prospective risk.
Then consider the precedent. Last week’s sharp decline across Japanese equity markets was significant enough to push certain risk-averse trend followers into stop-out territory, offering a concrete example of how swiftly these models can respond when a threshold is hit.
The three-part convergence looks like this:
- Crowded long positioning in U.S. tech and Nasdaq names, with large positions vulnerable to adverse catalysts
- A sector-specific semiconductor drawdown applying direct pressure to the index most exposed to CTA triggers
- CTA models near or at trigger thresholds, with faster strategies already signalling trend deterioration
This configuration, according to Citi, fits a pattern the bank has flagged across multiple periods through 2025 and into 2026. The fact that faster CTA models are already signalling tells you this is not a static warning but an unfolding shift.
What retail investors should actually do with this information
The distinction that matters most this week is between a flow-driven CTA liquidation and a genuine fundamental deterioration. The first is about risk rules and trend signals. No new information about earnings, revenue, or company prospects. The second reflects a genuine reassessment of value. Your correct response to each is different.
If chip stocks continue to slide and the Nasdaq breaches its trigger level, the resulting selling may feel alarming. Prices could drop sharply with no obvious headline to explain it. That is the mechanical signature of CTA liquidation, and recognising it changes how you should react.
Four practical implications to carry through the week:
- Expect elevated intraday volatility. The approximately 1% proximity to trigger levels means relatively modest additional weakness could activate the selling cascade Citi describes. If it arrives, it is an expected condition, not necessarily a signal that something new has gone wrong.
- Distinguish flow-driven dislocations from fundamental deterioration. A sharp price drop driven by systematic selling is mechanically different from a drop caused by a negative earnings revision or macro shock. The question to ask before any reactive portfolio decision: is this CTA mechanics or new information?
- Watch leading chip names as a real-time indicator. Sustained weakness in semiconductor stocks is the direct lever that pushes the Nasdaq toward trigger levels. Their price action is your leading signal for whether the selloff scenario is unfolding.
- Acknowledge that mechanical and news-driven selling can interact. Positioning-driven selling and fundamental concerns are not always cleanly separable. A CTA liquidation can create downward pressure that feeds into negative sentiment, and vice versa. The distinction is useful but not always tidy in practice.
This article is for informational purposes only and should not be considered financial advice. Investors should conduct their own research and consult with financial professionals before making investment decisions.
What the CTA threshold story changes, and what it does not
The Nasdaq’s proximity to CTA trigger levels is a structural risk amplifier for this week. It does not change the underlying fundamental picture for the companies in the index. If the Nasdaq holds above trigger levels, or chip stocks stabilise, the CTA selling scenario remains a risk rather than a certainty; trend-following funds are positioned to sell if thresholds are crossed, but their aggregate exposure to global equities remains on the long side as of the week of 20 July 2026.
The scenario Citi describes is contingent on the semiconductor narrative persisting through the current week. That makes it a live, time-bounded risk that resolves one way or the other within a short window.
Three variables to watch through the rest of this week
Semiconductor stock price action in leading chip names, the direct lever on whether the Nasdaq crosses its trigger threshold. Whether faster-model CTA signals spread to the broader systematic community, which would indicate an acceleration of repositioning. And whether the Nasdaq holds above the approximate 1% buffer level Citi identified as the activation threshold.
What changes this week is the near-term volatility calculus for Nasdaq-heavy portfolios. What does not change is the fundamental case for the companies inside the index. Knowing the difference is what lets you respond to the price action rather than react to it.
These statements reflect current conditions and are subject to change based on market developments. Past performance does not guarantee future results.