
Every forecasting tool has a failure mode. The interesting question for investors is whether the failure mode is random or directional. Evercore ISI strategist Julian Emanuel, in a client note dated 18 May 2026, assigned a 30% probability to the S&P 500 reaching 9,000 by year-end, a target 16% above his base case. But the note carried a sharper point beneath the headline number: the two forecasting tools most widely adopted across institutional and retail workflows, AI-powered large language models (LLMs) and prediction markets, are structurally incapable of seeing the distribution tails where that kind of outcome lives. With AI forecasting embedded in institutional research pipelines and prediction market prices cited as probability benchmarks across financial media, the question of where these tools fail is not academic. It is a portfolio construction problem. This analysis unpacks the specific mechanisms behind those blind spots, draws on corroborating institutional and academic evidence, and connects the framework directly to the tail risk hedging strategies investors should consider when the consensus tools are systematically compressing the outcomes that matter most.
When forecasting tools converge on the middle, the tails become your blind spot
The more widely an AI forecasting tool is adopted, the more systematically it compresses the scenario distribution investors actually need to worry about. Emanuel labelled the tendency “Narrow Consensus,” a term describing LLMs’ architectural tendency to cluster outputs around modal, consensus-friendly answers. This is not a bug in any single platform. It is a structural characteristic that spans the major LLM architectures used in financial analysis today.
The source of the compression is specific. Instruction-tuning and reinforcement learning from human feedback (RLHF), the processes that make LLMs useful for most tasks, optimise models toward median-plausible outputs. The result: scenario distributions that are narrower than historical realised volatility would justify.
The CFA Institute’s Enterprising Investor blog reported in June 2025 that LLMs tasked with predicting one-year equity index ranges produce narrower ranges than historical data supports, with 2008- and 2020-style outliers absent from AI-generated scenario sets unless explicitly prompted.
Morgan Stanley Research, as summarised by CNBC in December 2025, reinforced the point from a different angle: the frequency of greater-than-3-sigma moves in equities over recent decades exceeds what naive AI-generated distributions imply. An arXiv preprint from May 2025, “Consensus Bias in Large Language Models,” documented compressed forecast distributions in finance-related prompts compared with expert surveys. Investors treating AI-generated scenario sets as comprehensive probability maps are, by design, underweighting the scenarios that carry the most damage.
Consensus forecast failures are not limited to AI-generated distributions; human-driven market consensus has also systematically overstated equity damage from geopolitical events including the 2024 Taiwan Strait drills and the 2024 US election, with markets processing each as a probability-adjusted earnings input rather than a proportional headline shock.
When big ASX news breaks, our subscribers know first
The mechanism behind the blind spot: how AI systems are built to avoid extremes
Understanding that AI misses tails is useful. Understanding why it misses them is actionable, because the mechanism tells investors exactly when to discount AI-derived probabilities most heavily.
Two distinct failure modes compound each other in deployed LLMs:
- Underfitting on frequency. Rare events appear too infrequently in training data for the model to assign them appropriate probability mass. As MSCI researchers Andy Sparks and Riccardo Rebonato noted in February 2025, GenAI and LLMs fundamentally extrapolate from historical training data and text corpora, making them structurally unable to generate probability mass for events that are genuinely unprecedented or outside the training distribution.
- Active suppression through RLHF. During fine-tuning, models are penalised for producing “extreme” outputs that human raters judge as implausible. Research published on arXiv in February 2025 (“The Diversity Tax”) found that instruction-tuning and RLHF push LLMs toward high-likelihood, median responses, actively suppressing minority but plausible scenarios.
Underfitting on history versus active suppression through training
The distinction matters because the two mechanisms reinforce each other rather than partially self-correcting. Underfitting is a data problem: rare events have few observations. RLHF suppression is a design problem: the model is actively guided away from extreme outputs. In deployed LLMs, both operate simultaneously, meaning the tail-risk blind spot is doubly reinforced.
The Bank for International Settlements (BIS), in its FSI Insights paper from March 2025, warned explicitly that AI and ML models can be misleading when historical data lack stress periods. The BIS documented systematic over-confidence near central probabilities and under-representation of extreme probabilities below 5% or above 95%. An arXiv forecast calibration paper from January 2026 pointed in the same direction: LLM probability forecasts are over-confident in the 30-70% range and under-represent extremes relative to empirical frequencies.
The BIS Financial Stability Institute warnings on AI model opacity identify opaque models, unstructured data, and reliance on third-party providers as compounding factors that complicate risk assessment and validation, a finding that reinforces why AI-generated probability distributions deserve heightened scrutiny when applied to tail scenarios.
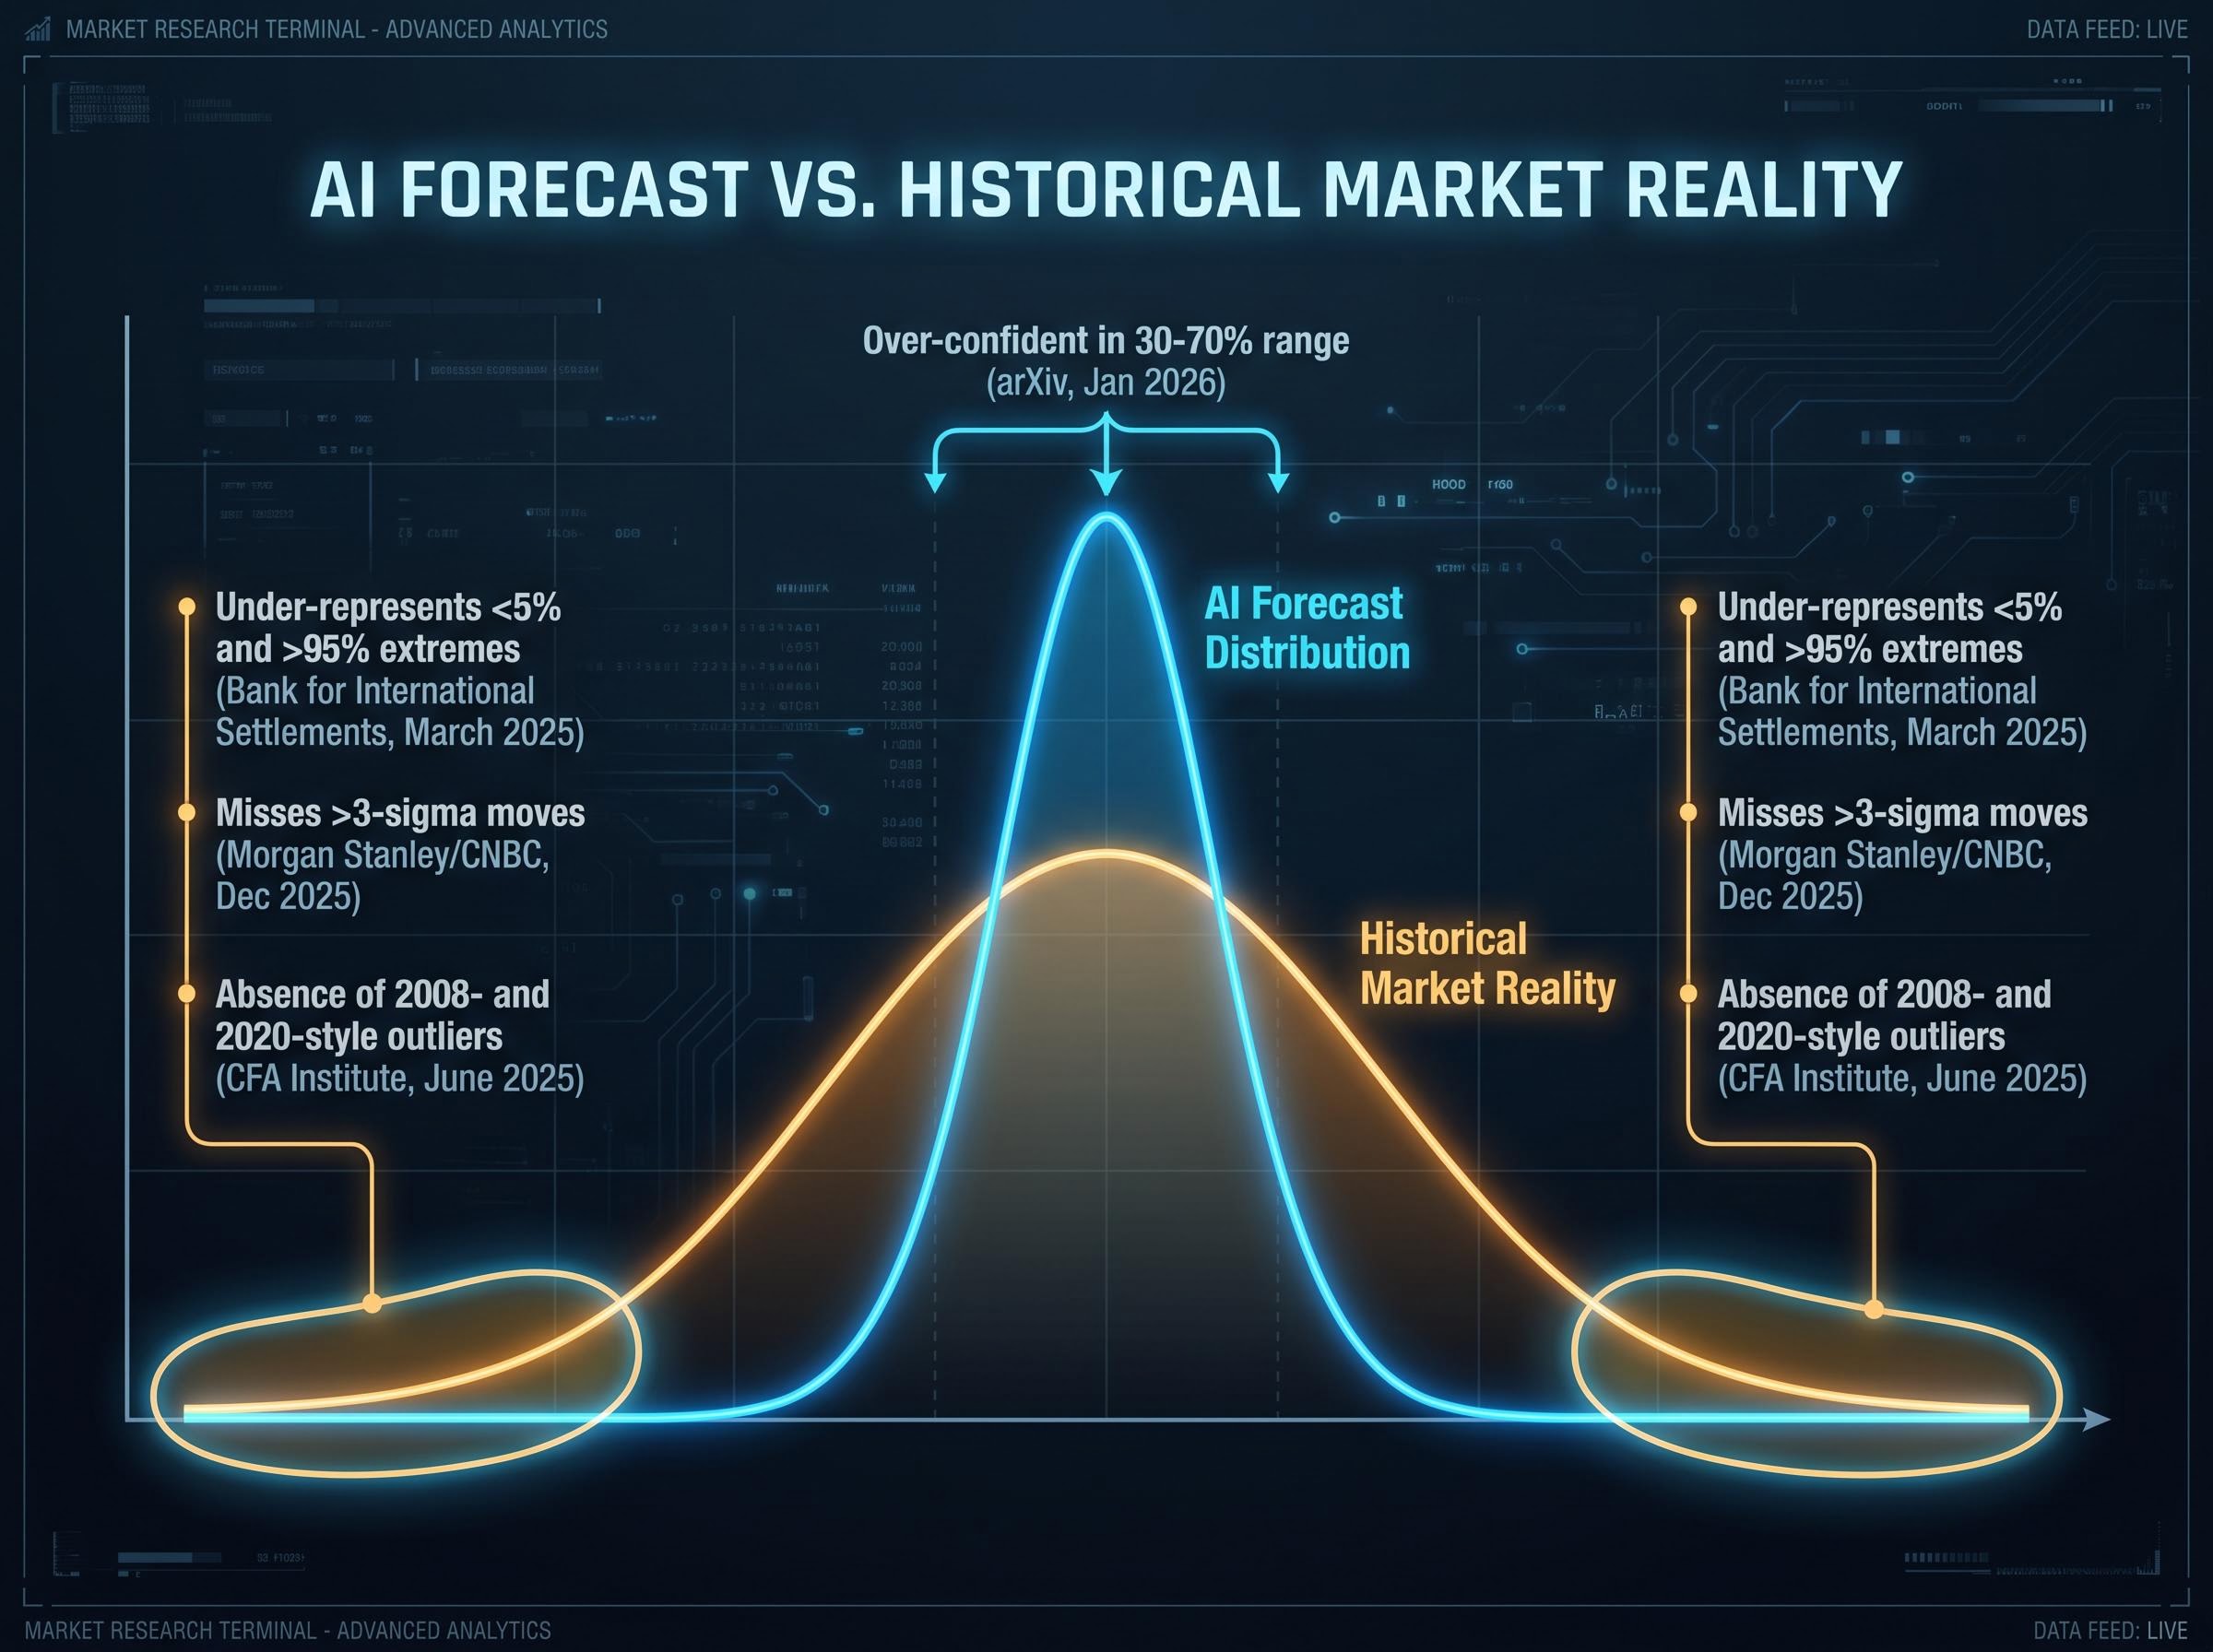
The practical implication is precise. Investors should discount AI-derived probabilities most heavily in the exact domain where tail risk hedging decisions get made: when the probability being estimated is very low or very high.
Why prediction markets face the same problem from a different direction
The blind spot is not unique to AI. Prediction markets, elevated to near-oracle status in financial media commentary, face a parallel limitation rooted in market structure rather than model architecture.
Emanuel characterised prediction markets as reflecting collective belief rather than predicting future events. The structural reason is specific: prediction market prices in low-probability contracts are driven by thin liquidity and participation bias, not by the full distribution of informed opinion.
Evercore ISI described prediction markets as “reflecting collective belief rather than predicting future events,” and noted they are less suited for outcomes that are continuous, long-dated, or heavily skewed toward tail risks.
The conditions under which prediction markets are least reliable are identifiable:
- Long-dated contracts, where additional uncertainty about whether the market will remain liquid until resolution compounds pricing distortion
- Continuous outcomes (such as index levels) rather than binary events (such as election results), where the contract structure itself forces artificial precision
- Highly skewed prior probabilities, where most participants have no informed view and prices reflect the availability heuristic and recency bias rather than calibrated assessment
- Thin liquidity in low-probability contracts, which allows prices to deviate materially from true underlying probabilities
Prediction markets do have genuine value for short-dated, binary, liquid contracts on well-defined events. The critique is not a blanket dismissal. It is a boundary condition: the tool’s reliability degrades in precisely the domain where tail-risk probability estimation matters most.
What a wider outcome distribution actually looks like in the current market
Emanuel’s own market call illustrates what happens when a strategist explicitly acknowledges the wider distribution that consensus tools compress away.
| Scenario | S&P 500 Target | Probability |
|---|---|---|
| Base Case | 7,750 | Implied residual |
| Bull Case | 9,000 | 30% |
When a strategist simultaneously publishes a base case and assigns 30% odds to an outcome 16% above it, the implied message is that the outcome distribution has fat tails and that positioning for only the central scenario leaves risk and opportunity on the table.
The downside tail scenarios that AI-generated distributions systematically exclude include recession-driven drawdowns averaging 32% since 1957, oil supply shocks that Goldman Sachs and JPMorgan currently assign 30-35% probability, and a Morgan Stanley extreme case of $150-$180 oil that remains on the table despite front-month implied volatility staying contained.
Evercore ISI framed the convergence of an AI-driven technology bull market with broad geopolitical shifts as producing “a wider distribution of potential outcomes than investors or standard forecasting models would typically anticipate.”
Emanuel compared structural conditions to the 1920s and 1990s convergences, with pandemic-era stimulus, rapid money supply expansion, and productivity growth projected to potentially reach 3% by the end of the decade creating an environment where both upside and downside tails expand simultaneously. The options market appears to reflect this. The VIX closed at 17.86 on 14 May 2026, a moderate front-month reading. Yet the Cboe SKEW Index reportedly averaged 137.5 in March 2026 versus a long-term average near 120-125, suggesting elevated demand for tail-risk protection in the wings even as at-the-money implied volatility remains contained.
Translating the blind spot into a hedging framework: collar structures and beyond
Emanuel’s specific positioning recommendation embodies the analytical framework. Evercore ISI recommended long-dated call options on “AI Class of 2026” stocks and the QQQ ETF for upside capture, paired with a collar strategy on the SPY ETF to manage near-term downside risk from oil prices and interest rates.
A collar strategy involves selling out-of-the-money (OTM) calls against an existing position to fund the purchase of OTM puts, creating a defined range of outcomes and reducing the net cost of protection. The construction follows a specific sequence:
- Identify the underlying position or index exposure to be hedged
- Select the OTM put strike and expiry for downside protection
- Select the OTM call strike to sell against the position, capping upside but generating premium income
- Calculate the net premium cost or credit, which determines whether the collar is implemented at a net cost, a net credit, or approximately zero
The structure is not merely a hedging tactic. It is a structural acknowledgement that the tools most investors rely on to estimate tail probabilities are biased away from the scenarios the hedge is designed to protect against.
Investors exploring how to implement cost-efficient hedging structures beyond basic collars will find our dedicated guide to credit spread construction useful, covering delta selection, theta mechanics, and backtested SPY put credit spread win rates, with specific guidance on strike placement at 30-45 days before expiration that informs how institutional desks size and time similar positions.
Institutional demand signals confirm the shift toward tail protection
Institutional activity corroborates the framework. Goldman Sachs, as reported in January 2026, noted increased use of SPX collars following the AI-driven rally, with strong activity in 3-to-6-month 5-10% OTM put spreads on the S&P 500. JPMorgan equity derivatives strategists, as reported in March 2026, recommended 2-to-3-year SPX and QQQ puts as cost-effective longer-term crash insurance.
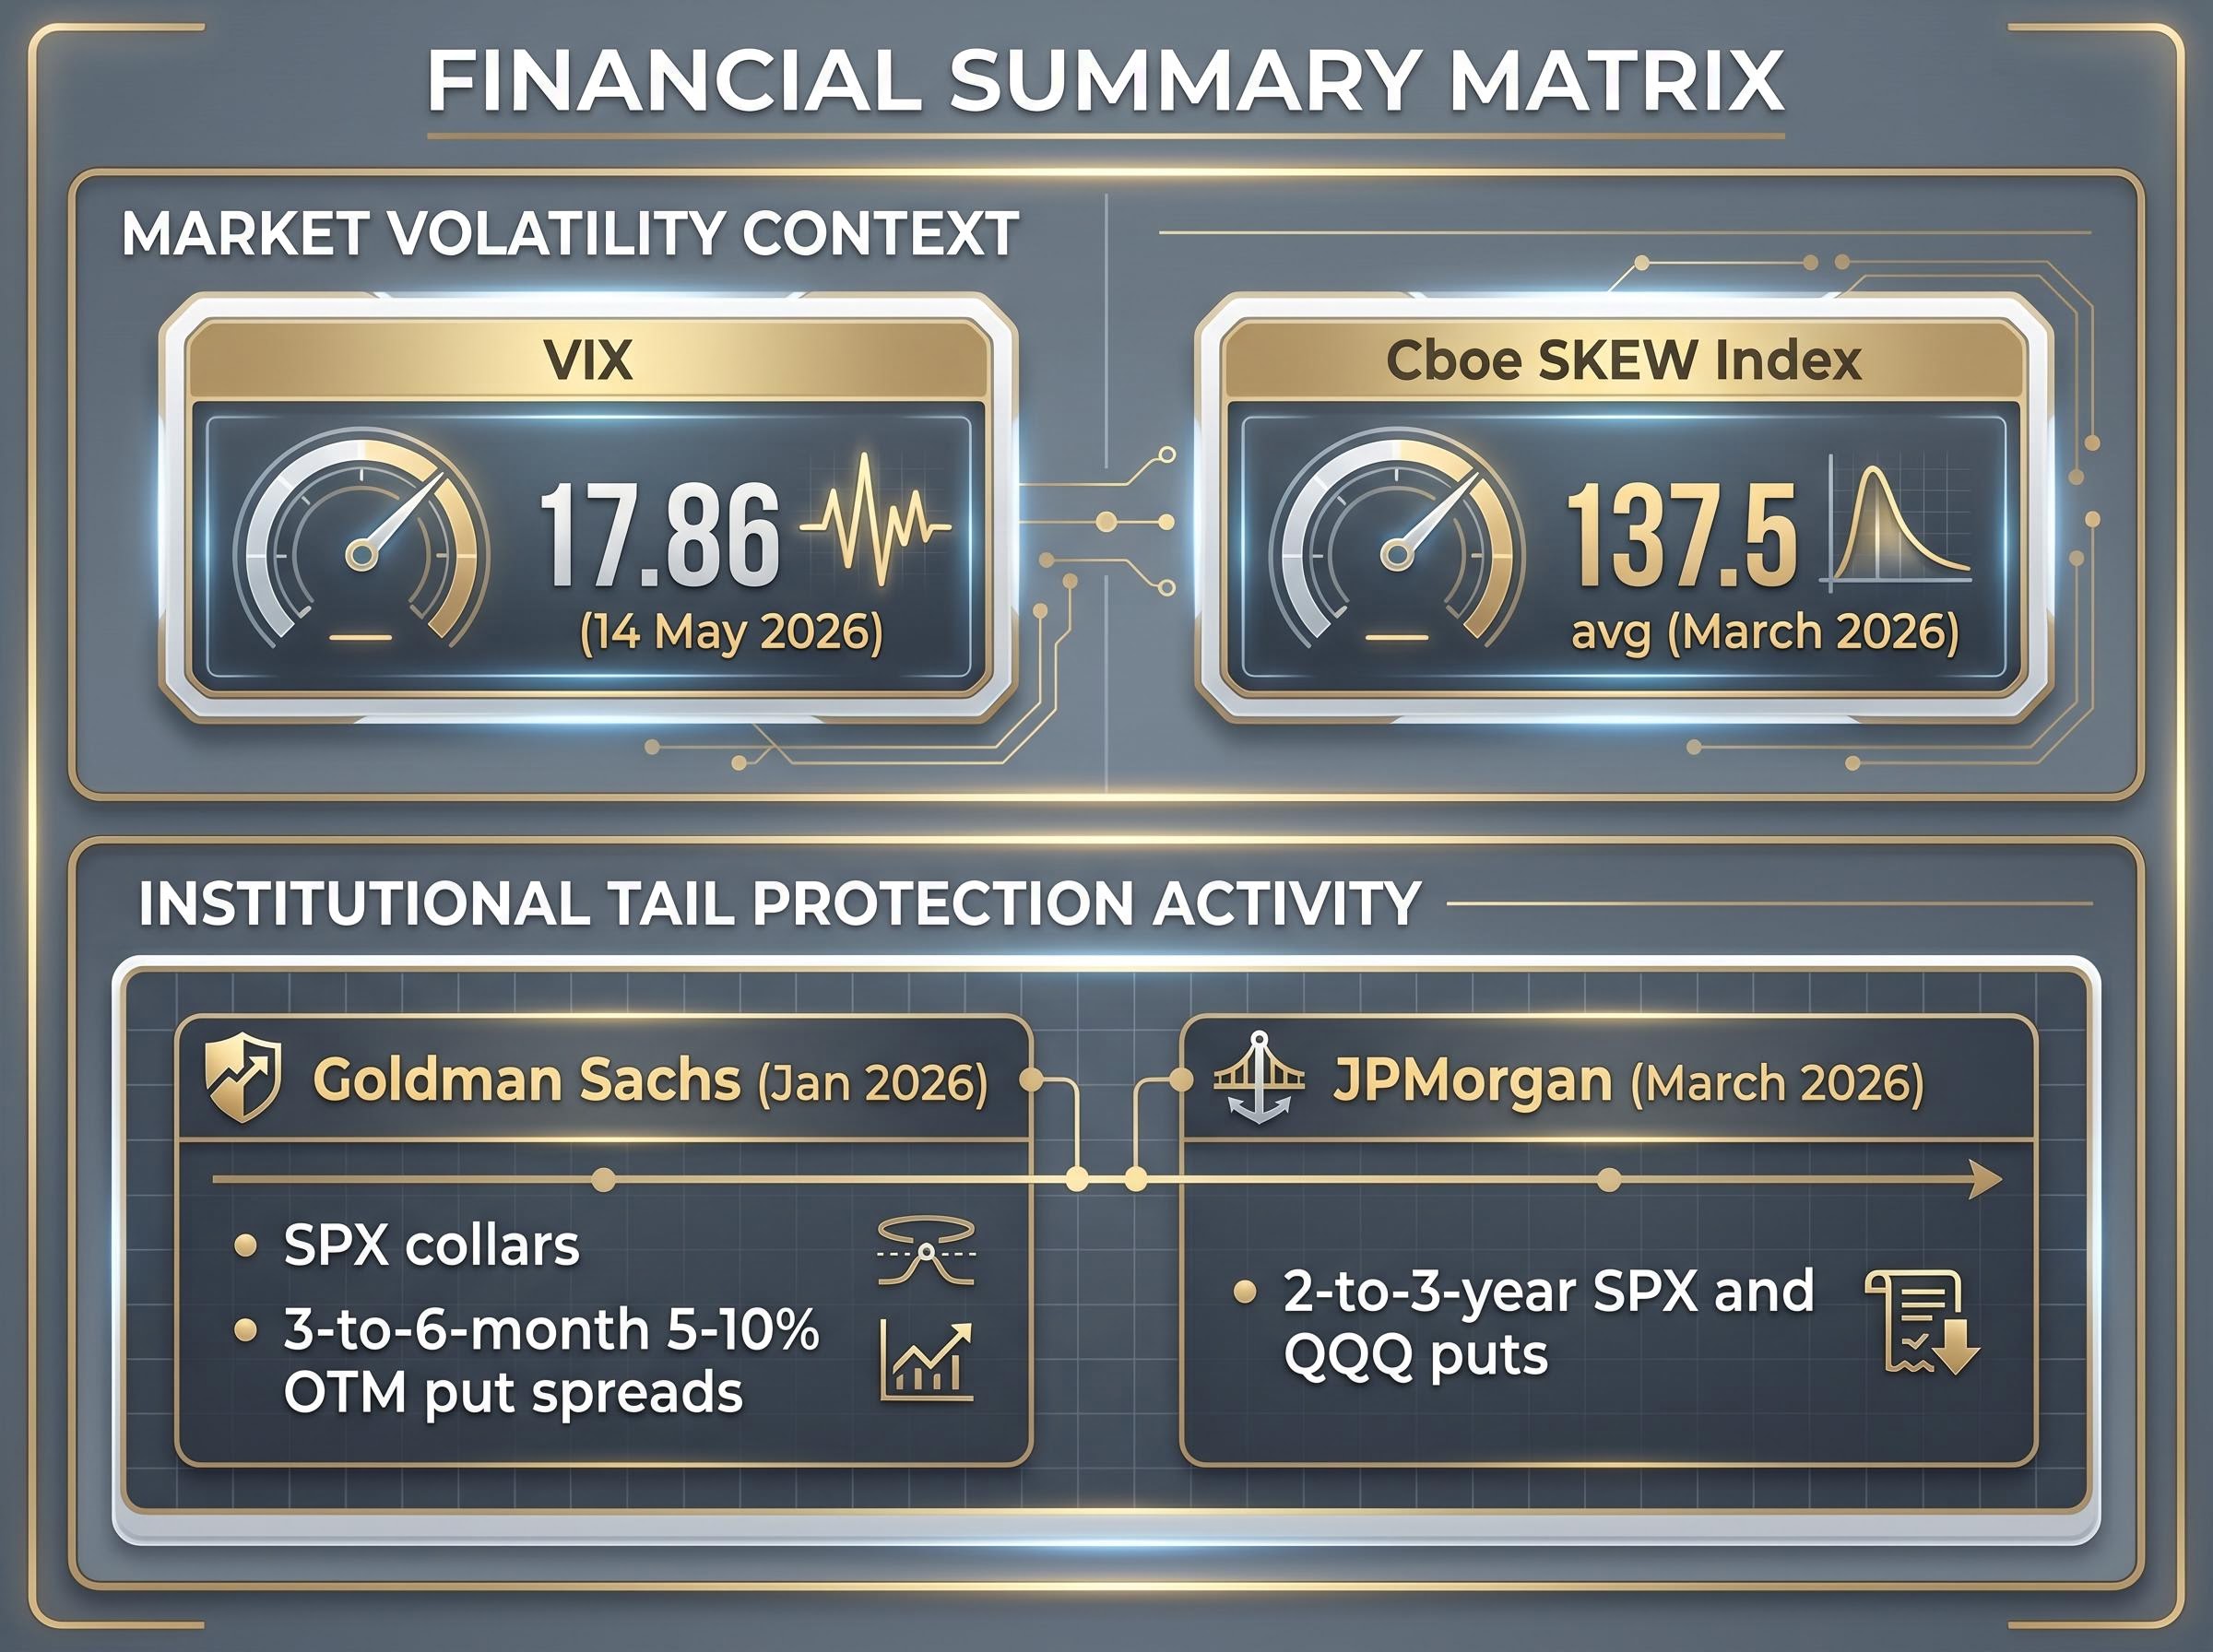
The moderate VIX front-month level (17.86 on 14 May 2026) alongside elevated skew readings tells a specific story: the market is pricing tail risk in the wings rather than across the board. Sophisticated market participants appear to be already positioning for the AI forecasting blind spot, whether or not they name it as such.
The limits of any forecasting tool are an investment opportunity, not just a risk warning
AI and prediction markets are not wrong because they are bad tools. They are wrong in predictable directions. That predictability creates a structural edge for investors who understand and correct for the bias.
Emanuel’s dual-position strategy, upside calls paired with a downside collar, is a practical embodiment of this insight. Because consensus tools compress both upside and downside tails, both long-dated call options and tail-hedging structures may be simultaneously underpriced relative to the true outcome distribution. Risk.net reported in November 2025 that practitioners found AI and ML models systematically downplay low-probability scenarios and volatility spikes. The BlackRock Investment Institute, as reported in September 2025, described GenAI tools as useful for information retrieval and scenario narration but not calibrated for market events, particularly fat tails. Evercore ISI’s own framing reinforces the point: lasting value from AI derives from domain-specific expertise and end-to-end workflow ownership, not from AI capability in isolation.
The AI hardware spending cycle itself represents a potential tail risk that standard AI-generated scenario sets are unlikely to surface: hyperscalers have committed $635 billion to $700 billion in 2026 infrastructure capital expenditure, and derivative markets appear to be underpricing the earnings correction risk that would follow if inference cost economics force a deceleration in that spend.
Three practical takeaways follow:
- Treat AI probability estimates as base case tools, not tail risk tools
- Supplement with explicit scenario analysis for below-5th-percentile and above-95th-percentile outcomes
- Consider cost-efficient hedging structures such as collars and long-dated puts where the tail premium is not yet reflected in front-month volatility
Investors who build the habit of running explicit tail scenarios alongside AI-generated base cases, and who pair that discipline with cost-efficient hedging structures, are not just managing risk. They are systematically exploiting the predictable blind spot of the tools their counterparties rely on.
The tools are useful, the overconfidence in them is not
AI forecasting tools and prediction markets are structurally biased toward the median. That bias is most severe in the exact domain where portfolio-level risk concentrates: the tails. Emanuel’s willingness to assign 30% odds to an outcome 16% above his base case is an implicit statement that standard tools will not get investors there.
As AI tools become more embedded in institutional workflows, the structural case for explicit tail risk hedging strategies only strengthens. The forecasting gap is not closing; the adoption of the tools creating it is accelerating.
This article is for informational purposes only and should not be considered financial advice. Investors should conduct their own research and consult with financial professionals before making investment decisions. Past performance does not guarantee future results. Financial projections are subject to market conditions and various risk factors.
Readers interested in exploring specific options structures for their portfolios may consider consulting a derivatives-focused financial adviser, and reviewing Cboe’s educational resources on collar strategies and index put structures.