
SK Hynix’s $26.5B Nasdaq Listing Shatters ADR Demand Records
1 hr ago
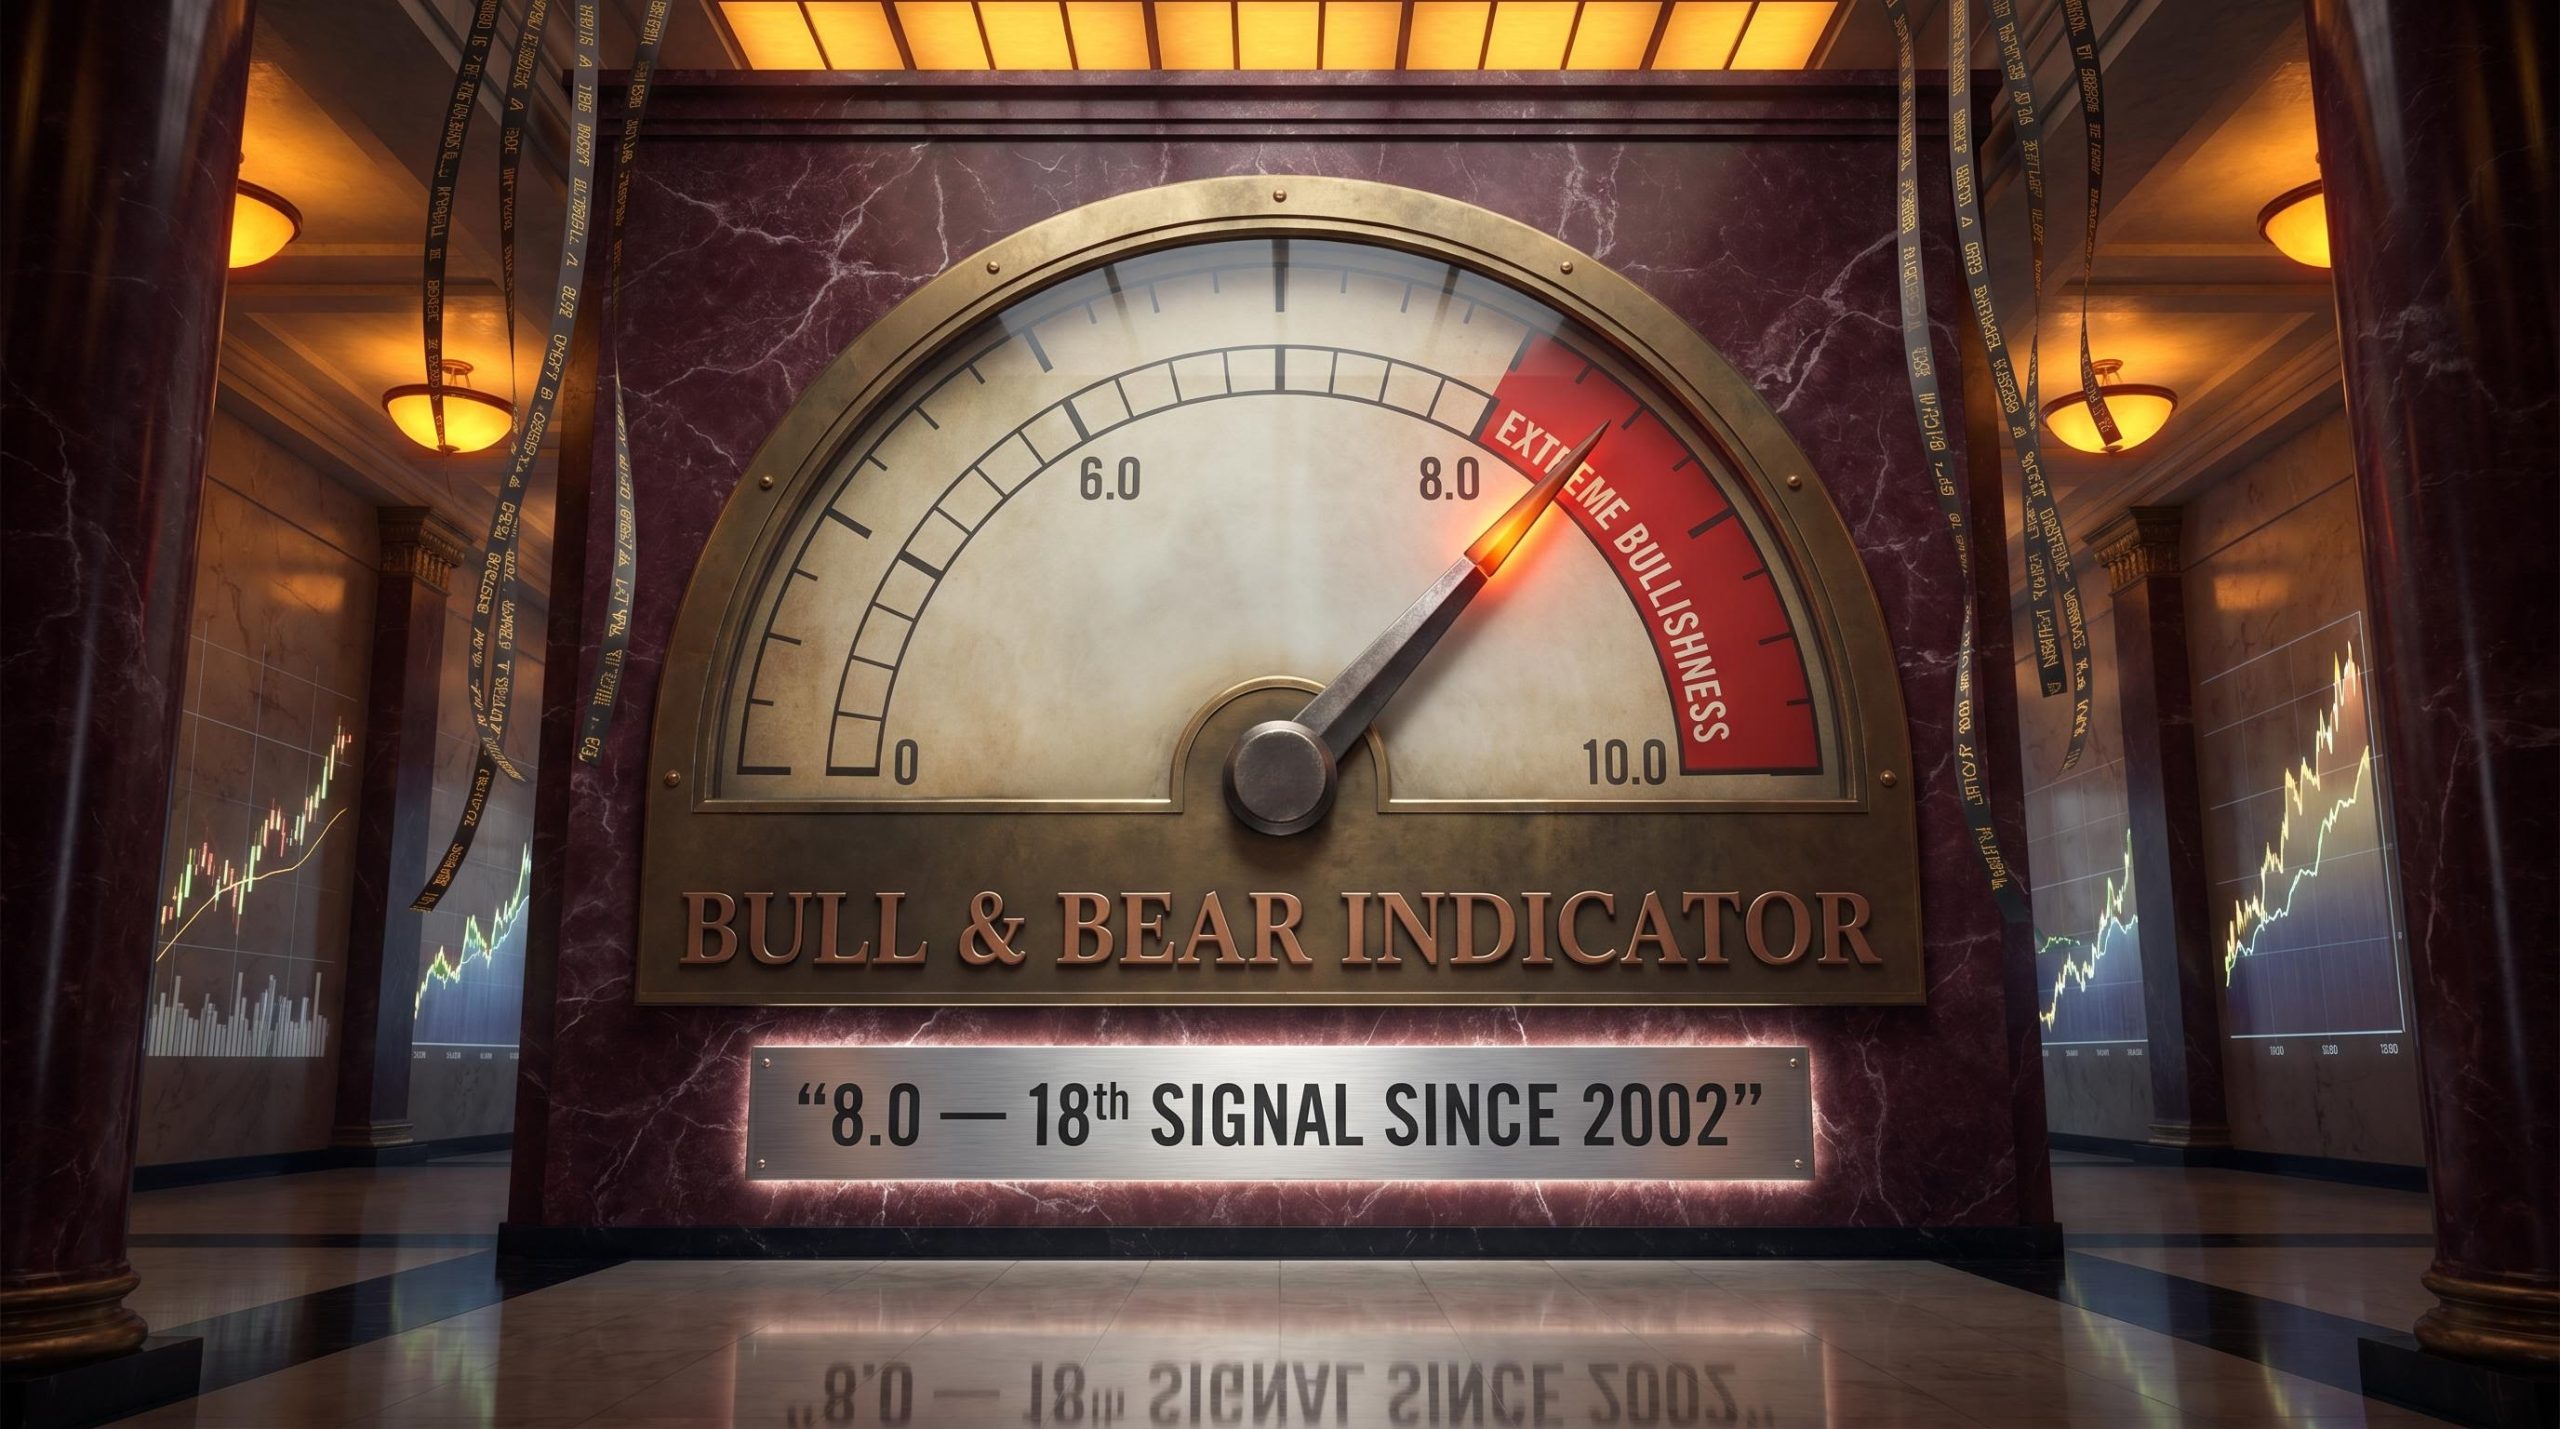
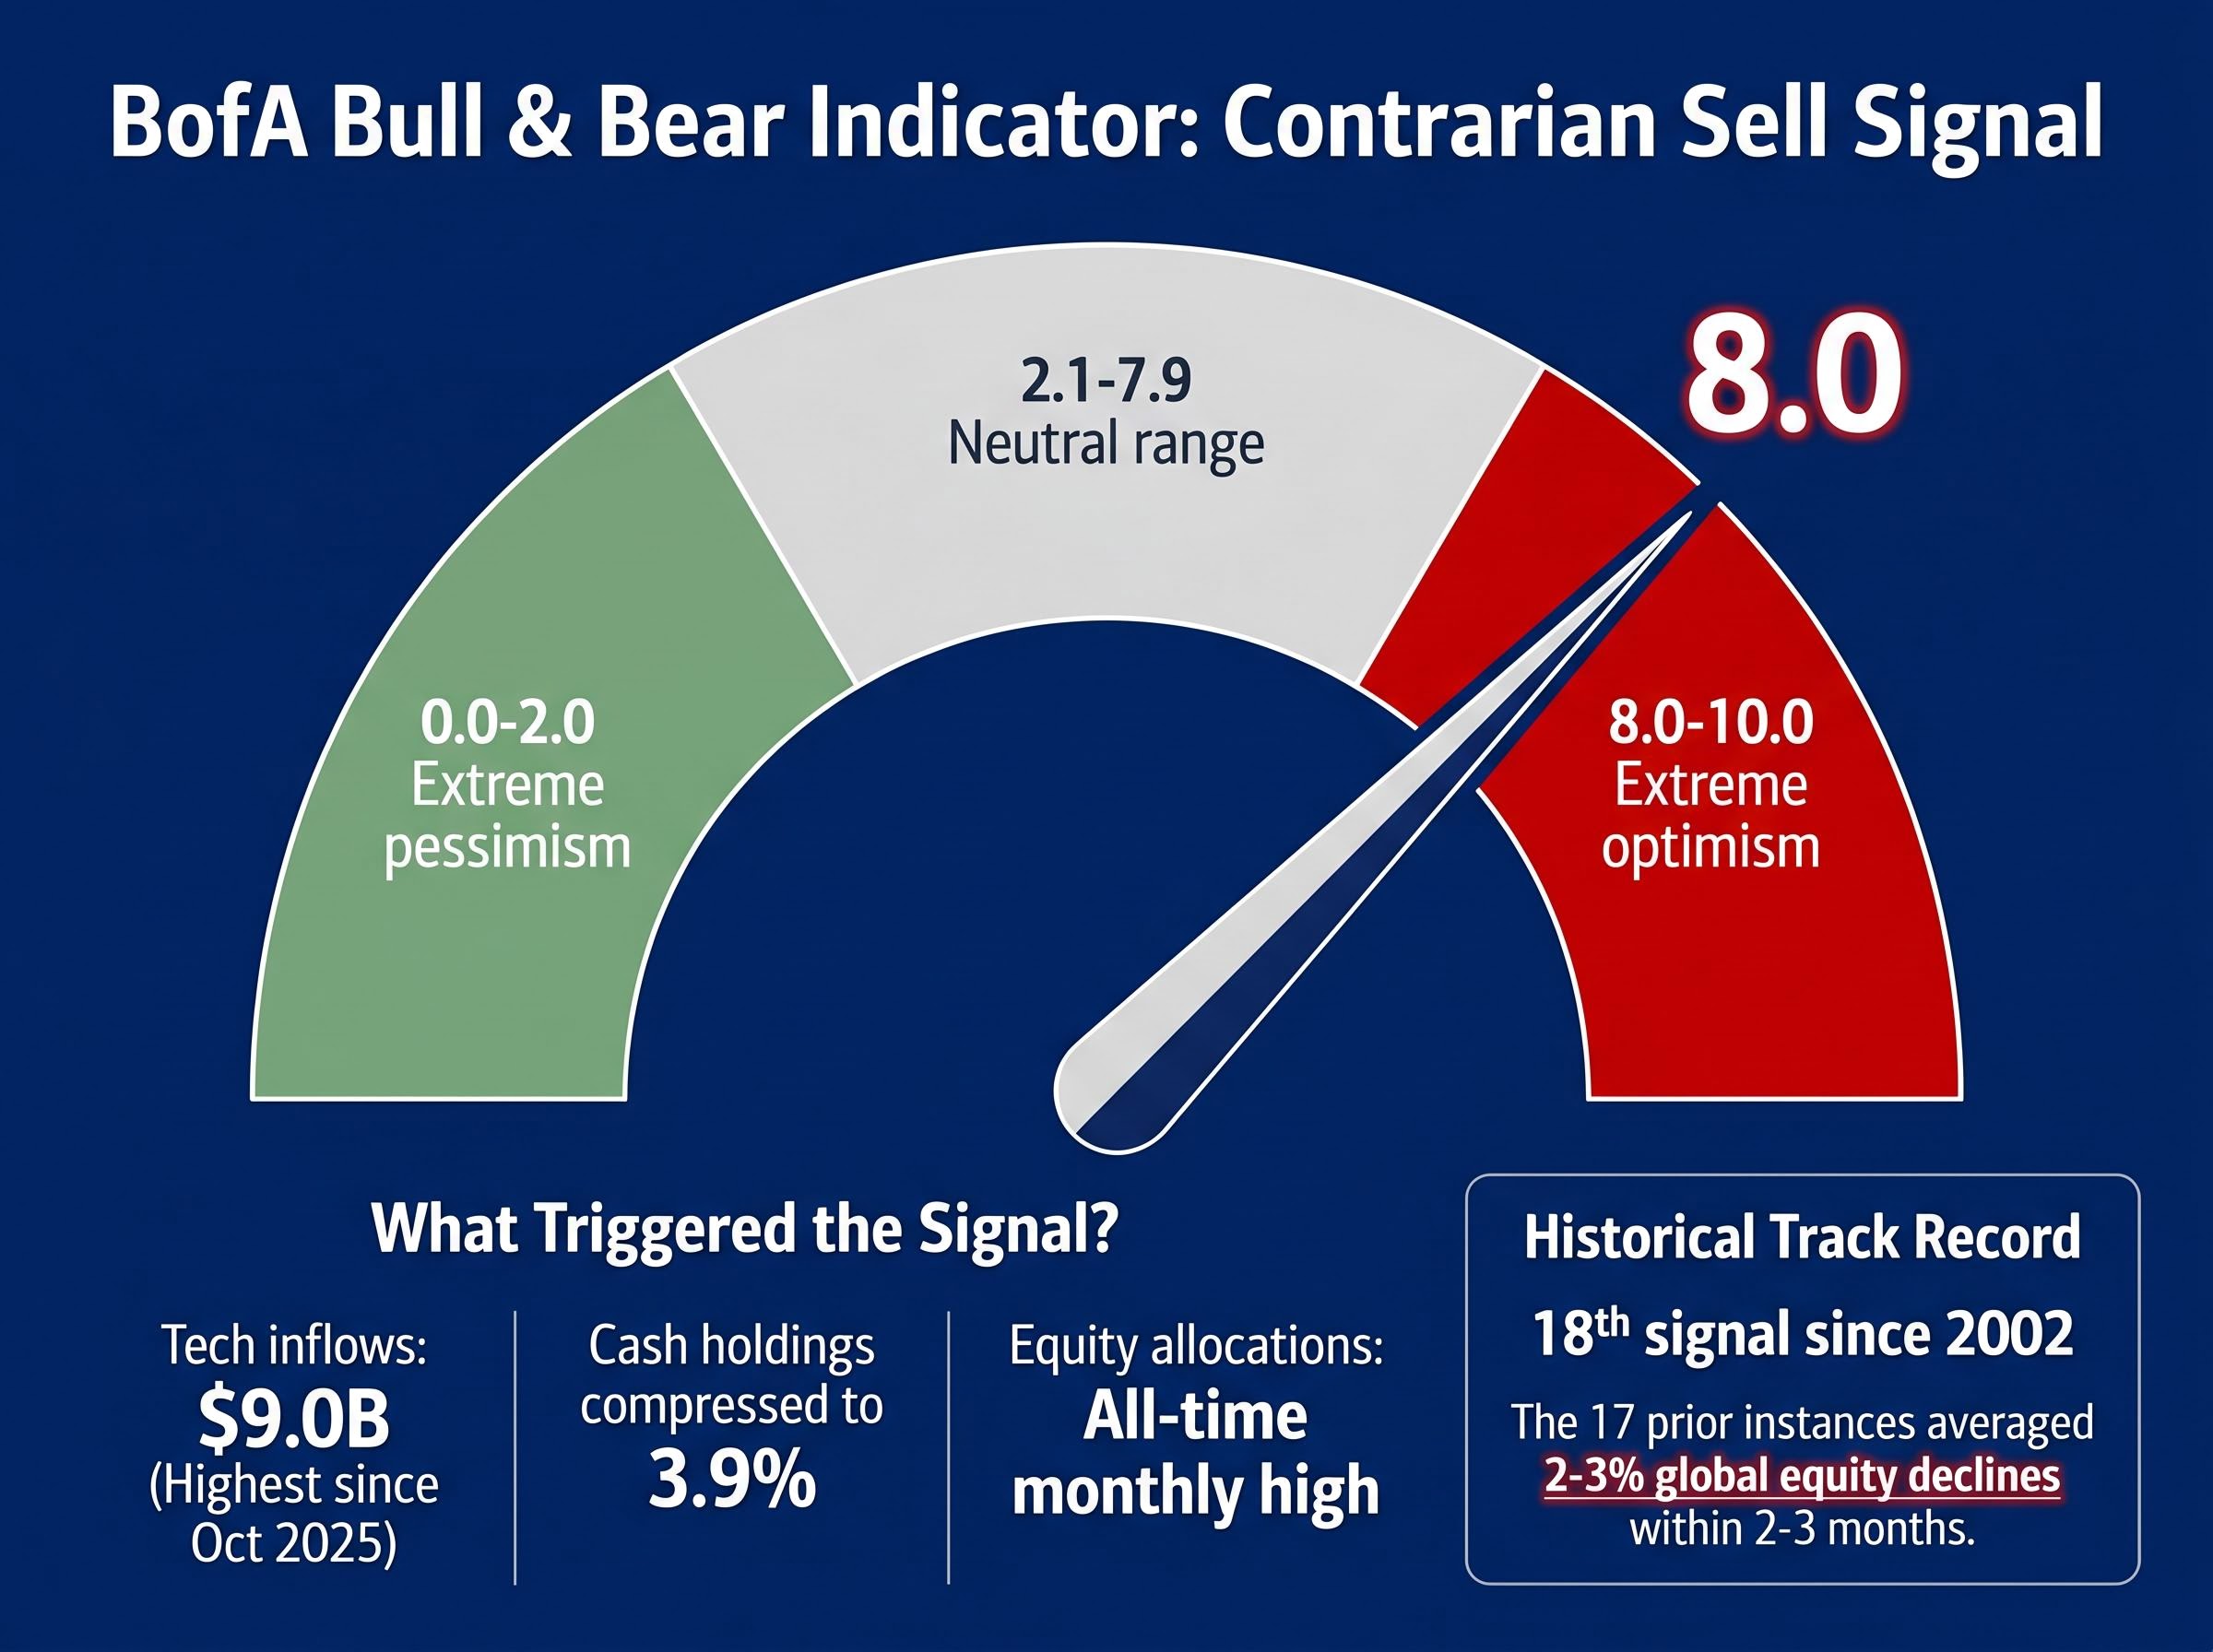
For only the 18th time since 2002, Bank of America’s most-watched sentiment gauge has crossed the threshold that has historically preceded global equity declines averaging 2-3% within three months. The BofA Bull & Bear Indicator climbed to 8.0 in the week ending 22 May 2026, up from 7.8, driven by surging technology inflows, a record shift in fund manager equity allocations, and cash holdings falling to just 3.9%. The signal is a contrarian one: extreme bullishness, in BofA’s framework, is precisely when the risk of mean-reversion is highest.
What follows breaks down what triggered the signal, what the historical record says happens next, why BofA strategist Michael Hartnett believes investors will stay long anyway, and where the firm sees contrarian opportunity once the repositioning eventually arrives.
The indicator’s move from 7.8 to 8.0 was not driven by a single data point. It was the convergence of several positioning extremes arriving in the same week.
Cash allocation: 3.9% Investor cash levels have fallen to a point historically associated with crowded equity positioning and limited dry powder for new purchases.
Each of these inputs, taken alone, would register as elevated optimism. Together, they pushed the composite gauge into the contrarian sell zone, the level at which BofA’s framework interprets aggregate investor behaviour as reflecting maximum bullishness with limited remaining buying power to sustain further gains.
The record fund manager equity overweight reported in BofA’s May 2026 survey, with global managers at a net 50% overweight and cash levels compressing to 3.9%, reflects precisely the kind of unanimous positioning that leaves markets structurally exposed to even modest disappointment.
The signal is generated by extreme optimism, not deteriorating fundamentals. That distinction matters. The economy has not broken. Earnings have not collapsed. The indicator is flagging a positioning problem, not an economic one.
A natural response to any sentiment gauge flashing red is scepticism. Why should a single number carry weight? The answer lies in how the indicator is constructed and what it captures.
The Bull & Bear Indicator is a composite measure of sentiment and positioning, not a fundamental valuation model. It aggregates fund flows, investor positioning data, and market breadth signals into a single reading on a 0-10 scale. A reading near zero reflects extreme pessimism; a reading near ten reflects extreme euphoria.
The contrarian logic works through crowd psychology. When the gauge reaches 8.0 or above, it means aggregate investor behaviour has tilted so far toward bullishness that the pool of remaining buyers has thinned. Markets need new marginal buyers to keep rising. When nearly everyone is already long, the marginal buyer disappears, and even modest selling pressure can trigger outsized declines.
| Reading range | Sentiment zone | Historical signal |
|---|---|---|
| 0.0-2.0 | Extreme pessimism | Contrarian buy |
| 2.1-7.9 | Neutral range | No signal |
| 8.0-10.0 | Extreme optimism | Contrarian sell |
The current 8.0 reading marks the 18th sell signal since 2002. Across the prior 17 instances, global stocks averaged 2-3% declines in the 2-3 months following the signal.
That consistency across more than two decades of varying market regimes, including the post-GFC recovery, pandemic-era volatility, and multiple rate cycles, is what gives the signal analytical weight. It is not a single historical episode extrapolated forward. It is a pattern that has held through structurally different environments.
The week ending 8 May 2026 offered an early warning of what was coming: approximately $136 billion rushed into cash funds at the fastest pace since January 2026, and the BofA sell signal threshold sat just 0.8 points away at a reading of 7.2, a gap the indicator closed within two subsequent reporting periods.
The signal is technically live. The historical record is clear. Yet Hartnett’s own recommendation is not to sell immediately. The reasoning centres on a specific behavioural dynamic he believes will delay the repositioning the indicator would normally prompt.
Hartnett’s analysis of the ten largest IPOs ever recorded illustrates the dual nature of this dynamic. The Alibaba and ICBC listings acted as powerful positive catalysts for Chinese equities in the post-listing period. The Visa and AIA listings, by contrast, coincided with broader market highs, with major indices declining materially in the 9-12 months that followed.
Hartnett has warned that mega-IPOs risk creating bubble-like dynamics reminiscent of the Roaring ’20s, a framing that captures both the near-term opportunity and the systemic risk embedded in the current environment.
BofA also anticipates that meaningful policy tightening is unlikely until the Consumer Price Index (CPI), a measure of inflation based on the price of everyday goods and services, reaches the 4-5% range. Until that threshold arrives, the conditions for a forced repositioning remain absent.
The dominant institutional view heading into late May 2026 supports Hartnett’s wait-and-watch framing: five major asset managers including BlackRock, Fidelity, and J.P. Morgan maintained overweight equity stances, a consensus that reflects the same late-cycle equity positioning the Bull and Bear Indicator now flags as stretched, with the tension between intact fundamentals and crowded sentiment visible across the institutional landscape.
The weekly fund flow data corroborates what the 8.0 reading captures in aggregate. The money movements for the week ending 22 May 2026 show a pattern of concentrated positioning across asset classes.
| Asset class | Direction | Weekly amount | Context |
|---|---|---|---|
| Bond funds | Inflow | ~$30.5B | 56th consecutive week of net inflows |
| Equity funds | Inflow | ~$2.4B | Modest relative to bond flows |
| Treasuries | Inflow | ~$10.8B | Largest in nine weeks |
| Crypto funds | Outflow | ~$1.5B | Largest withdrawal since February 2026 |
Beneath the headline equity bullishness, selective risk aversion is visible. Emerging market equities recorded approximately $7.9 billion in outflows across a six-week consecutive streak, the longest since November 2024. European equities saw their sixth straight week of net outflows. Financials (approximately $2.4 billion in outflows) and materials (approximately $2.9 billion) also saw capital depart.
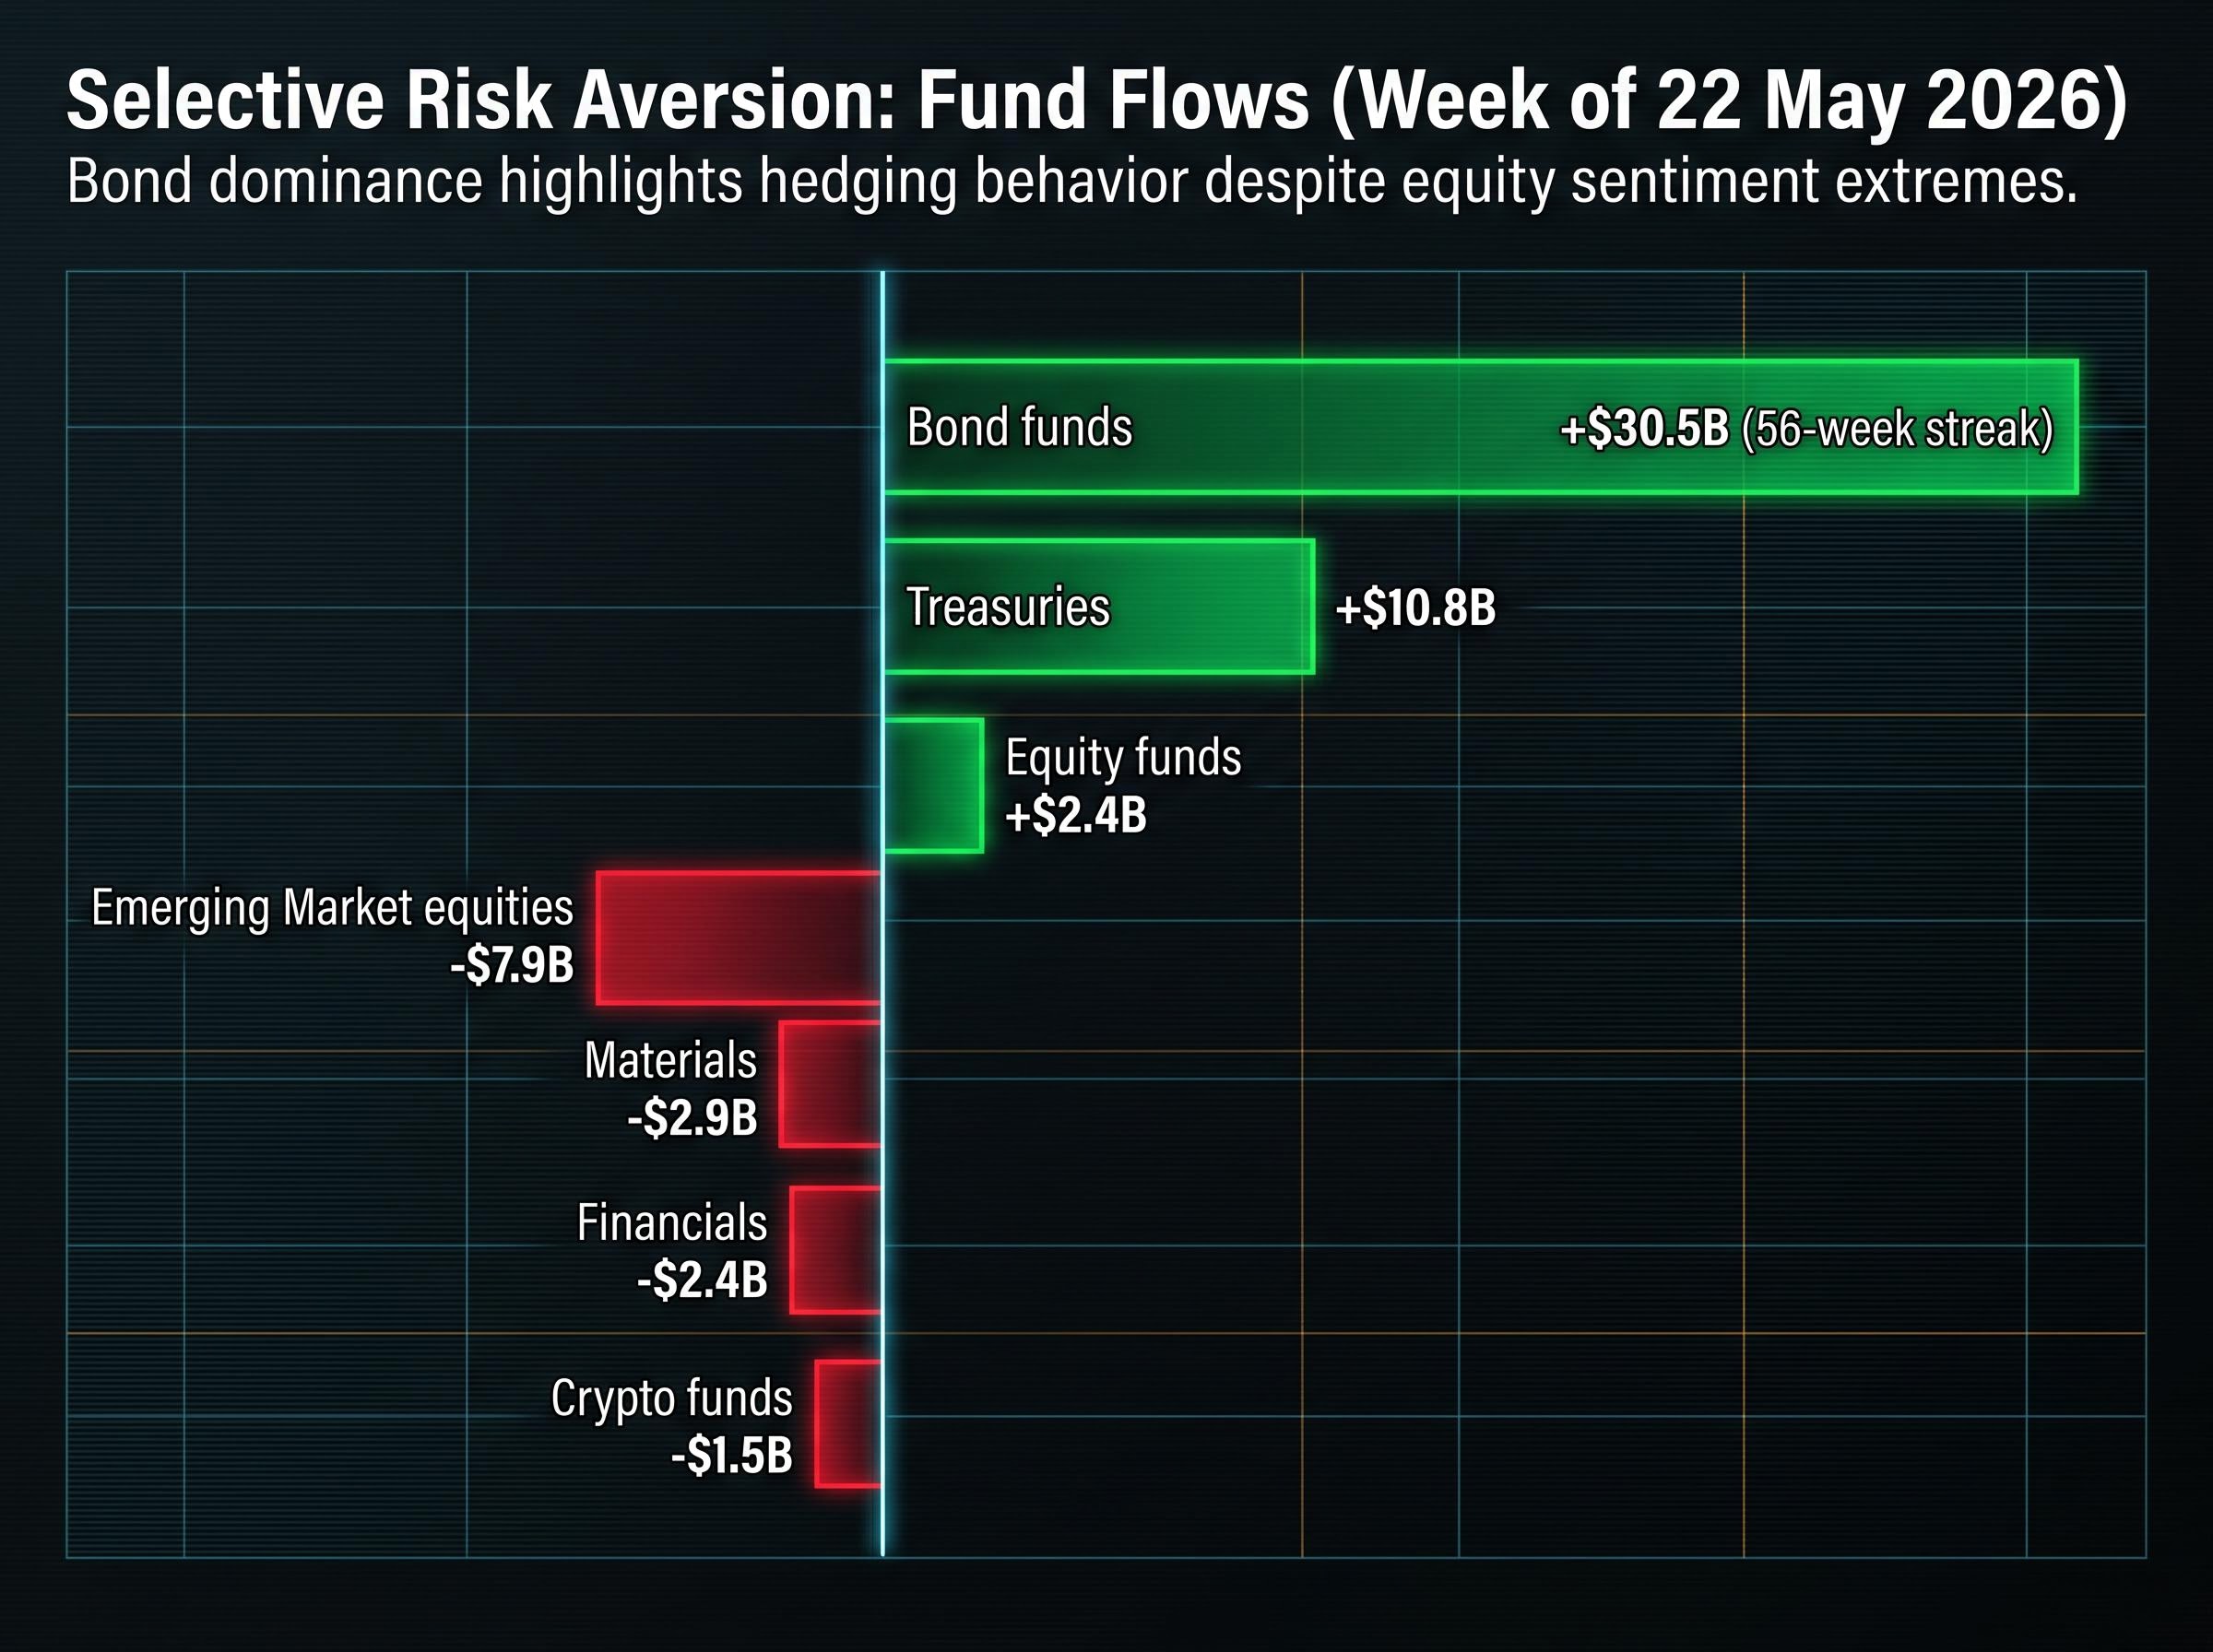
Bond funds remain the dominant capital destination even as equity sentiment stretches to extremes. The 56-week inflow streak into fixed income suggests that a significant portion of the market is already hedging against the very risk the Bull & Bear Indicator is now flagging.
Once the repositioning does arrive, BofA has identified three areas it considers mispriced relative to the current consensus:
The breadth data reinforces BofA’s framing: the Russell 2000 outpaced the S&P 500 by more than 6 percentage points year to date through May 2026, and institutional fund flows into the small-cap rotation surged from approximately 8% of equity inflows in 2025 to approximately 25% in 2026, consistent with BofA’s characterisation of AI small-caps as the next phase of the theme rather than a continuation of the mega-cap trade.
BofA draws a parallel to the post-Nifty Fifty period of the late 1970s, when a narrow group of large-cap darlings gave way to a broader market of smaller companies that delivered superior returns over the subsequent decade. The firm characterises the optimal AI investment opportunity as small-cap companies using artificial intelligence to disrupt incumbent market structures, positioning it as a structural theme rather than a near-term trade.
The core tension is straightforward. The BofA sell signal carries a documented track record: 17 prior instances, each followed by average global equity declines of 2-3% within 2-3 months. The pattern is consistent. The statistical basis for caution is real.
Yet Hartnett’s own advice is to let the IPO wave play out before repositioning. Two things are simultaneously true: the signal is valid and the timing for acting on it is complicated.
The conditions BofA associates with the repositioning moment are specific enough to monitor:
Global stocks averaged 2-3% declines in the 2-3 months following each of the prior 17 sell signals since 2002.
The signal is a monitoring tool, not a mechanical sell trigger. The historical record says what tends to happen. The IPO dynamic, the flow data, and the CPI trajectory will determine when.
This article is for informational purposes only and should not be considered financial advice. Investors should conduct their own research and consult with financial professionals before making investment decisions. Past performance does not guarantee future results.
—
The BofA Bull and Bear Indicator is a composite sentiment and positioning gauge that aggregates fund flows, investor positioning data, and market breadth signals into a single reading on a 0-10 scale, where readings at or above 8.0 signal extreme bullishness and have historically preceded global equity declines.
Across the 17 prior instances since 2002, global stocks averaged 2-3% declines in the 2-3 months following each sell signal, a pattern that has held through structurally different market environments including the post-GFC recovery, pandemic-era volatility, and multiple rate cycles.
The indicator climbed to 8.0 in the week ending 22 May 2026 due to the convergence of approximately $9 billion in technology sector inflows, a record monthly high in fund manager equity allocations, and investor cash holdings falling to just 3.9%.
Hartnett believes a historic pipeline of major IPOs will keep institutions long in the near term, as investors are unlikely to trim equity exposure ahead of high-profile listings they want to participate in, delaying the repositioning the indicator would normally prompt.
BofA has identified consumer equities trading below post-GFC lows relative to the S&P 500, AI-focused small-cap companies disrupting incumbent market structures, and emerging markets and commodities as three areas it considers mispriced relative to the current consensus.