
Goldman Sachs has issued a pointed warning about the S&P 500’s AI-driven momentum surge, identifying the current episode as one of the steepest on record. The investment bank’s research, published on 16 May 2026, found that in 11 comparable episodes since 1980, the pattern that followed was nearly always the same: roughly one more month of gains, then a reversal. The warning arrives with the S&P 500 trading near 7,445 and carrying a year-to-date return of approximately 8–9%, but with an estimated 85% of those gains concentrated in technology stocks. That kind of narrow dominance has historically preceded vulnerability, not continuation. What follows is a breakdown of what Goldman’s data shows, how the current episode compares to historical analogs, which specific triggers could tip momentum into reverse, and where the bank suggests investors look for shelter.
Goldman Sachs just flagged a momentum reading that has historically ended badly
Goldman’s momentum factor, a measure of how sharply the market’s winning stocks have outpaced its losers, rose approximately 25% over the three months leading into mid-May. That is one of the most pronounced moves on record for this metric.
Goldman Sachs reported its momentum factor gained approximately 25% in three months, described as among the most pronounced surges on record.
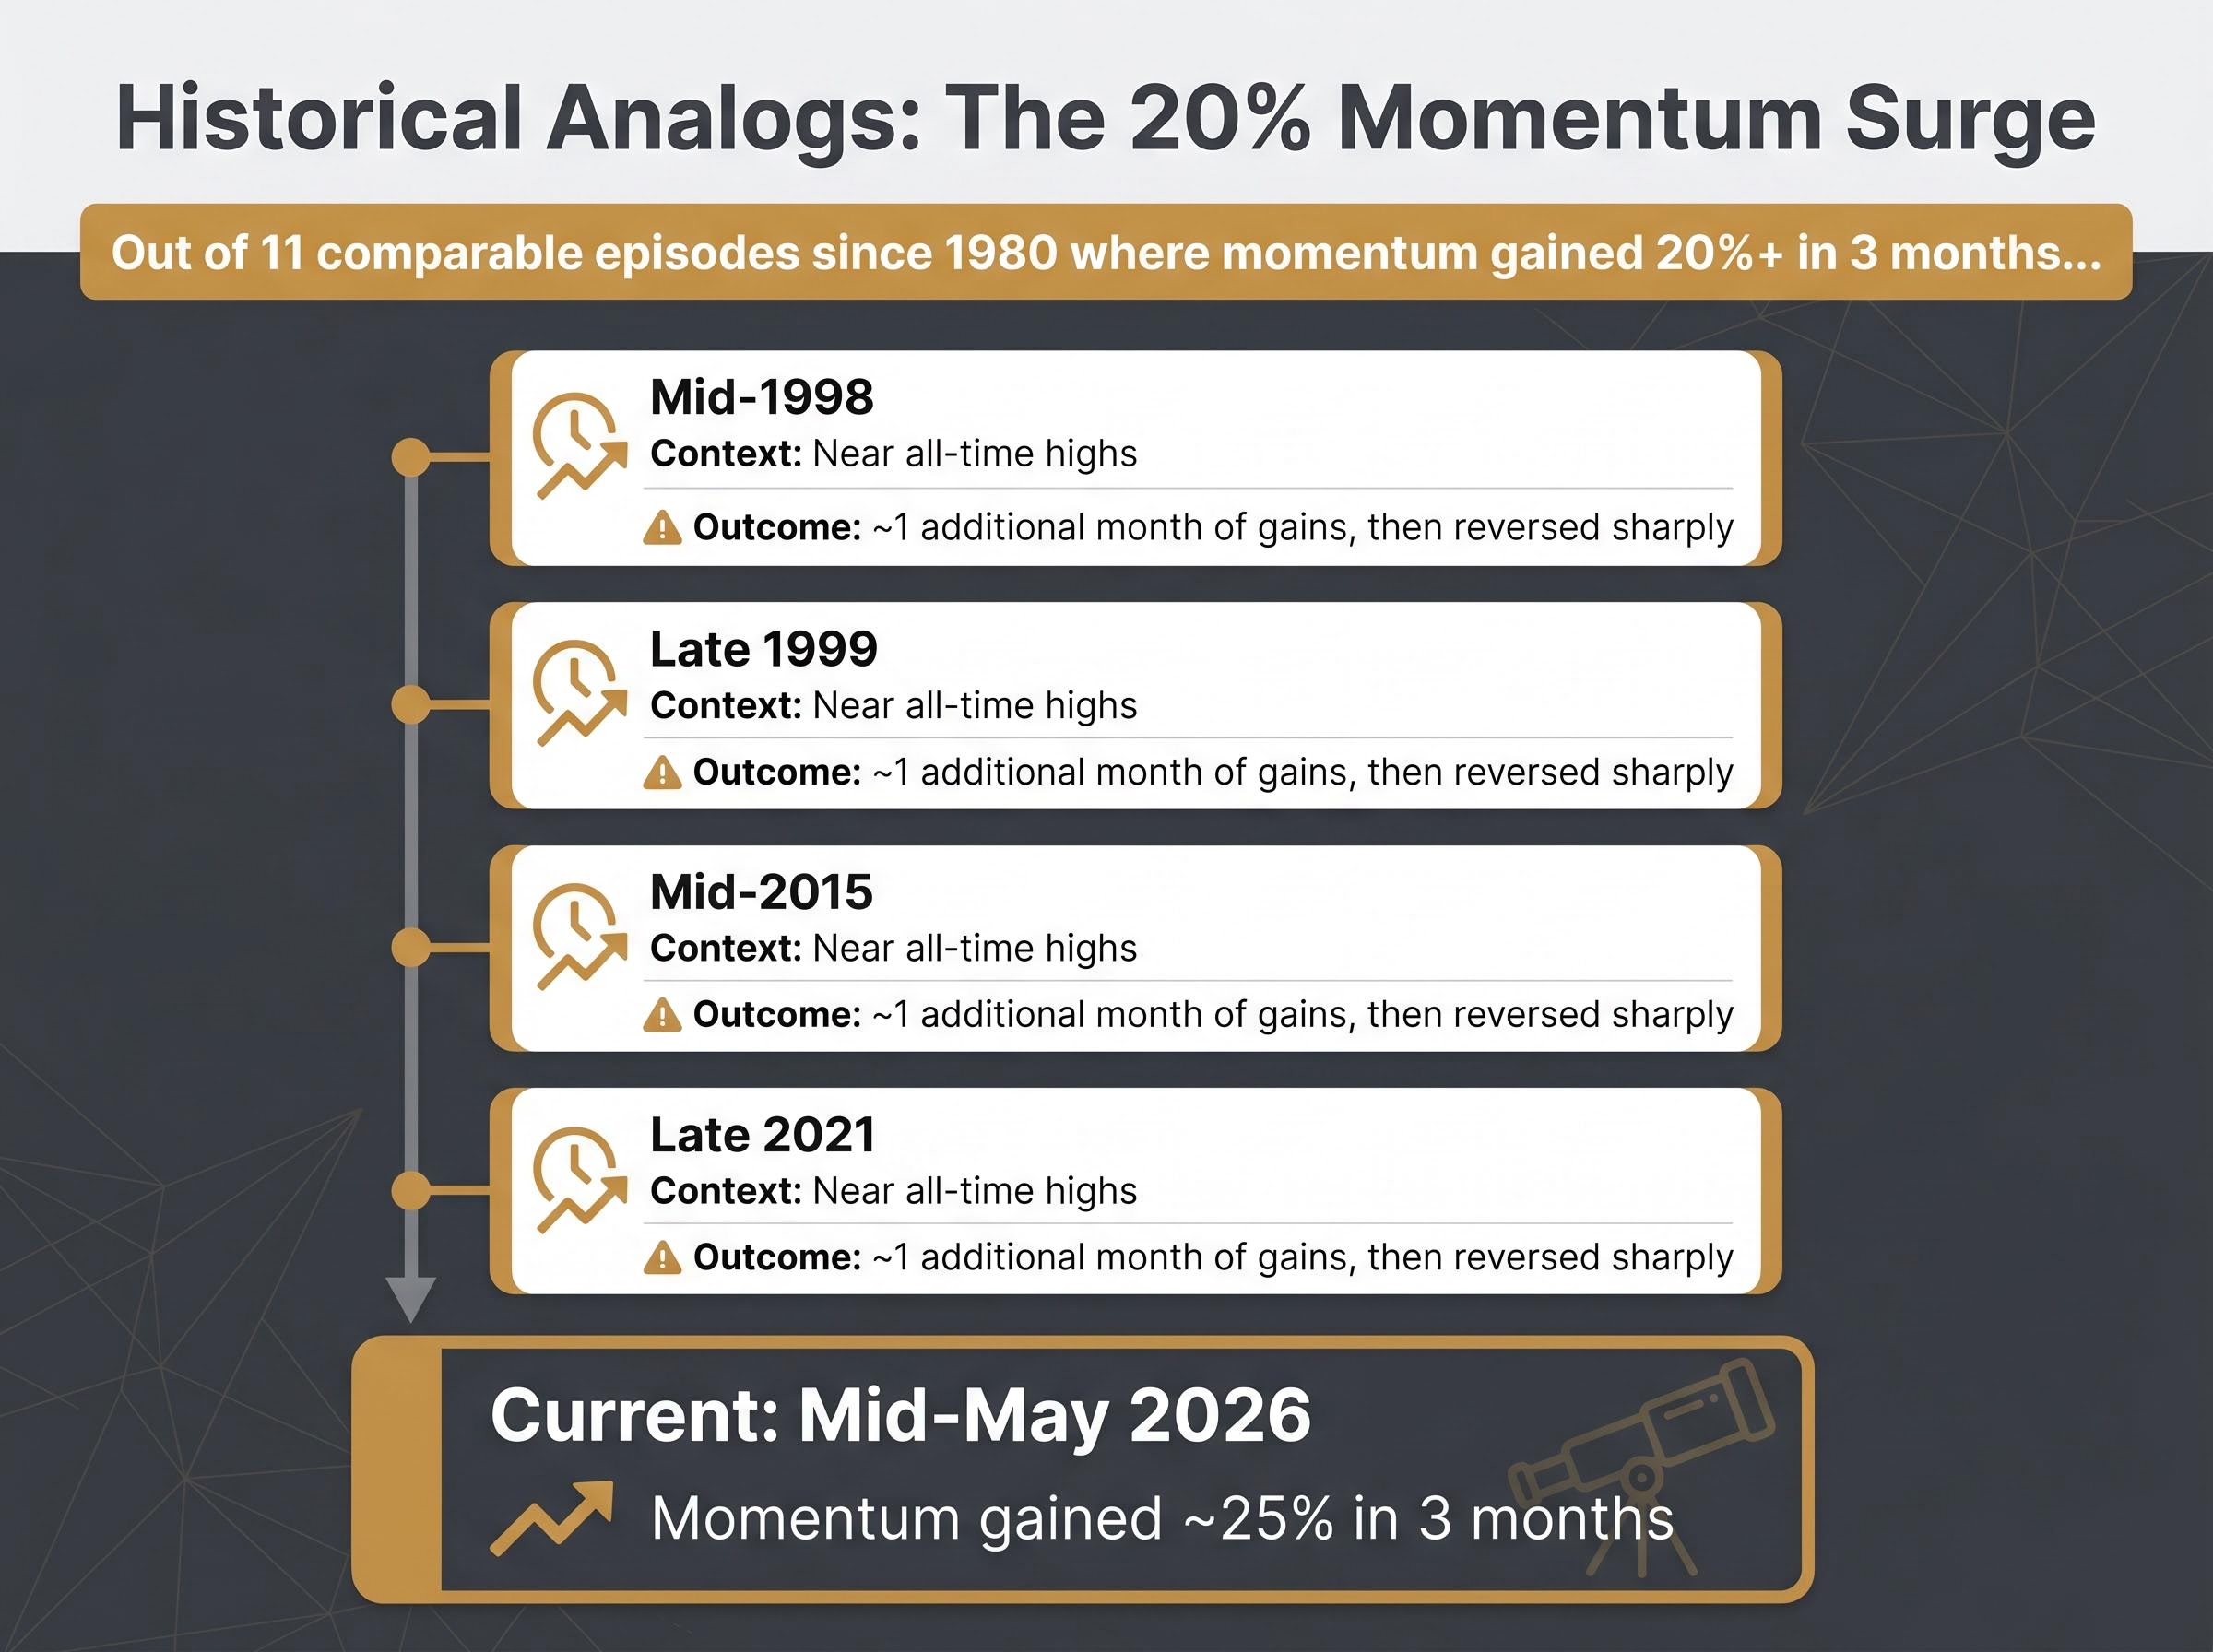
The scale of the move is what prompted the bank to search for precedent. Goldman’s quantitative team identified 11 episodes since 1980 where the momentum factor gained 20% or more in a three-month window. None of those episodes ended with a quiet transition back to normal. Every one of them eventually reversed, and the pattern of reversal was remarkably consistent across four decades of market history.
This is not a general call for caution. It is a named, quantified signal from a specific institution, and the historical base rate behind it is what gives the warning its weight.
When big ASX news breaks, our subscribers know first
What the last 40 years of comparable momentum surges actually produced
The 11 historical episodes share a common sequence. In most cases, momentum continued advancing for approximately one additional month after crossing the 20% threshold before peaking and then declining. The extra month of gains was the pattern’s most seductive feature; it gave investors just enough time to believe the surge was sustainable before conditions changed.
Goldman named four specific periods as the closest analogs to the current environment: mid-1998, late 1999, mid-2015, and late 2021. Each one shared a defining characteristic with today. The S&P 500 was trading near record highs at the time momentum peaked.
| Period | Market context | Momentum extension | Subsequent outcome |
|---|---|---|---|
| Mid-1998 | Near all-time highs | ~1 additional month of gains | Reversed sharply |
| Late 1999 | Near all-time highs | ~1 additional month of gains | Reversed sharply |
| Mid-2015 | Near all-time highs | ~1 additional month of gains | Reversed sharply |
| Late 2021 | Near all-time highs | ~1 additional month of gains | Reversed sharply |
The regularity across these episodes is what makes the pattern difficult to dismiss. Four different macro environments, four different market narratives, and all four produced the same outcome once momentum peaked.
The NBER research on momentum crashes identifies these reversals as partly forecastable, concentrated in periods of elevated crowding and rapid prior gains, which aligns closely with the conditions Goldman’s quantitative team is flagging in the current environment.
How concentrated this rally really is, and why that makes the warning sharper
The concentration figures beneath the headline index return tell a more uncomfortable story than the 8–9% year-to-date gain suggests.
- S&P 500 total YTD return: approximately 8–9%
- Technology’s share of those gains: approximately 85%
- S&P 500 excluding technology YTD return: approximately 3%
Strip out the AI-linked technology cluster and the S&P 500 has delivered a fraction of what the headline number implies. That gap between the index return and the ex-tech return is one of the widest in recent history, and it changes the nature of the momentum risk Goldman is flagging.
The momentum warning does not exist in isolation: with market breadth at 30-year lows and just 28 of 503 S&P 500 members driving half of recent returns, the structural underpinning of the rally is as narrow as it has been at any point since the mid-1990s.
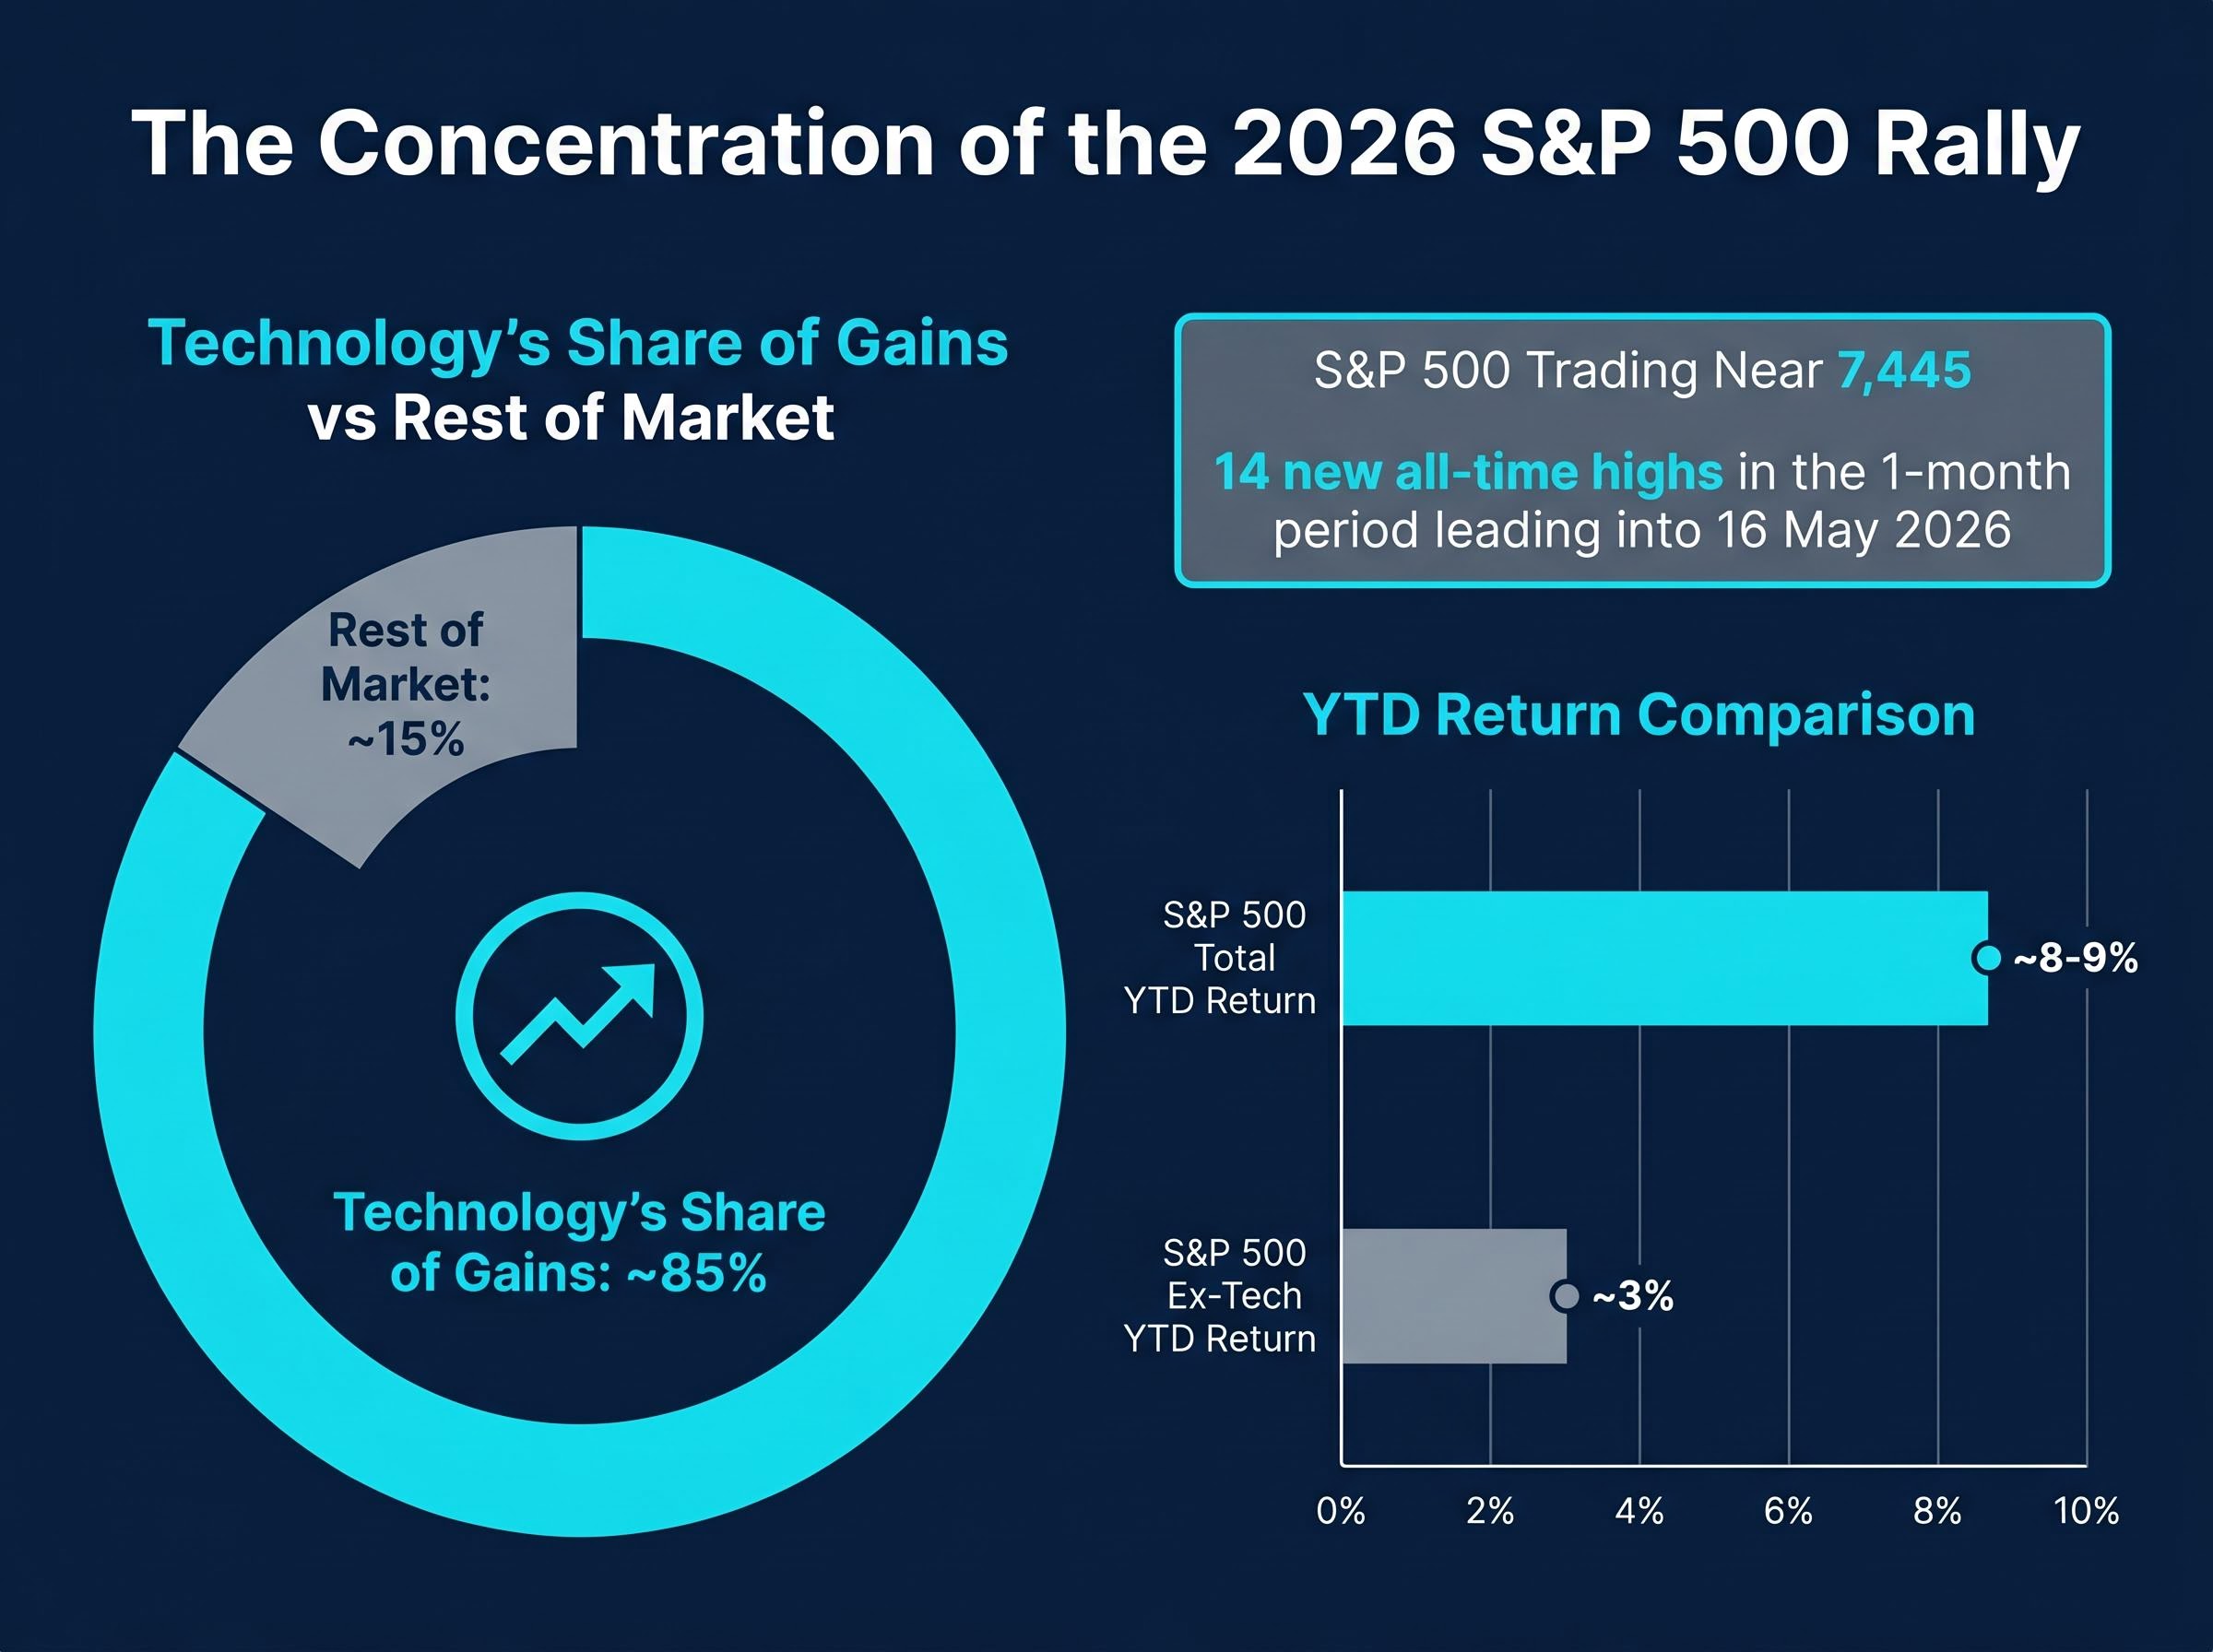
The S&P 500 recorded 14 new all-time highs in the one-month period leading into 16 May 2026, reinforcing the near-record context that has accompanied every prior momentum reversal in Goldman’s dataset.
When one thematic cluster drives nearly all of an index’s gains, a momentum reversal in that cluster is not a rotation story where capital shifts from one sector to another. It is a whole-index event. The concentration data is what transforms Goldman’s momentum warning from a factor-level observation into a headline-level risk for anyone benchmarked to the S&P 500.
What Goldman Sachs says could actually trigger the reversal
Goldman identified three specific categories of catalyst that could tip the current momentum surge into decline:
- A deterioration in AI capital expenditure expectations: If major cloud and semiconductor firms signal slower spending on AI infrastructure, the earnings growth story underpinning the trade weakens immediately.
- A significant worsening of the macro environment: Weaker labour market data, slowing growth, or persistent inflation that forces higher-for-longer interest rates would compress valuations on long-duration growth stocks, which dominate the momentum basket.
- A sharp improvement in broad-market breadth: Counterintuitively, if lagging sectors stage a strong rally and capital rotates away from AI winners, the concentrated momentum trade unwinds even in a rising market.
The AI capital expenditure cycle now running at 4.9% of U.S. GDP has surpassed every prior technology investment peak, including the dot-com buildout, which means any guidance disappointment from hyperscalers carries systemic weight rather than representing an isolated sector correction.
The third trigger is particularly worth watching. It does not require bad news to materialise; it only requires that the rest of the market catches up, diluting the dominance of the AI trade.
Hedge fund positioning adds a layer of severity to any potential unwind. Gross leverage and net momentum exposure across the hedge fund industry sat near five-year highs at the time of Goldman’s report, meaning a reversal could be amplified by forced deleveraging.
Why earnings revisions have kept the momentum trade alive so far
Goldman distinguishes the current episode from some prior analogs by pointing to one supportive factor: earnings estimates have been moving in the right direction. Bottom-up consensus earnings-per-share estimates for both 2026 and 2027 each rose approximately 8% year-to-date, driven primarily by AI capital expenditure expectations and elevated energy prices.
That positive revision trend is the main reason the momentum surge has persisted as long as it has. It also frames the warning correctly. Goldman is not making a definitive peak call. The bank is noting that the historical pattern is clear, and that earnings trajectory is the variable most likely to determine whether this episode follows the same path or proves to be an exception.
Where Goldman suggests investors look if they want to reduce AI trade exposure
For investors who accept the historical pattern’s relevance and want to reduce their exposure to a potential momentum unwind, Goldman offered a specific screening framework. The bank recommends focusing on equities that meet three criteria:
- Positive earnings revisions (companies where the fundamental outlook is improving)
- Low sensitivity to AI-related themes (stocks not dependent on AI capital expenditure or the AI narrative)
- Low sensitivity to broader economic growth signals (names that hold up regardless of macro direction)
Consumer Staples emerged from Goldman’s screening as the sector carrying the lowest dual sensitivity to both AI-related themes and general economic growth factors. It is the sector least likely to be caught in an AI momentum unwind and least vulnerable to a macro deterioration.
Defensive positioning under rate pressure adds a second dimension to portfolio hedging beyond sector rotation: in environments where higher-for-longer rates compress long-duration growth valuations, the quality filters that make Consumer Staples attractive to Goldman also overlap with the pricing-power and low-debt criteria that have historically held up under sustained monetary tightening.
The recommendation does not require a bearish view on the economy or even a conviction that the AI trade is over. It requires only an acknowledgment that concentration at these levels, combined with momentum readings that have historically preceded reversals, warrants some portfolio-level hedging. With hedge fund momentum exposure near five-year highs, the severity of any unwind could exceed what the underlying fundamentals alone would suggest.
The AI rally is not over, but history says the runway is getting shorter
Goldman’s dataset covers 11 episodes across more than four decades. The consistent pattern is roughly one additional month of gains after the momentum threshold is crossed, followed by a reversal. By that measure, the current surge is at a historically late stage.
The bull case remains intact for now. Earnings revisions are supportive, AI capital expenditure plans from major technology firms remain elevated, and the index continues to print new highs. Goldman’s warning is probabilistic, not a definitive call that the peak has arrived.
The melt-up scenario has its own institutional advocates: BCA Research has argued the S&P 500 could extend a further 27% toward 9,200 if the self-reinforcing loop of AI earnings beats, institutional deployment, and retail inflows continues, a trajectory that would require the current momentum surge to break the historical pattern Goldman has identified across 11 prior episodes.
The data points worth watching in the weeks ahead are specific: AI capital expenditure guidance in upcoming earnings reports from infrastructure spenders, macro releases covering growth and inflation, and any signs that market breadth is expanding beyond the technology cluster. Those are the leading indicators that will determine whether the historical pattern reasserts itself or whether this episode becomes the twelfth to break the mould.
This article is for informational purposes only and should not be considered financial advice. Investors should conduct their own research and consult with financial professionals before making investment decisions. Past performance does not guarantee future results. Financial projections are subject to market conditions and various risk factors.
—