Brent crude broke through $90 per barrel on Sunday evening. Not because traders reacted to a headline, but because tankers stopped moving.
The weekend exchange of U.S. and Iranian military strikes has pushed hostilities to their most severe point since an April 2026 ceasefire collapsed, and the Strait of Hormuz, normally carrying roughly one-fifth of the world’s seaborne oil, has fallen to a fraction of its normal vessel traffic. What began months ago as a geopolitical risk premium embedded in crude prices has crossed into something categorically different: a live, measurable supply shock with no immediate resolution in sight.
Here is the price move, the physical disruption driving it, and the five variables that will determine whether this rally holds, accelerates, or reverses in the days ahead. Each matters differently depending on whether you are tracking energy markets, equity exposure, or the broader inflation picture.
Brent clears $90 as markets reprice from risk premium to supply shock
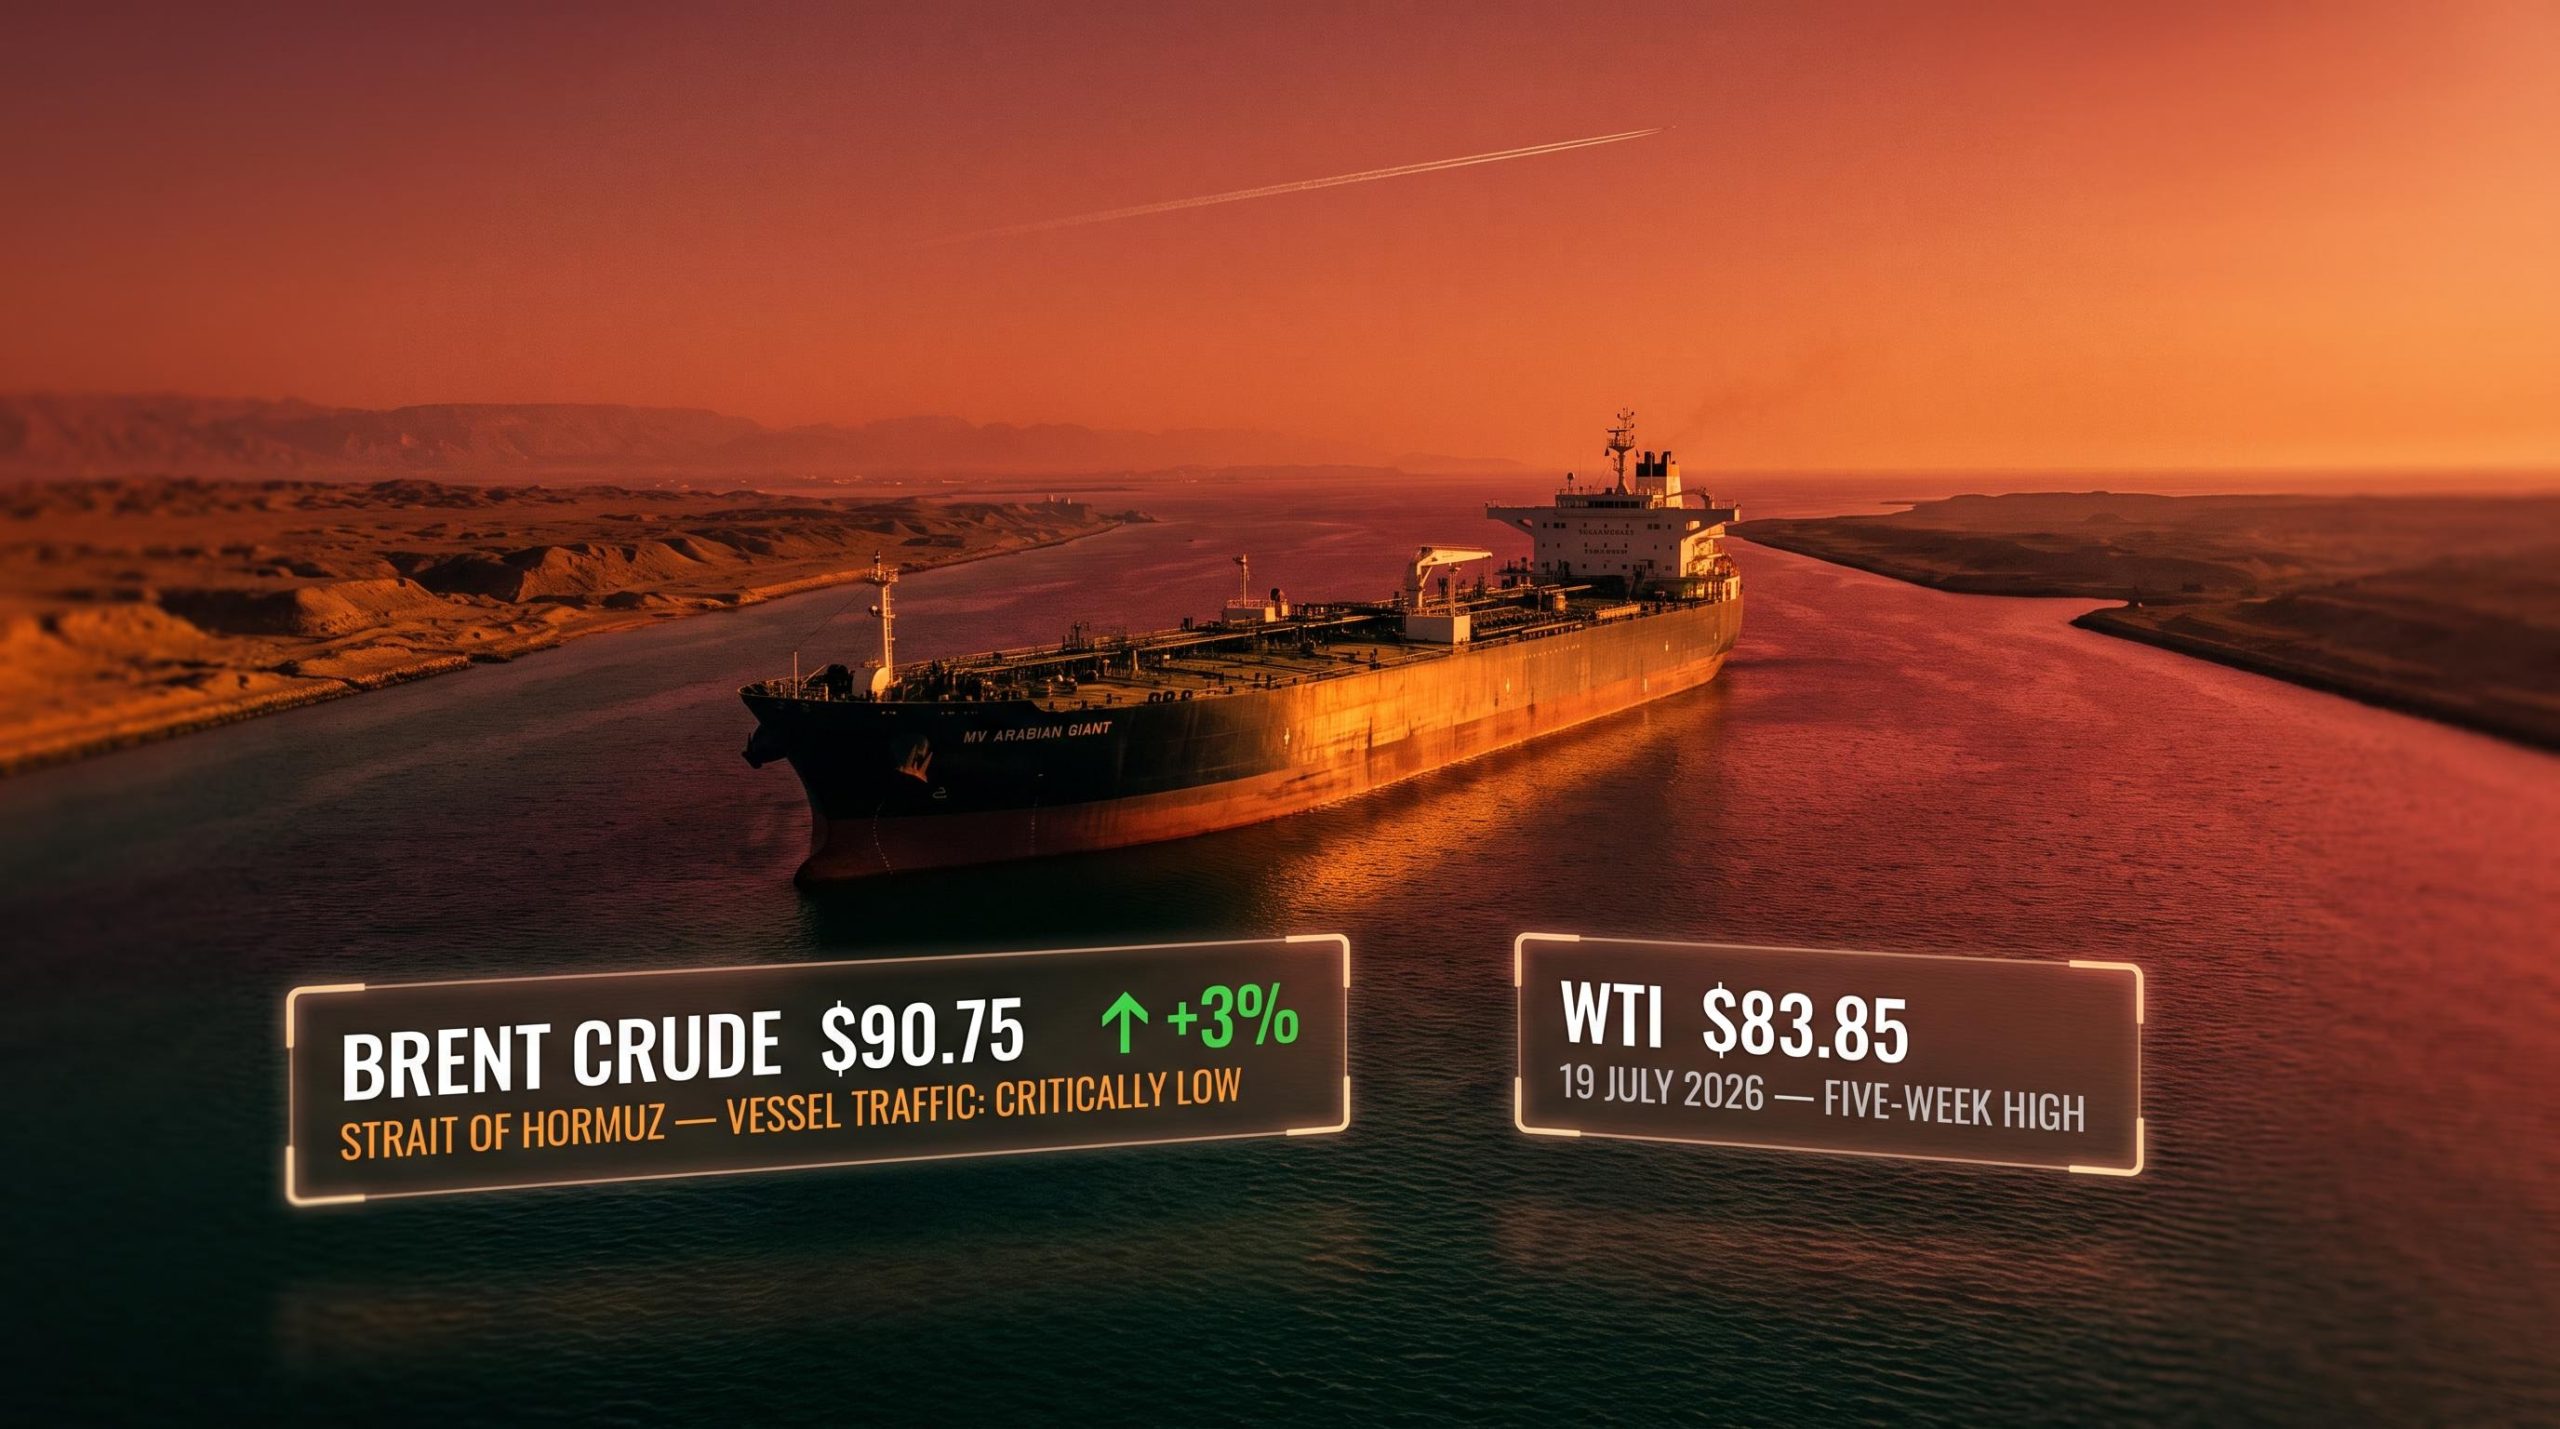
Brent crude reached $90.75 per barrel by 19:51 ET on 19 July 2026, marking a gain of approximately 3% on the session and a five-week high. West Texas Intermediate advanced around 2.5% over the same period, settling at $83.85 per barrel. Brent futures are now trading in the $90-$93 range.
- Brent crude: $90.75/barrel, up approximately 3%, five-week high
- WTI crude: $83.85/barrel, up approximately 2.5%
- Brent futures range: $90-$93 in current trading
- Prior 2026 WTI peak: near or above $100/barrel during peak war-fear pricing earlier this year
Brent at $90.75 per barrel marks a five-week peak and breaks above a level that traders treat as the threshold between a risk premium and a supply shock.
The $90 level is not arbitrary. It is the price where professional traders stop treating Hormuz disruption as a temporary flare and start pricing in the possibility that the strait stays impaired for weeks. Earlier in 2026, WTI touched near $100 during peak conflict fears before pulling back. That level is back in the conversation. If you hold any portfolio with energy, inflation, or rate-sensitive exposure, the shift from risk premium to supply-shock pricing changes your calculus.
When big ASX news breaks, our subscribers know first
How two weeks of strikes dismantled the April ceasefire
Each step in this escalation made the next one structurally harder to avoid.
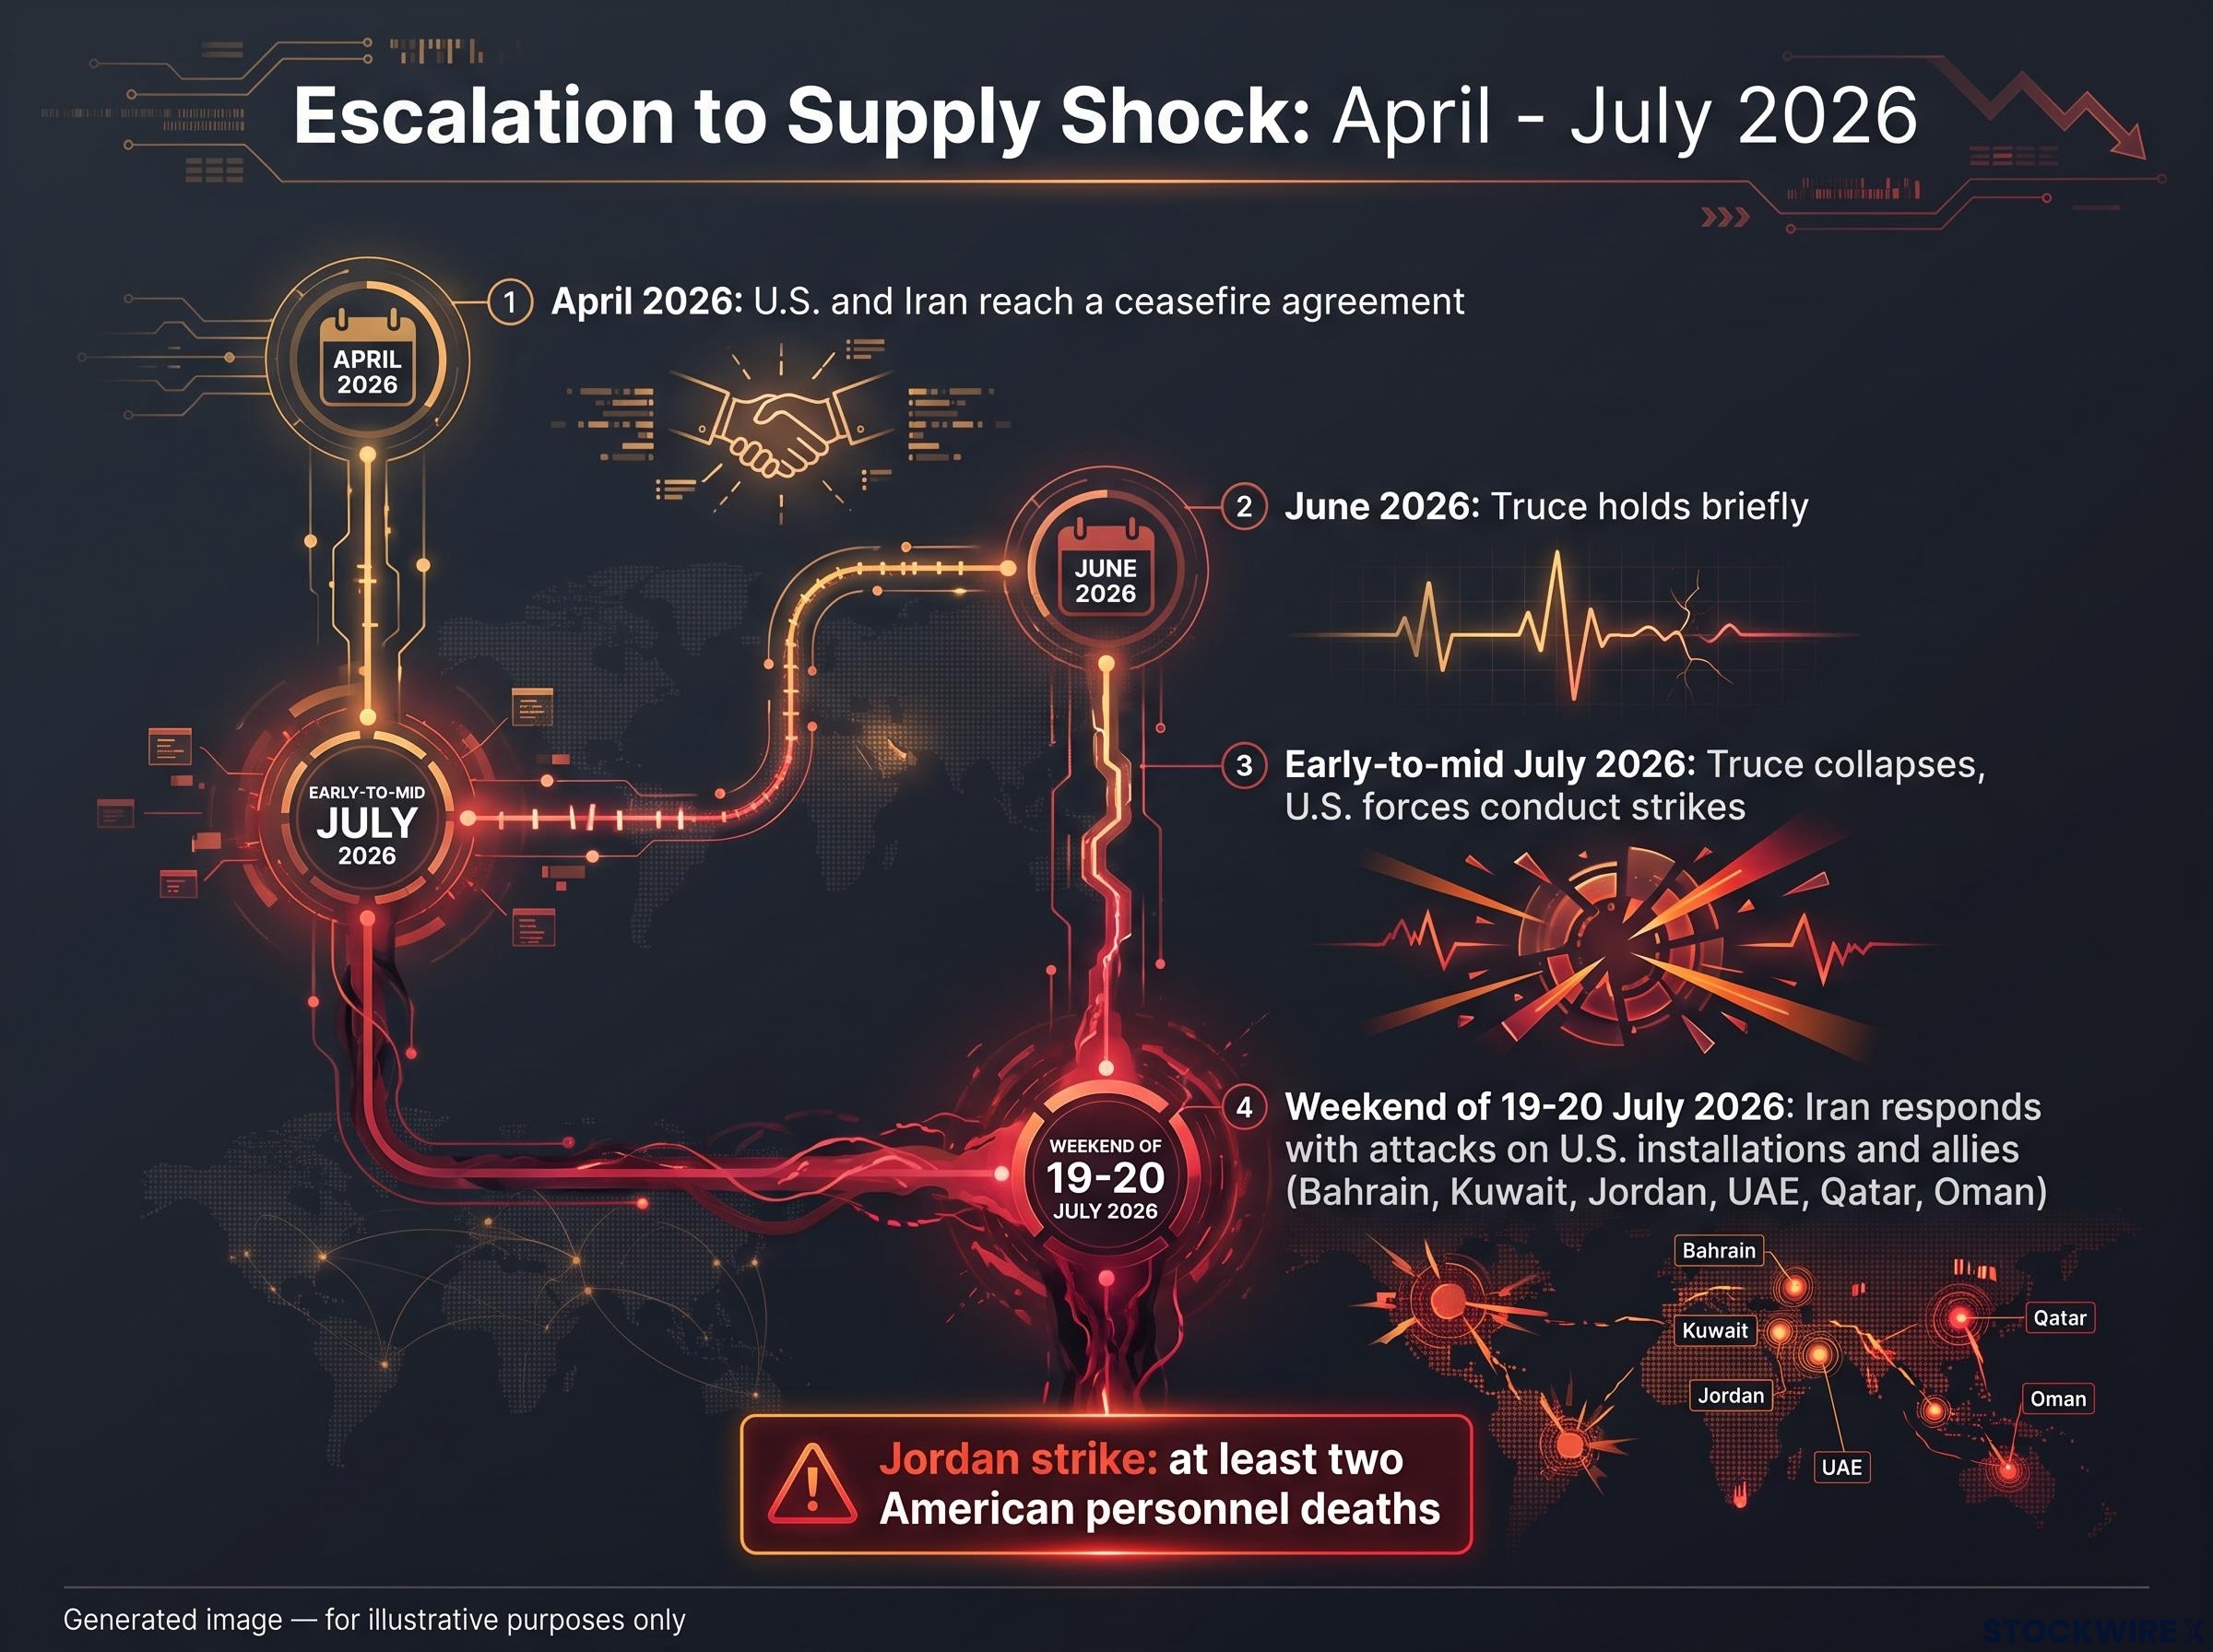
- April 2026: The U.S. and Iran reach a ceasefire agreement, temporarily stabilising markets and pulling crude off its earlier highs.
- June 2026: A subsequent truce holds briefly, keeping diplomatic channels technically open.
- Early-to-mid July 2026: The truce collapses. U.S. forces begin conducting repeated waves of strikes on Iranian targets, including coastal surveillance infrastructure, air defences, maritime assets, and missile and drone facilities tied to attacks on commercial shipping.
- Weekend of 19-20 July 2026: Iran responds with missile and drone attacks on U.S. military installations and Gulf allies, including Bahrain, Kuwait, Jordan, UAE, Qatar, and Oman. The exchanges reach their most severe intensity since the April ceasefire was established.
The ceasefire collapse in early July followed Iran’s attack on three commercial vessels near Hormuz on 7 July 2026, which prompted U.S. strikes on 60-80 Iranian military targets and repriced a supply-risk premium that markets had briefly discounted during the truce period.
The Jordan strike and why it matters
According to U.S. Central Command (CENTCOM), an Iranian attack targeting a U.S. military base in Jordan resulted in the deaths of at least two American personnel and left a number of others with injuries. Those casualties are the data point that shifts this conflict’s trajectory. Both Washington and Tehran now face domestic pressure to escalate rather than negotiate. A quick diplomatic resolution, the kind that briefly capped prices after the April ceasefire, is structurally harder this time.
The current price level does not reflect one weekend’s headlines. It reflects the accumulated weight of a two-week deterioration in which each exchange of fire narrowed the space for de-escalation.
The Strait of Hormuz and why one waterway controls global energy flows
The Strait of Hormuz is a narrow passage between Iran and the Arabian Peninsula. It is the world’s most important energy chokepoint, and the numbers explain why the market reaction to its disruption is proportionate, not panicked.
Approximately 20% of the world’s seaborne oil trade passes through the Strait of Hormuz, along with a significant share of global liquefied natural gas (LNG) flows.
Since the latest escalation, multiple tankers and at least one container ship have been attacked or harassed near the strait. Threat assessments for transit have been raised to severe. Insurance and liability costs have soared, triggering a sharp pullback by commercial operators. By 19-20 July 2026, the volume of vessels transiting the waterway had dropped to only a small share of what moved through it before the conflict began.
| Commodity | Hormuz share of global trade | Key importing regions at risk | Alternative routing options | Constraint on alternatives |
|---|---|---|---|---|
| Crude oil | ~20% of seaborne trade | Asia (China, Japan, South Korea, India), Europe | East-West Pipeline (Saudi Arabia), Abu Dhabi pipeline (UAE) | Limited pipeline capacity; cannot replace full tanker volumes |
| LNG | Significant share (Qatar is world’s largest exporter) | Europe, Japan, South Korea | No viable pipeline alternative for LNG | LNG must transit by sea; no bypass route exists |
This is not purely an oil story. European and Asian gas importers depend on the same chokepoint, meaning the inflationary pressure from this event is broader than crude oil benchmarks alone suggest.
Why rerouting is not a simple fix
Saudi Arabia, the UAE, and Iraq all have some pipeline capacity that can bypass Hormuz. But those pipelines were built for partial redundancy, not full replacement. They cannot absorb the volume that normally transits by sea. Longer alternative shipping routes add weeks of voyage time and significant cost. Several Gulf producers also face their own exposure to the same regional conflict, meaning their infrastructure is not fully insulated from the hostilities.
How equity and volatility markets are absorbing the shock
Asian equity markets opened with visible caution as Brent settled above $90. The reaction was measured, not panicked, but the direction was clear: investors are recalibrating for a scenario where the oil shock persists beyond a single news cycle.
The cross-asset market impact of the conflict has not behaved according to conventional safe-haven logic: the U.S. dollar gained ground as America’s net energy-exporter advantage combined with safe-haven capital flows, while gold fell despite ongoing military hostilities because dollar strength and rate expectations simultaneously overrode traditional demand for the metal.
- Energy sector margins: Upstream producers outside the conflict zone benefit from higher benchmark prices. Midstream and shipping names with Gulf route or Hormuz exposure face elevated operational risk, insurance overhang, and sanctions uncertainty.
- Inflation expectations: Brent at or above $90 feeds directly into projected fuel costs, complicating any central bank’s ability to declare inflation controlled.
- Rate-cut timeline pressure: If oil stays elevated, expected rate-cut cycles in major economies face delay or moderation.
Inflation and rate-cut timing at stake
This is where the oil shock stops being an energy-sector story and becomes a whole-portfolio consideration. Sustained crude above $90 feeds into headline Consumer Price Index (CPI) projections, the broadest measure of price changes across an economy. Central banks have historically responded to energy-driven inflation with policy caution even when underlying core inflation (which strips out volatile food and energy prices) remains contained. If you hold a diversified equity portfolio, the discount rate applied to every asset class shifts if Hormuz remains impaired for weeks rather than days.
Five variables that will determine where oil prices go from here
Not all variables carry equal weight. The ranking below reflects immediacy and price impact.
- Military posture in the immediate near term. Continuation or expansion of U.S. strikes and Iranian retaliation keeps the supply-shock premium elevated. Any credible signal of de-escalation could cap the rally. This is the primary catalyst.
- Shipping normalisation or further incidents. The direction of vessel traffic through Hormuz is the most immediately observable price signal. Another high-profile attack or seizure would likely trigger another leg up in crude benchmarks.
- Strategic petroleum reserve (SPR) releases. Coordinated draws from U.S. and International Energy Agency (IEA) reserves are one of the few immediate levers consuming nations hold. An SPR is a government-controlled stockpile of crude oil held specifically for supply emergencies.
- Gulf producer responses. Saudi Arabia, the UAE, Kuwait, and Iraq can partially offset disruptions, but face pipeline capacity limits and their own conflict exposure.
- Broader financial market reaction. Sustained equity weakness in energy-importing regions would reinforce the inflationary signal and add pressure to rate-cut timelines.
SPR releases have repeatedly failed to halt inventory drawdowns during this conflict cycle; emergency draws totalling approximately 280 million barrels through May 2026 could not offset an 8.5 million barrel per day global inventory depletion rate, and OPEC spare capacity of roughly 0.5 million barrels per day is negligible at the scale of a Hormuz closure.
The military posture in the immediate near term is the primary catalyst variable. No amount of SPR release or Gulf producer adjustment substitutes for a resolution at Hormuz itself.
If you are filtering the volume of incoming headlines over the coming days, track the conflict’s military trajectory above all else. That single variable carries more price-moving weight than any supply-side offset.
What a sustained Hormuz closure would mean for the global energy order
Two historical precedents frame the scale of what a prolonged disruption could resemble.
| Event | Year | Trigger | Peak price impact | Duration of disruption |
|---|---|---|---|---|
| OPEC oil embargo | 1973 | Arab-Israeli War; export ban on Western nations | Oil prices quadrupled | ~6 months |
| Gulf War disruption | 1990 | Iraqi invasion of Kuwait; production shut-in | Oil doubled in weeks | ~7 months |
| Hormuz disruption (current) | July 2026 | U.S.–Iran military conflict; shipping collapse | Brent above $90; WTI earlier peaked near $100 (estimate) | Ongoing |
The current situation has moved from a risk-premium environment into a supply-shock environment, but the duration of the shock remains the critical unknown. If WTI returns to near or above $100, the inflationary and growth consequences for energy-importing economies, particularly in Europe and Asia, would be materially different from a brief spike.
- Energy-importing economies face higher input costs across manufacturing, transport, and consumer goods
- Central bank policy responses historically tilt cautious during energy-driven inflation, even when core prices are contained
- Trade route and infrastructure adjustments take months to years; shipping patterns, insurance markets, and operator confidence do not snap back overnight
Prolonged chokepoint disruptions have a track record of reshaping energy policy, trade routes, and inflation trajectories for years after the immediate conflict resolves. A ceasefire announcement alone would not automatically restore normal supply conditions. Physical shipping infrastructure, insurance pricing, and operator risk appetite lag the political event.
For investors wanting to understand the full duration risk, our full explainer on the 2027 supply normalisation timeline covers Saudi Aramco’s warning that recovery may not arrive until 2027, the scale of the IEA emergency release relative to the weekly supply deficit, and what a prolonged closure means for Fed rate-cut projections.
Watching the strait: what the next 72 hours will tell markets
The move above $90 Brent reflects a market that has already priced a supply shock. The next directional move depends on whether Hormuz conditions deteriorate, stabilise, or begin to normalise.
Four observable signals are worth tracking above the noise:
- Vessel traffic data through the Strait of Hormuz: this is the leading indicator for price relief, not political announcements
- U.S. and Iranian military statements indicating escalation, pause, or back-channel engagement
- Diplomatic engagement indicators, including any third-party mediation signals from Gulf states or international bodies
- SPR release announcements from the U.S. or coordinated IEA action
The distinction that matters most: a ceasefire headline alone will not reverse the price move. Insurance markets and operator confidence are lagging indicators that persist well after a political resolution. Traders will not reduce the supply-shock premium until tanker traffic demonstrably recovers. Watch the ships, not just the statements.
This article is for informational purposes only and should not be considered financial advice. Investors should conduct their own research and consult with financial professionals before making investment decisions. Past performance does not guarantee future results. Financial projections are subject to market conditions and various risk factors.