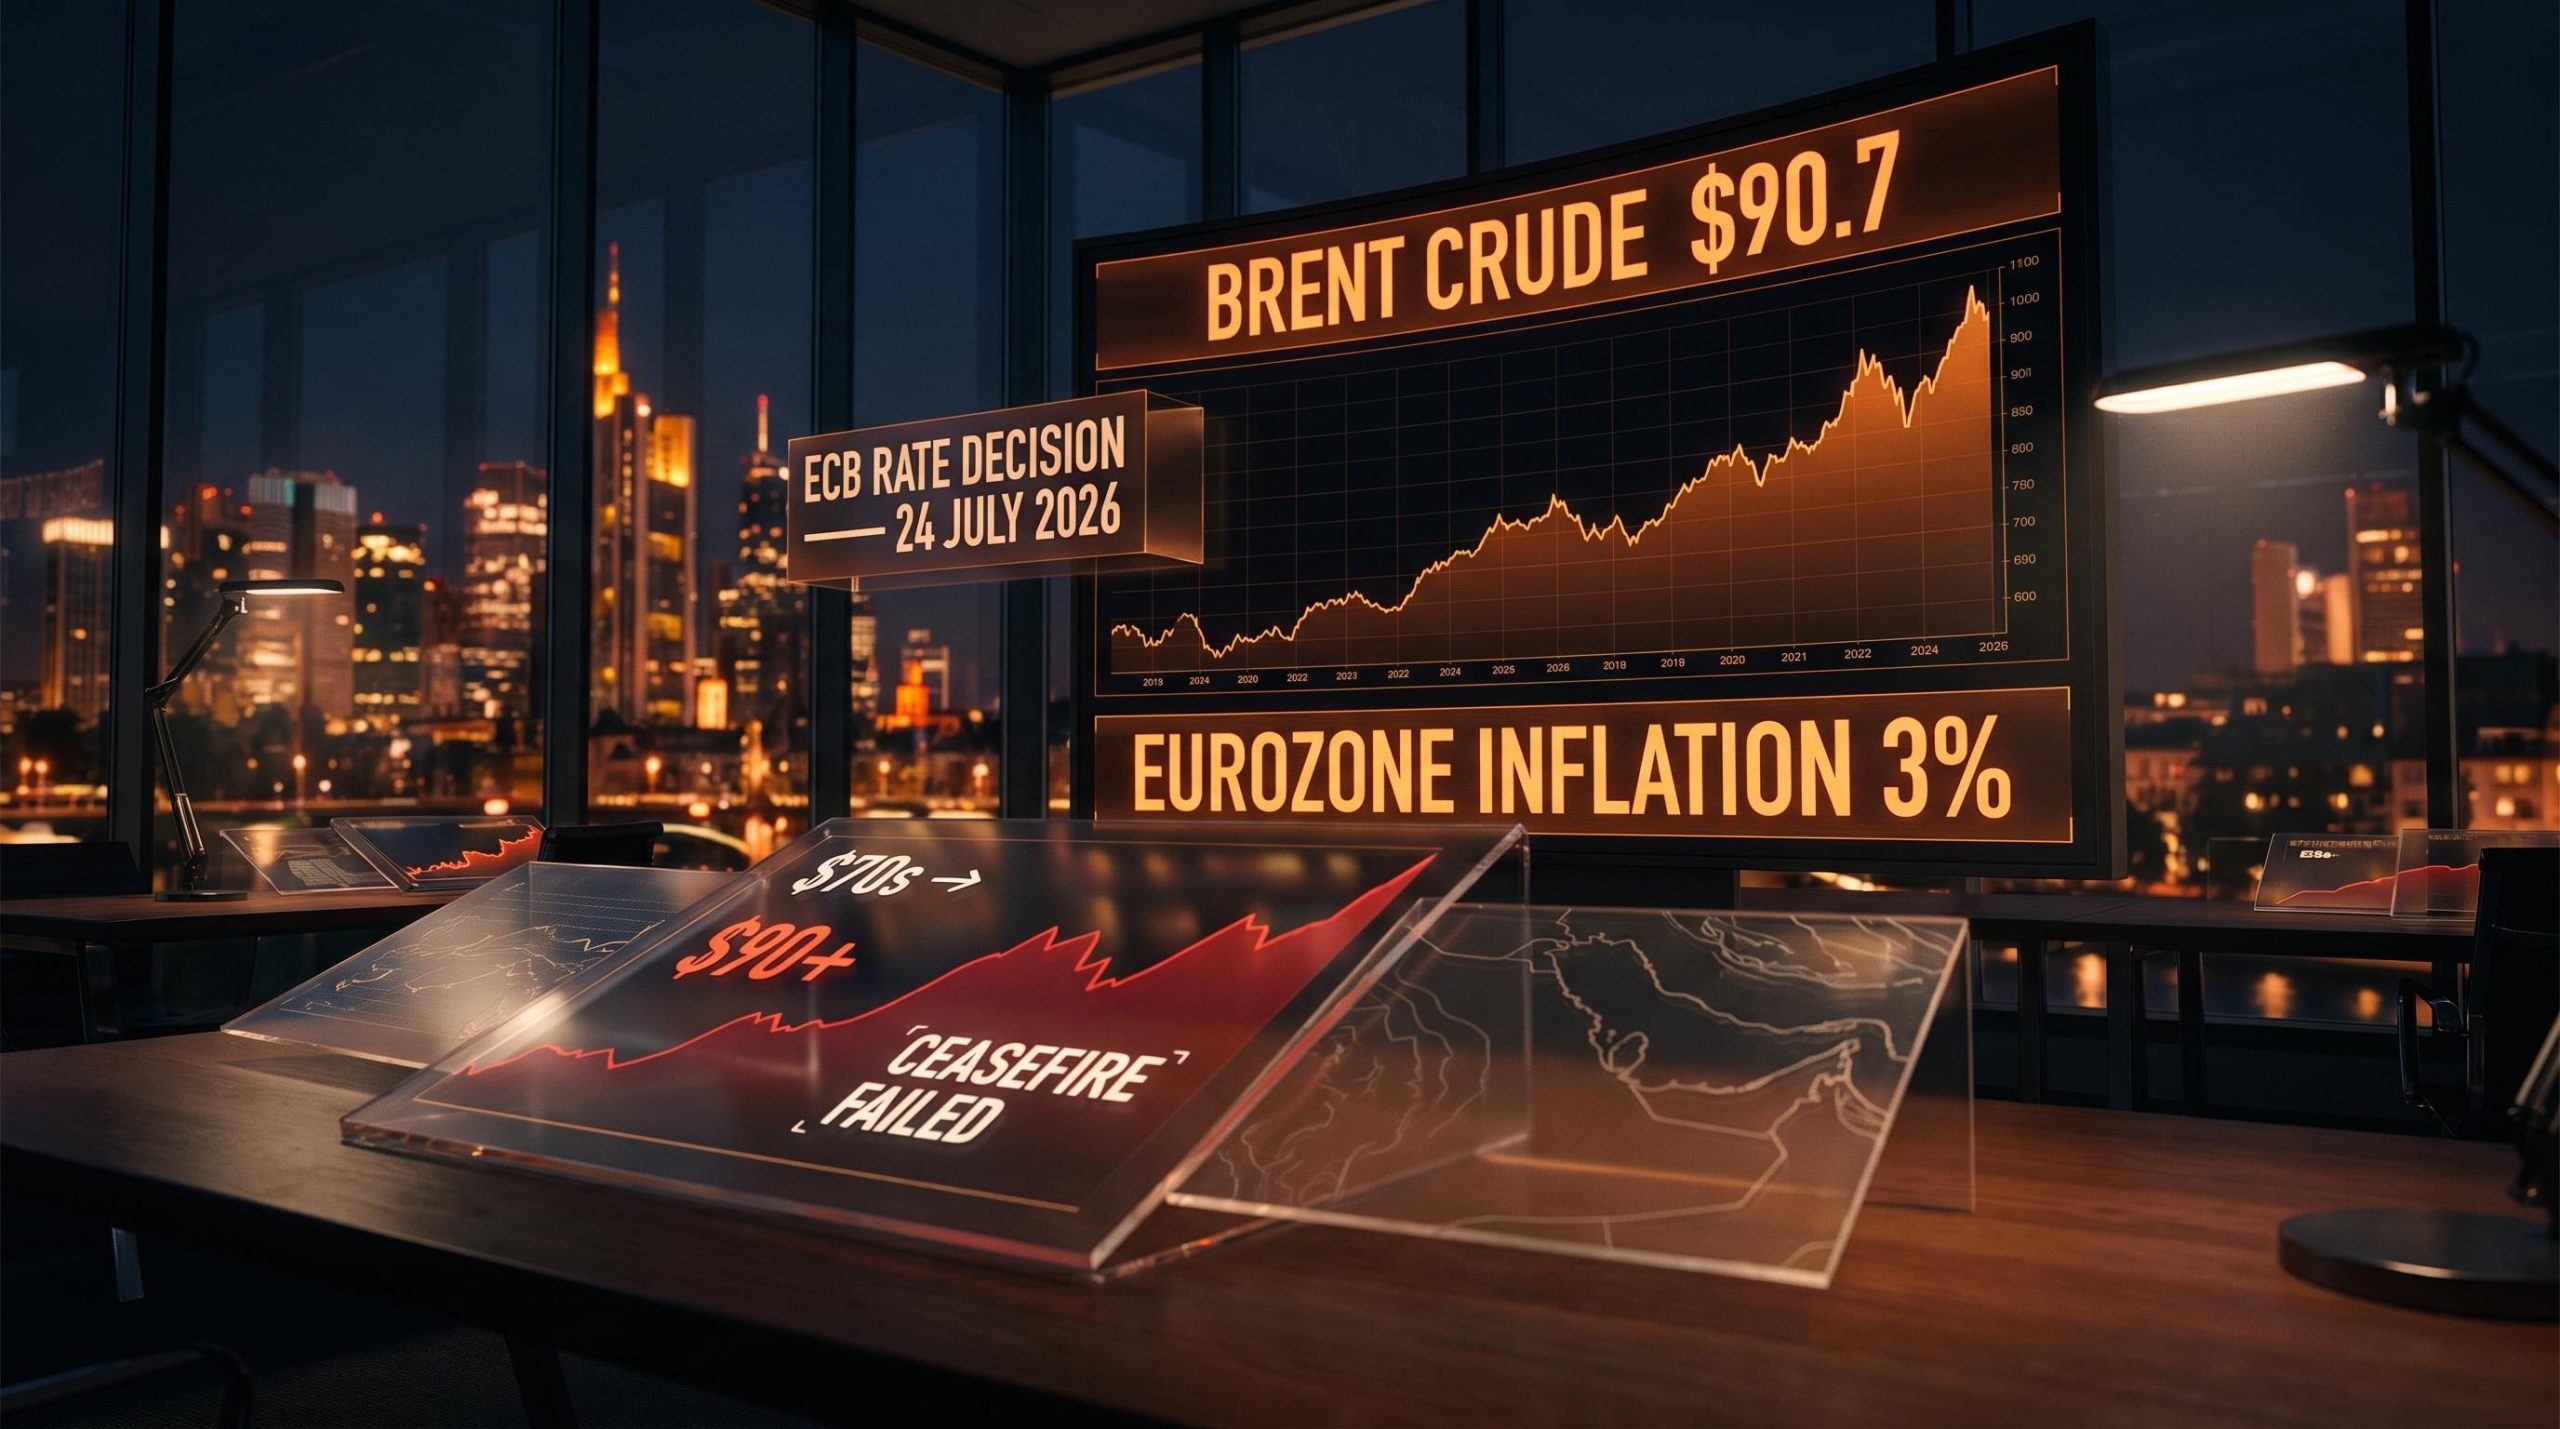
A military confrontation 5,000 kilometres from Frankfurt is now the most consequential variable sitting in front of the European Central Bank’s (ECB) rate-setting table on Friday, 24 July 2026. That is not hyperbole. It is the transmission chain that connects a failed ceasefire in the Persian Gulf to the borrowing costs European companies and households will pay for the rest of the year.
Brent crude climbed back above $90 per barrel this week, erasing the relief rally that followed a June ceasefire and briefly sent prices toward the mid-$70s. Eurozone inflation has risen to roughly 3%, sitting a full percentage point clear of the ECB’s 2% target, and the central bank’s language on Thursday may matter as much as the rate number itself.
Here is the full chain mapped out: from the Strait of Hormuz to European borrowing costs, with specific signals to monitor before Thursday’s decision. After reading, you will be able to judge whether the ECB’s rate call and the Brent price level are telling the same story or diverging, and what that means for any portfolio touching European assets, energy names, or rate-sensitive sectors.
The ceasefire that wasn’t: how the conflict resumed and what it broke
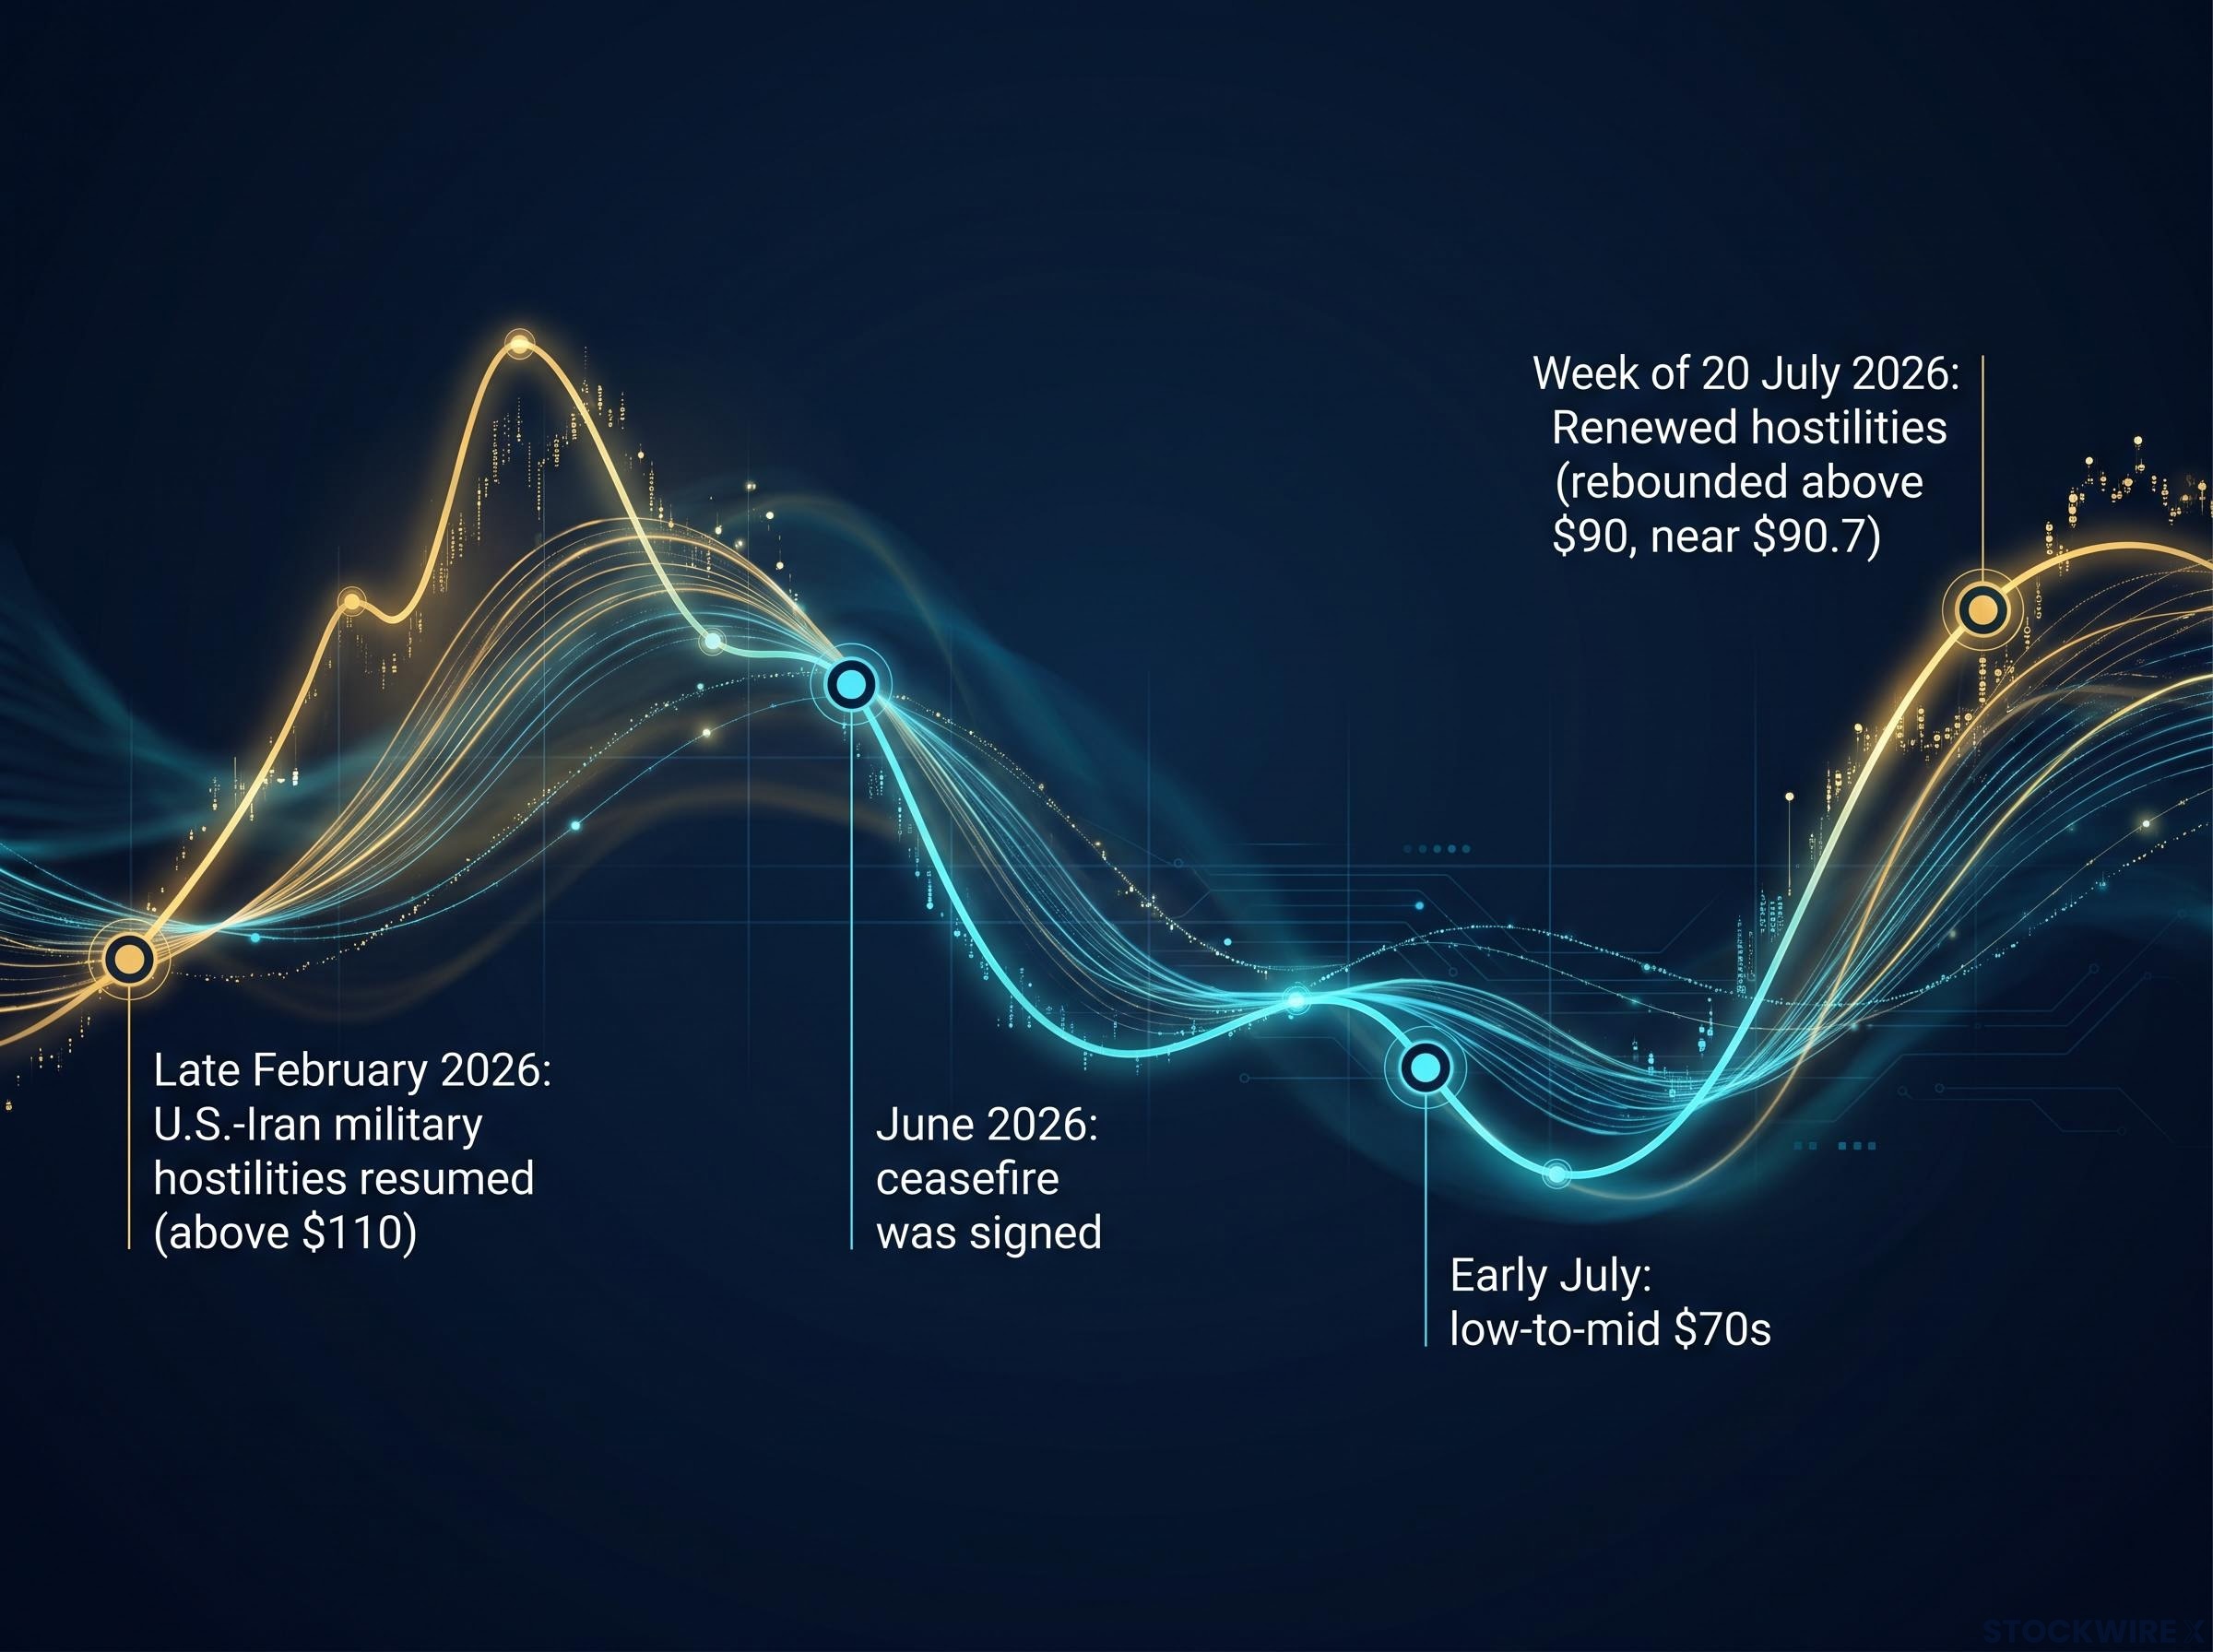
The conflict timeline has moved through three distinct phases, each with a clear price signal:
- Late February 2026: U.S.–Iran military hostilities resumed, driving Brent crude sharply higher from pre-conflict levels toward and above $110 per barrel at the peak of escalation.
- June 2026: A formal ceasefire was signed. Brent retreated from its peak, and by early July prices had fallen to approximately the low-to-mid $70s (note: approximate, based on available data).
- Week of 20 July 2026: Renewed hostilities have undermined the ceasefire arrangement. Brent has rebounded above $90 per barrel, with some live prints near $90.7.
That rebound is the detail that matters most. The ceasefire was supposed to be the off-ramp. It lasted weeks, not months.
Why a failed ceasefire changes the price floor
Once a ceasefire is established and then broken, the market’s base-case assumption shifts. Before June, traders were pricing a temporary disruption: conflict spikes oil, ceasefire ends the spike, prices normalise. That framework collapsed when hostilities resumed.
The current $90 level may now function less as a spike premium and more as a new floor. Markets price the expectation of disruption, not just confirmed events. A ceasefire that has already failed once tells the market that the de-escalation scenario is materially less reliable, and that the risk premium baked into Brent is unlikely to dissipate without a sustained, verifiable resolution. For your portfolio positioning, that distinction between a spike and a floor changes everything about how long to hold energy exposure and how aggressively to hedge rate-sensitive positions.
The Hormuz risk premium is expected to decompress slowly rather than snap back, with the IEA projecting a two-year supply chain recovery timeline even under a best-case resolution, a structural reality that challenges any portfolio assumption built around a quick return to pre-conflict oil price levels.
When big ASX news breaks, our subscribers know first
The Strait of Hormuz as the world’s most consequential shipping lane
The Strait of Hormuz is the narrow waterway between Iran and the Arabian Peninsula through which an estimated 20% of global oil trade passes (note: this widely cited figure has not been independently verified for this article). That single corridor makes it the most concentrated point of failure in the global energy supply chain.
The EIA chokepoint transit data places the Strait of Hormuz volume at roughly one-fifth of all seaborne oil trade, a concentration that leaves no viable substitute route capable of absorbing a sustained disruption at scale.
What makes the Strait dangerous for investors is not the scenario of full closure. It is the cost structure that shifts the moment credible risk appears. Even without a single tanker being turned away, three mechanisms transmit Hormuz uncertainty into the oil price.
- Tanker day rates: When Gulf routes become riskier, tanker operators charge more. Those costs flow through to refiners and importers.
- Insurance premia for Gulf voyages: Underwriters reprice war-risk coverage for vessels transiting the Strait. Higher insurance costs are absorbed and passed forward.
- Vessel diversion reports: When operators begin rerouting around the Cape of Good Hope rather than transiting the Strait, it signals that physical market participants, not just speculators, are pricing sustained disruption.
Tanker crossing data from early July 2026 showed verified Hormuz transits falling from a baseline of 80-100 per day to as low as five on some days, with dozens of vessels going dark on AIS tracking systems, a physical-market signal that often moves ahead of the crude futures price in confirming the severity of operational disruption.
Analyst estimates suggest a serious Strait of Hormuz disruption could add a $20-$40 per barrel risk premium to Brent crude. (Note: this estimate is sourced from analyst projections and has not been independently verified.)
For you, the Strait is not a geography point to file away. It is the physical location where a geopolitical risk premium either becomes a sustained cost or evaporates. The tanker day rate and insurance data give you an early read before the oil price headline confirms what has already been priced.
Why Europe absorbs this shock more directly than other major economies
The eurozone’s vulnerability to a Persian Gulf oil shock is structural, not coincidental. The euro area is a net energy importer. It cannot offset price spikes with domestic production the way the United States can with its shale output. When Brent rises, European consumers and businesses absorb the cost through motor fuel, heating bills, logistics, and energy-intensive manufacturing, in that sequence, and quickly.
That transmission is already visible. Eurozone inflation is running at approximately 3% across the 20-member currency bloc, a full percentage point above the ECB’s 2% target. Higher energy costs are a direct contributor.
The wage-price spiral: why oil prices alone don’t tell the full story
The ECB’s deeper concern is not the first-round energy price effect. It is what happens next. A wage-price spiral is a feedback loop where inflation becomes self-sustaining even after the original trigger fades. It works in three steps:
- Energy-driven inflation erodes real wages. Workers’ purchasing power falls as fuel, heating, and food costs rise.
- Workers demand higher pay in upcoming bargaining rounds. In a tight labour market, they have leverage to secure it.
- Firms pass higher wage costs forward into prices. Inflation persists independent of whether oil stabilises or retreats.
ECB officials have explicitly flagged this concern. European labour markets have been tighter than normal since the post-pandemic recovery, which means the conditions for a wage-price dynamic are present, not theoretical. The 3% inflation figure is the visible symptom. The wage-price spiral risk is the disease the ECB is actually trying to prevent, and it is why the central bank cannot simply wait for oil to fall and declare the job done.
What the ECB is actually deciding on 24 July
Back in June 2026, the ECB moved to tighten policy with a 25 basis point rate rise, pointing to the inflationary consequences of the energy shock stemming from the Iran conflict. Friday’s meeting is broadly expected to be a hold. The question that matters is not the rate number. It is the language.
Analysts at ING have flagged the possibility that the ECB could implement a second rate increase ahead of September if elevated energy costs provide justification. That is not a tail scenario; it is a non-trivial risk sitting in front of a central bank watching Brent climb back above $90 in the same week it meets.
The distinction between the three plausible outcomes is what tells you how to position:
| ECB scenario | Euro sovereign yields | Rate-sensitive equities | EUR/USD |
|---|---|---|---|
| Hold + dovish language | Lower; bond prices rise | Some relief rally | Modest weakening |
| Hold + hawkish language | Higher; duration pressure | Valuation compression | Modest strengthening |
| Surprise rate hike | Significantly higher | Sharp repricing lower | Notable strengthening |
A hold with hawkish language can tighten financial conditions almost as effectively as an outright hike. If you hold European fixed income or rate-sensitive equity exposure, the forward guidance language deserves as much attention as the rate decision itself.
The ECB forward guidance signals embedded in Thursday’s statement carry outsized weight because approximately 43 basis points of total tightening is priced for 2026, sitting between one and two additional hikes, and that figure will either be confirmed or begin to unwind depending on how Lagarde frames the energy inflation picture.
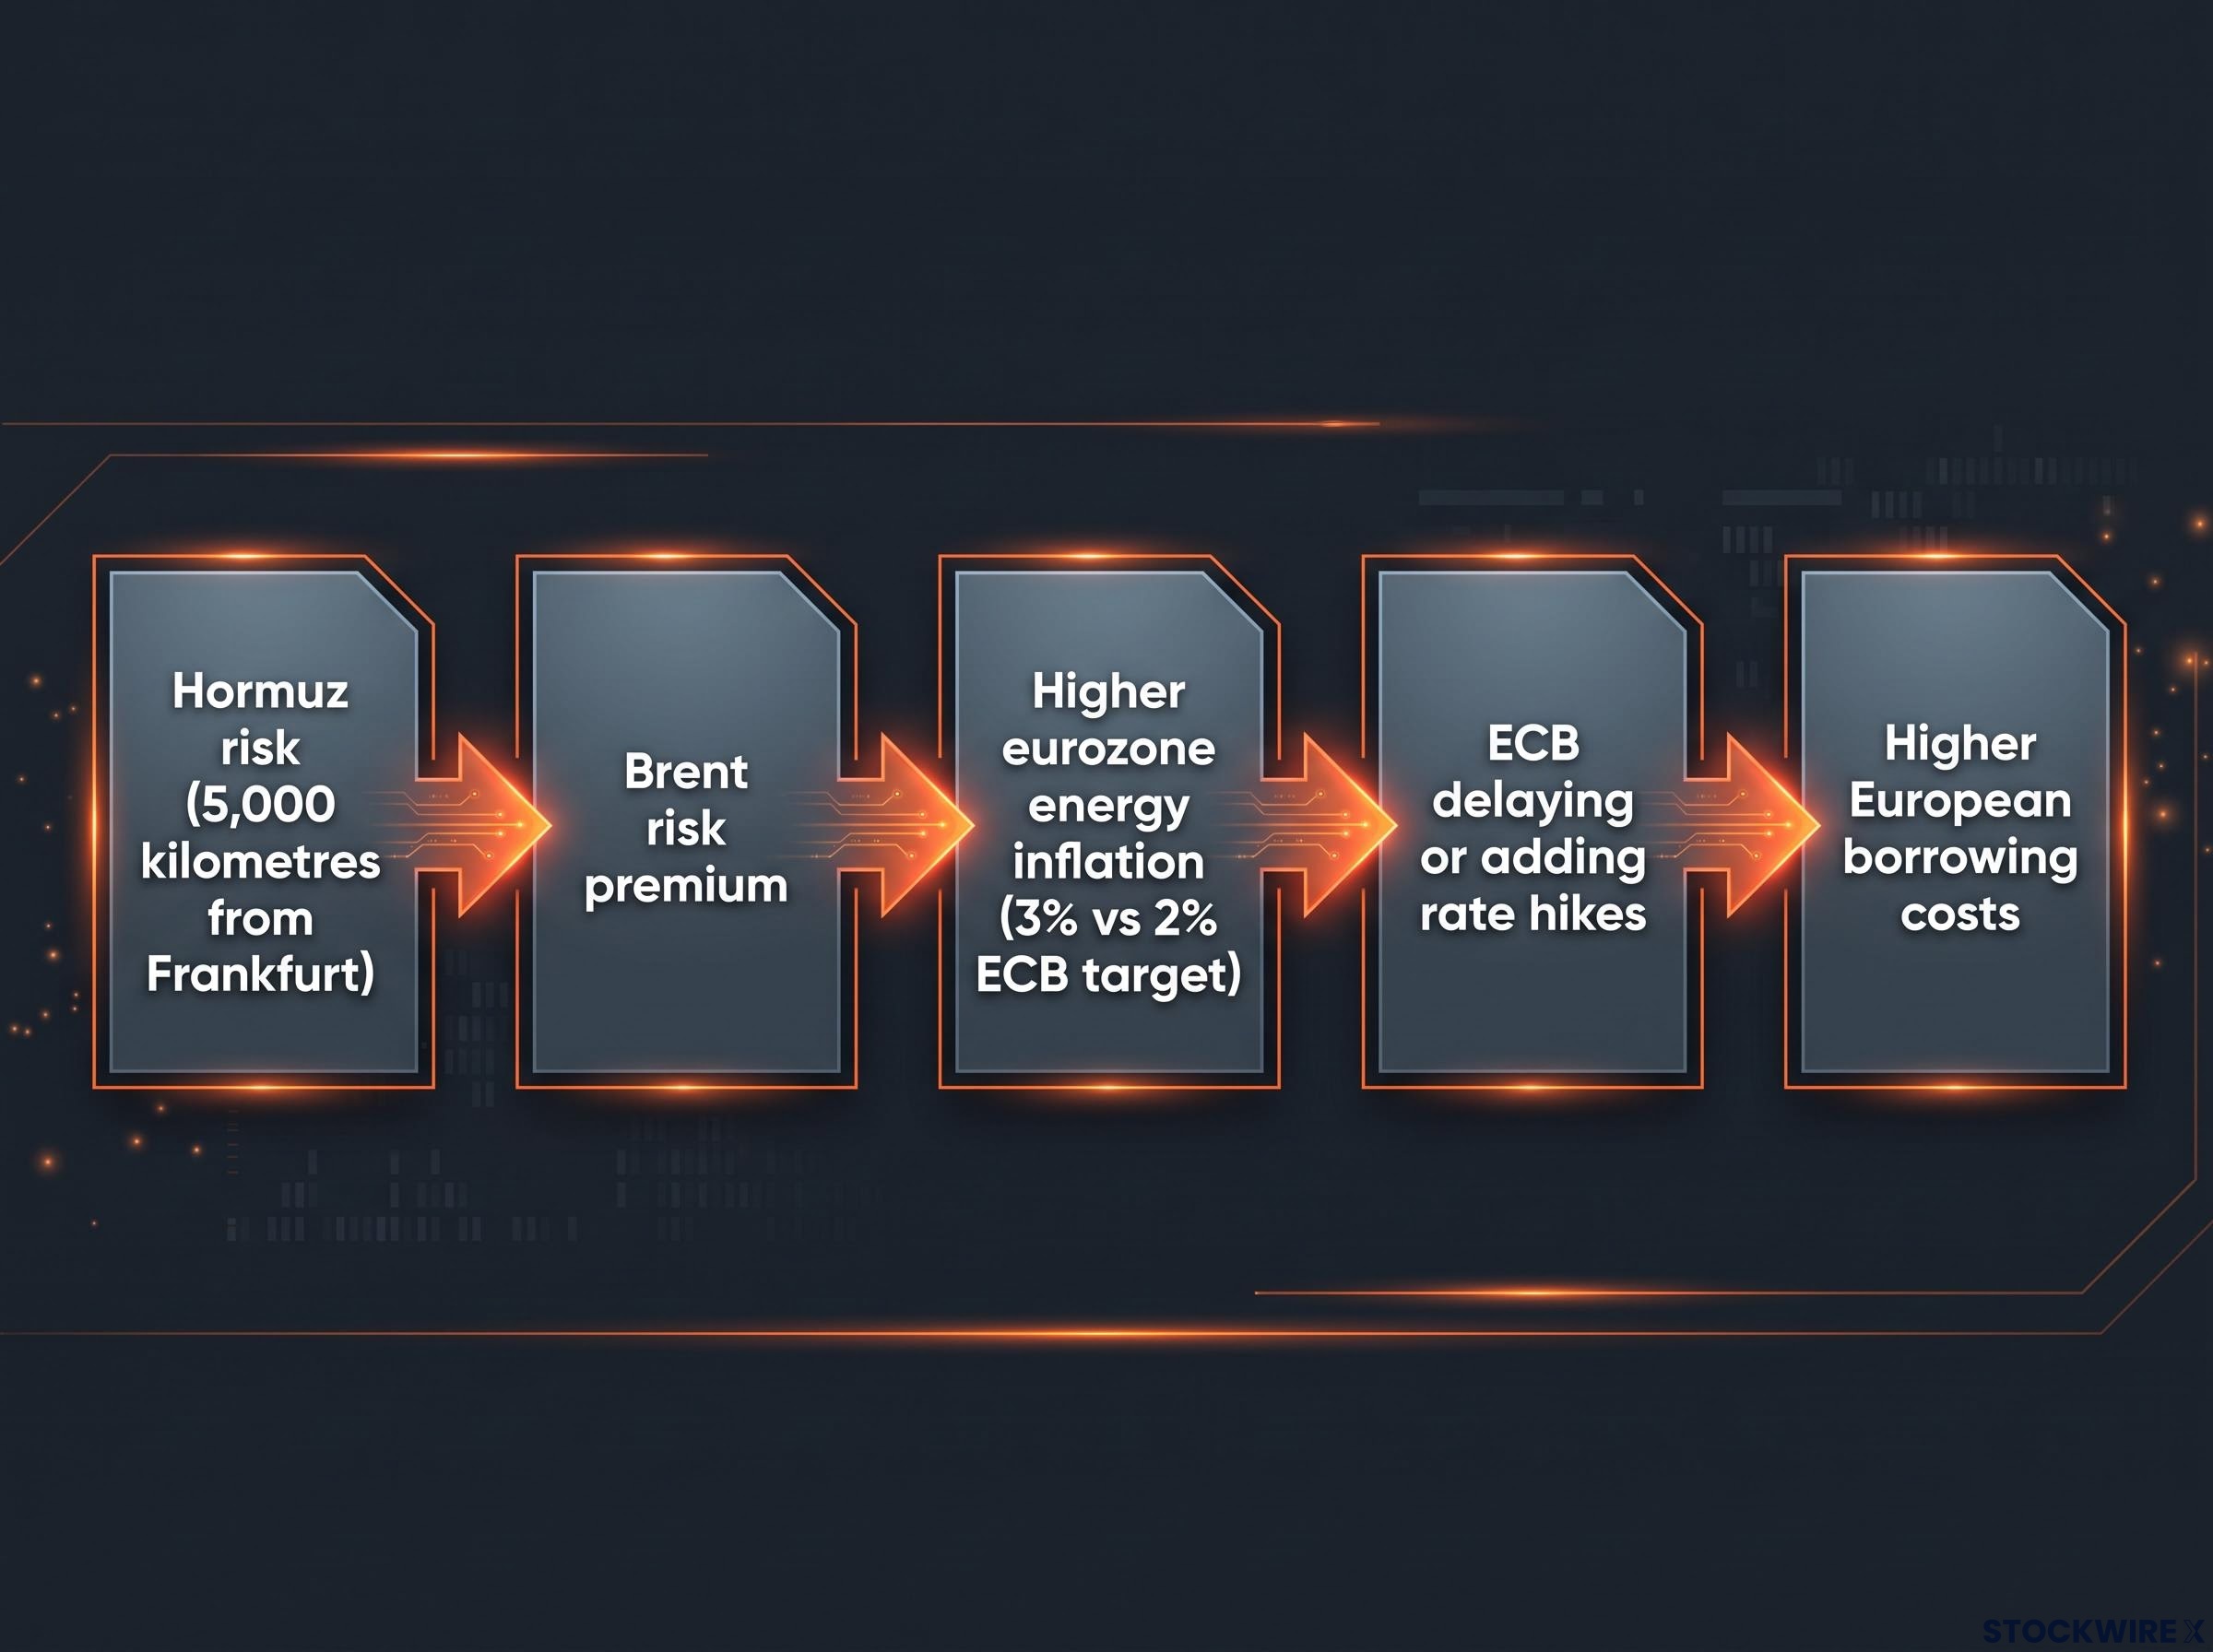
The transmission chain in one line: Hormuz risk → Brent risk premium → higher eurozone energy inflation → ECB delaying or adding rate hikes → higher European borrowing costs.
Reading the signals before Thursday: what to watch in the next 72 hours
Between now and the 24 July decision, four signal categories feed directly into the probability distribution of ECB outcomes. Monitoring all four simultaneously positions you to adjust exposure before the market fully prices the shift.
- Brent price relative to the $90 and $95 thresholds. Sustained trading above $90 keeps the hawkish case alive. A move toward $95 or higher materially strengthens the case for tighter language or a surprise hike. A retreat toward the $70s-$80s on de-escalation signals would ease pressure considerably.
- Tanker day rates and Gulf insurance premia. These are physical-market leading indicators. Rising rates and premia mean operators and underwriters, not just speculators, are pricing sustained disruption. They often move before the oil price fully reflects operational risk.
- ECB Governing Council language ahead of the meeting. Pre-meeting remarks from council members are scrutinised for specific phrases. References to “upside risks to inflation” and “geopolitical uncertainty” signal that higher-for-longer rate positioning is the base case, not imminent easing.
- Eurozone flash inflation estimates and wage settlement data. Above-consensus prints in Germany, France, or Spain increase hawkish pressure. Wage settlement data is the key second-round risk indicator: evidence of larger pay increases confirms the wage-price spiral risk is materialising, not merely theoretical.
ECB communication signals to watch before Thursday
The specific language matters more than tone. Governing Council members who emphasise “upside risks to inflation” or reference “geopolitical uncertainty” as a factor in their assessment are signalling that markets should price higher-for-longer rates. If multiple members use this language ahead of Thursday, it narrows the probability of dovish forward guidance significantly. Markets will parse every pre-meeting remark for any hint that a surprise hike was discussed, even if the base case remains a hold.
What Thursday’s decision changes, and what the conflict does not
Thursday will produce a single data point: a rate decision and a statement. Whatever the outcome, it will not resolve the structural shift that the U.S.–Iran conflict has established.
The portfolio implications of that shift cut across asset classes:
- Rates and duration: Elevated oil and inflation risk argues for caution on long-duration euro sovereigns and investment-grade credit. A hold with hawkish guidance can reprice duration almost as effectively as an outright hike.
- Equities by sector: Energy and commodity-linked names benefit from higher crude prices and geopolitical risk premia. Rate-sensitive sectors, including real estate and growth-oriented technology, face valuation pressure if yields move higher. Strong U.S. corporate earnings, with Wall Street banks posting results driven by dealmaking fees and elevated trading revenues, provide a partial stabilising factor for global sentiment, but do not offset European-specific rate risk.
- EUR/USD two-way risk: The euro faces competing forces. Higher relative interest rates offer support, but weaker growth and terms-of-trade deterioration from persistent energy-import stress create drag. That two-way dynamic makes directional currency positioning particularly challenging.
The structural observation that outlasts Thursday: For European portfolios in 2026, getting the Strait of Hormuz call wrong is increasingly the same as getting the ECB path wrong. The two are operationally linked through the oil-inflation-monetary policy transmission chain.
That linkage is what has changed. Before this conflict cycle, Persian Gulf geopolitics sat in the “macro risk” category for European investors, something to note but rarely something that directly altered rate expectations. In 2026, it sits at the centre of the ECB’s reaction function. Investors who treat the Hormuz outlook and the ECB path as separate analytical tracks will systematically misprice the risk connecting them.
The persistent inflation regime that has taken hold across major economies in 2026 may be less a cyclical episode and more a structural shift: analysis of 150 years of inflation data shows these regimes tend to run in generational patterns rather than mean-reverting quickly, which raises the stakes for any central bank signalling that higher-for-longer is the appropriate path.
This article is for informational purposes only and should not be considered financial advice. Investors should conduct their own research and consult with financial professionals before making investment decisions. Forward-looking statements regarding ECB policy, oil prices, and market outcomes are speculative and subject to change based on geopolitical developments and market conditions.