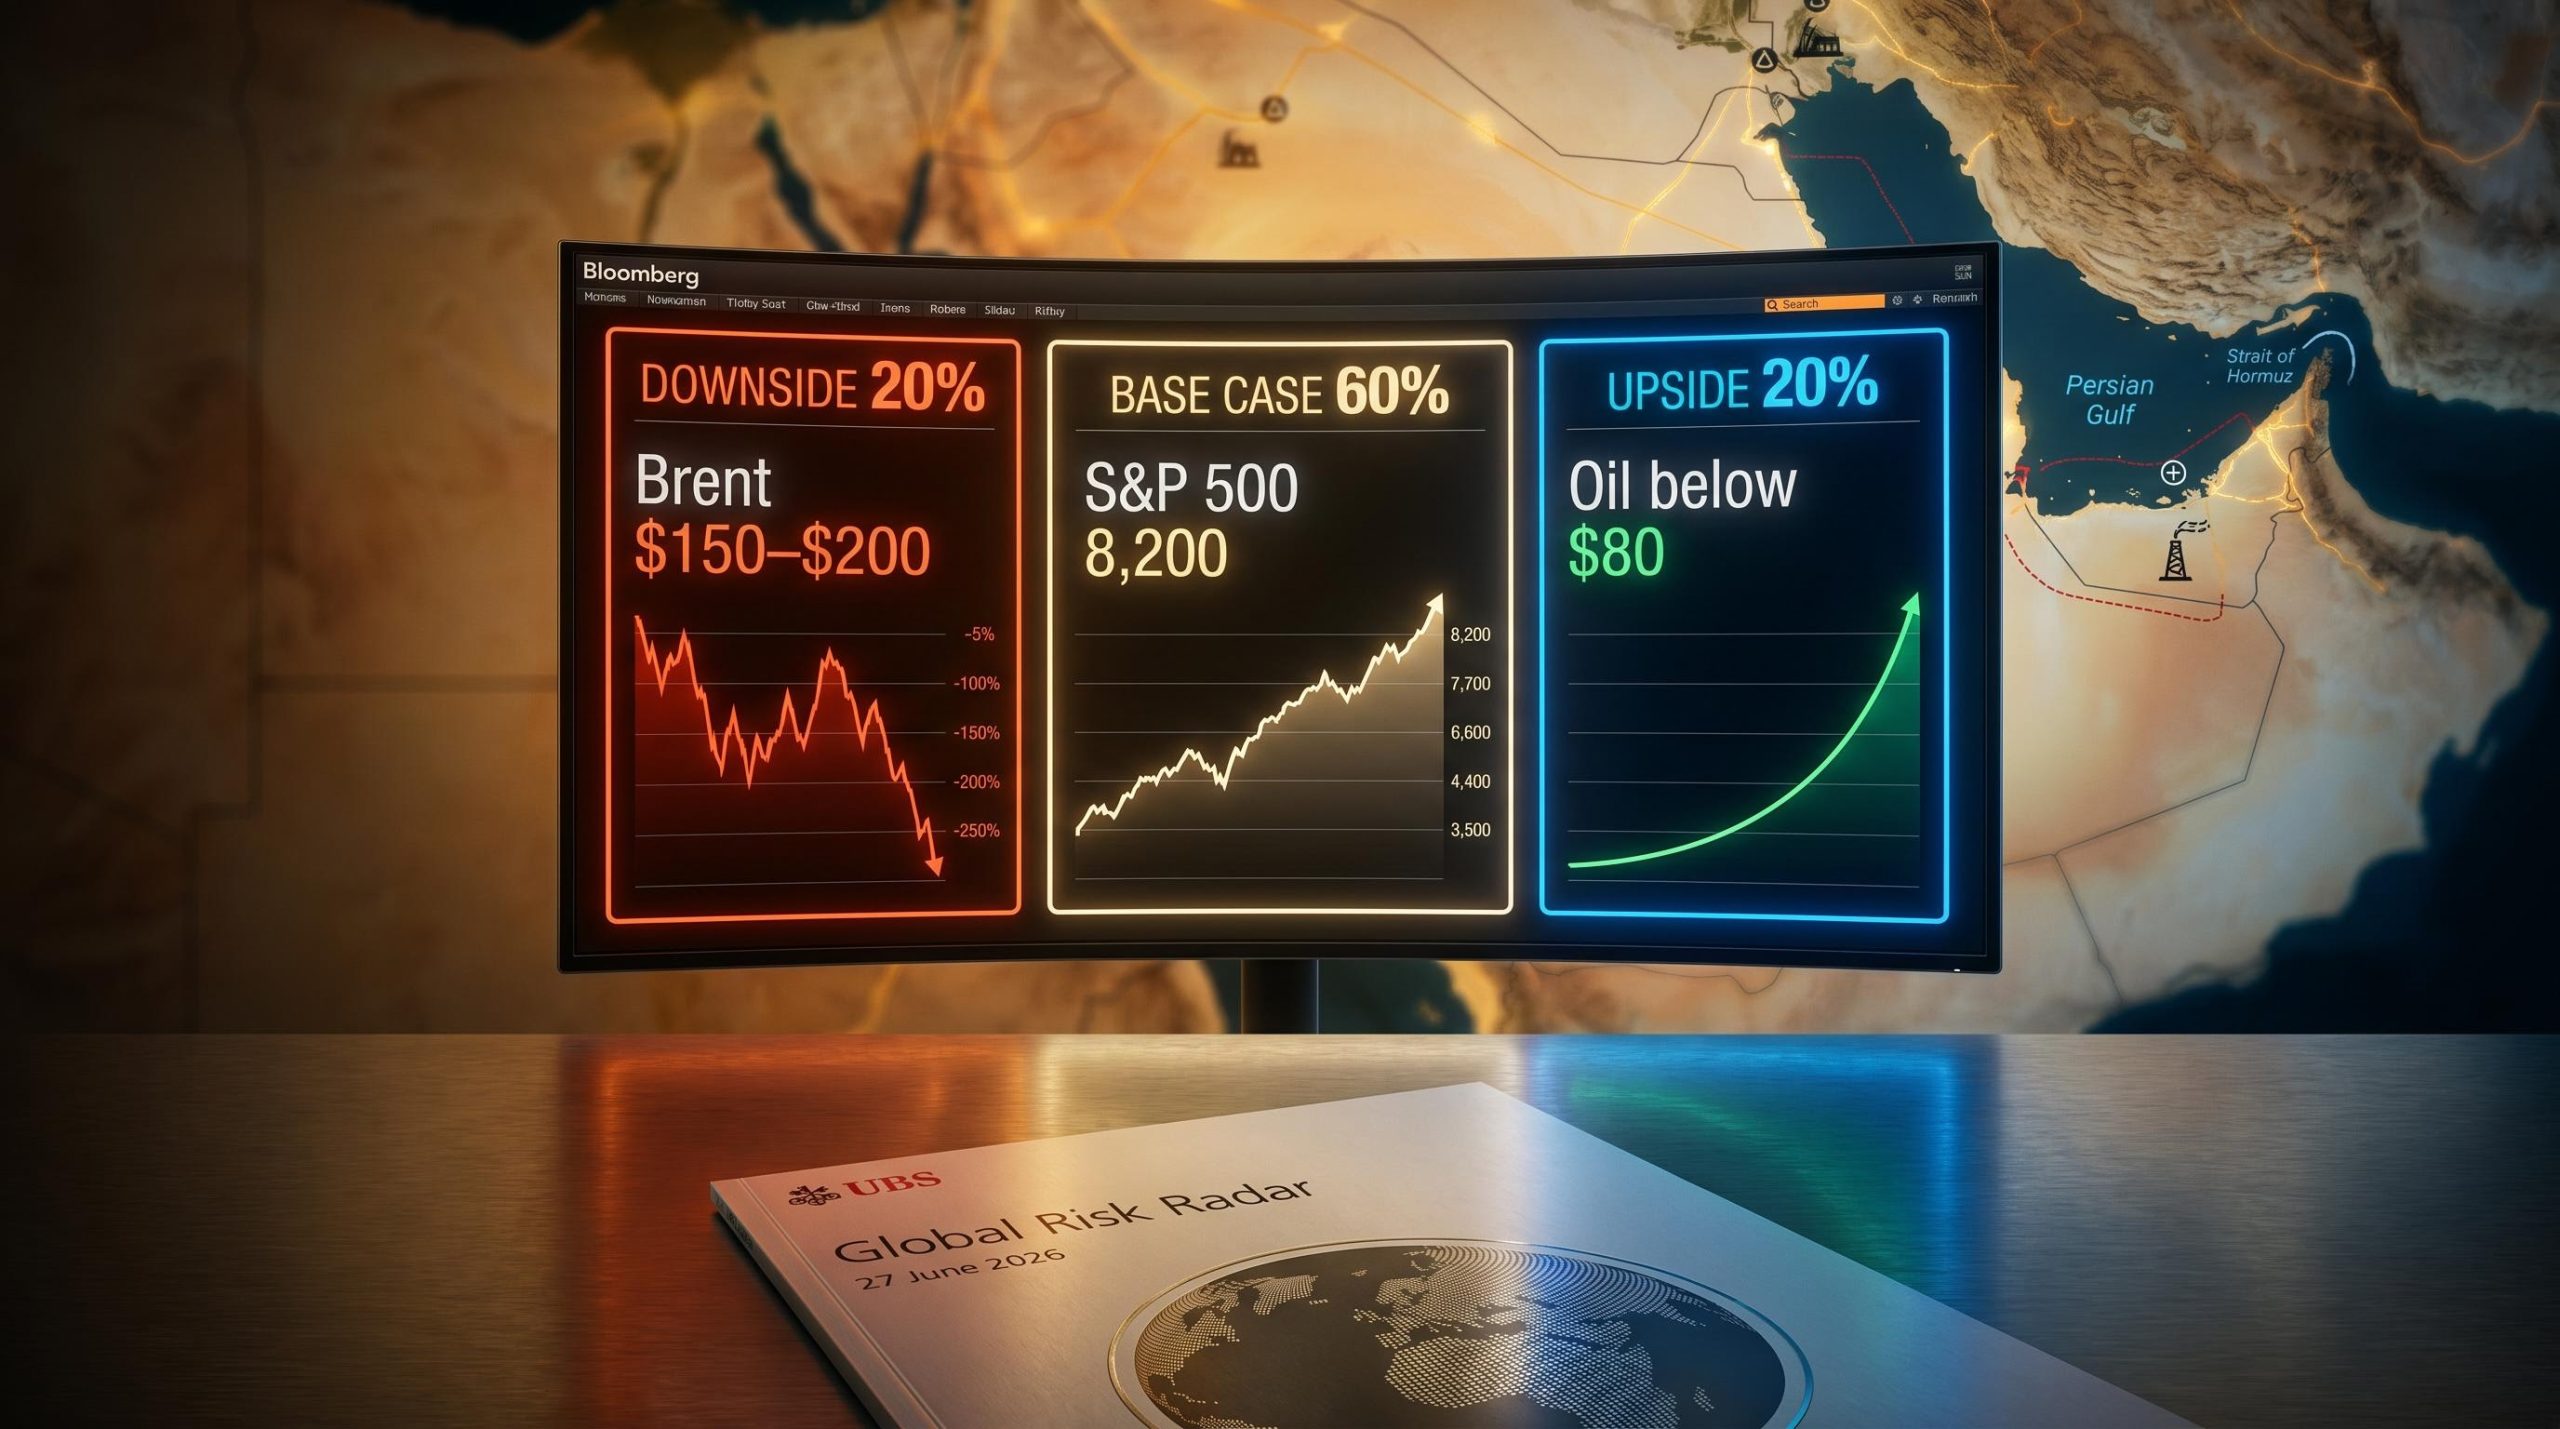
UBS Maps 3 Market Paths From $200 Oil to S&P 500 at 8,200
3 hrs ago

Paul Tudor Jones told CNBC on 6 May 2026 that the AI bull market resembles 1999, with roughly one to two years of runway left before a potential bust. That framing landed the same day Arm Holdings’ royalty miss sent semiconductor stocks into their sharpest single-session retreat in weeks, with the PHLX Semiconductor Index falling 2.86% to 492.36.
The pullback arrived after a multi-week rally built on historically narrow market breadth. A recovery from late March 2026 had been driven by a small cohort of AI semiconductor names, masking fragility underneath index-level strength. The convergence of mixed earnings, a prominent investor warning, and concentration data has reopened a debate investors had largely shelved: whether the AI trade is a durable structural cycle or a late-stage speculative run.
What follows is an examination of the specific evidence on both sides of that debate, including the anatomy of Arm’s Q4 FY26 earnings, the structural parallels and differences versus the dot-com era, and the conditions that would confirm or invalidate the AI stock bubble thesis, so readers can form a grounded view before making a capital allocation decision.
The headline numbers looked fine. Arm Holdings reported Q4 FY26 revenue of $1.49 billion, beating consensus by approximately 1% and delivering 20% year-on-year growth. Earnings per share of $0.60 cleared the $0.58 estimate.
Then the royalty line told a different story. Royalty revenue of $671 million fell short of the $693 million estimate, with CEO Rene Haas flagging negative smartphone unit growth and memory chip supply constraints as the primary drags. Royalty revenue reflects what is actually shipping to end markets right now, and smartphone weakness hit that figure directly.
| Metric | Actual | Estimate | Beat/Miss |
|---|---|---|---|
| Revenue | $1.49B | $1.48B | Beat (~1%) |
| Royalty Revenue | $671M | $693M | Miss |
| EPS | $0.60 | $0.58 | Beat |
| Q1 FY27 Guidance | $1.26B ±$50M | N/A | Sequential step-down |
Q1 FY27 guidance of $1.26 billion (plus or minus $50 million) represents a sequential step-down. That signals supply-side caution, not demand destruction, a distinction that matters for how investors interpret the quarter. Arm shares fell approximately 10% in the session following earnings.
Forward demand signal: Arm’s AI CPU order volume doubled to $2 billion over a five-week period, the most forward-looking bullish data point in the print, and a reminder that licensing and order pipelines are telling a different story from near-term royalty weakness.
The divergence between current end-market royalties and forward-looking AI orders is exactly what makes this print difficult to read cleanly. Both signals are real. They point in opposite directions.
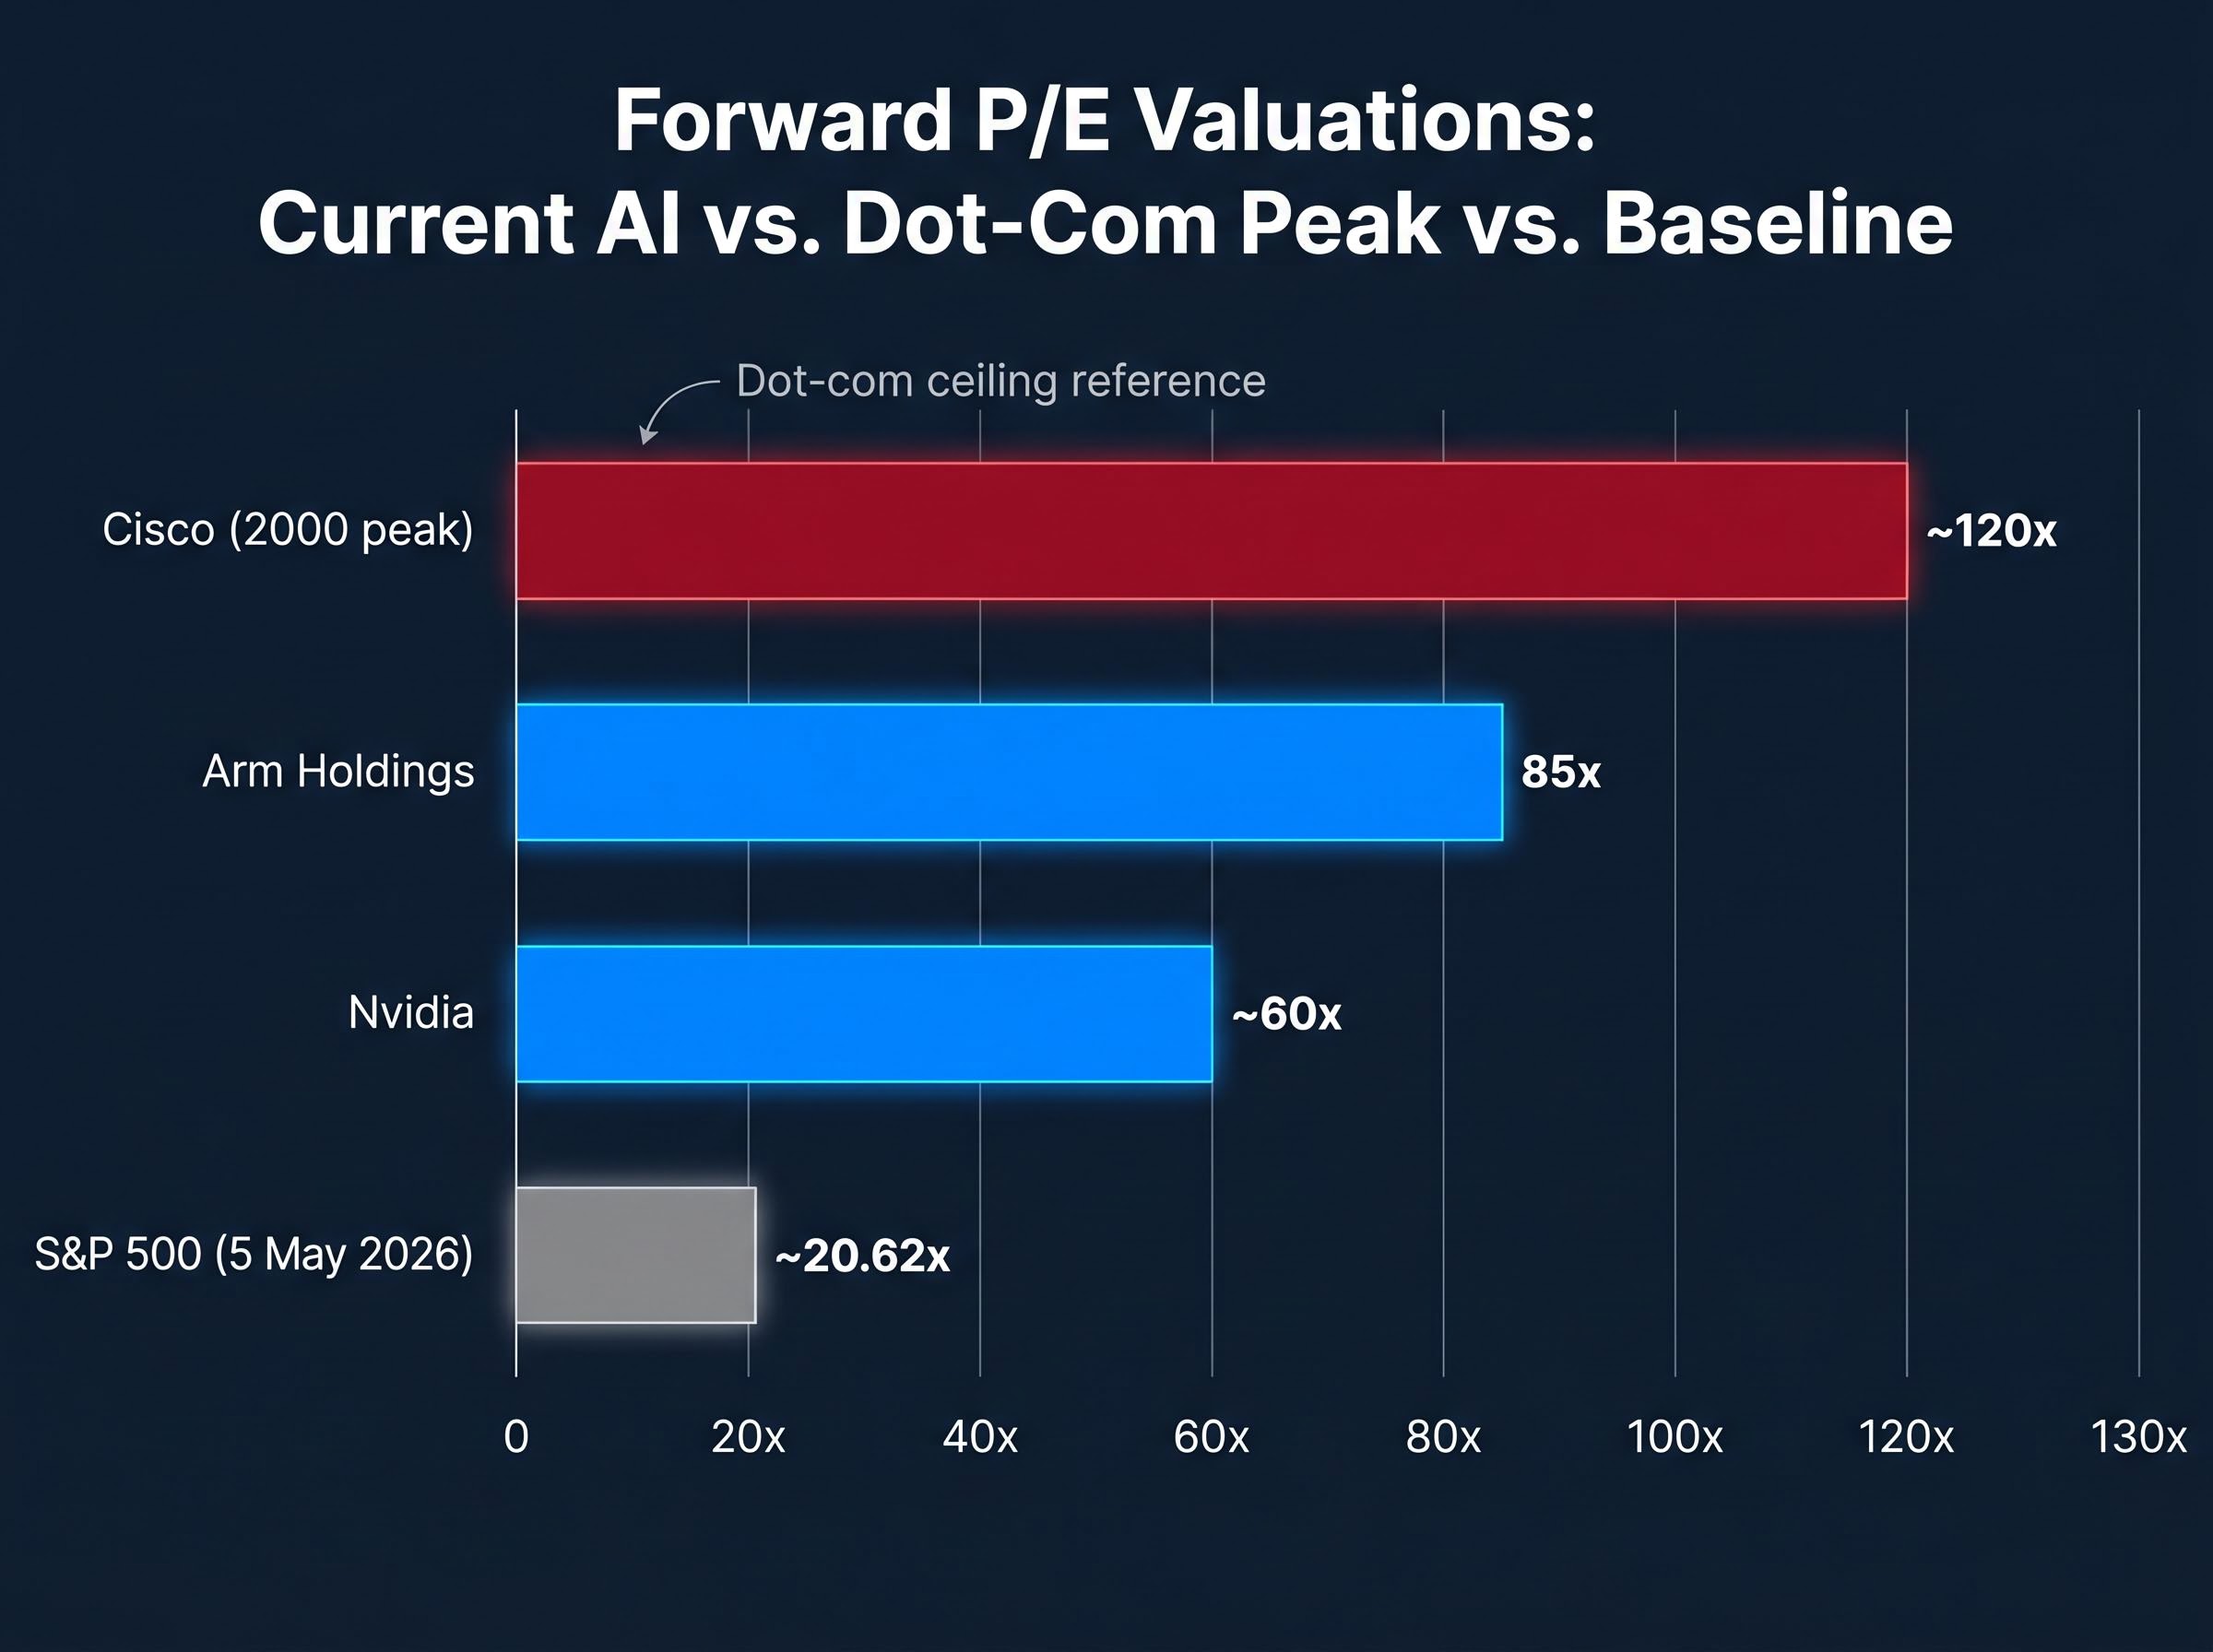
Arm Holdings trades at 85x forward price-to-earnings and 45x price-to-sales. Analysts have described this as the richest semiconductor valuation since 2000. Nvidia sits at approximately 60x forward P/E. The S&P 500, by comparison, trades at roughly 20.62x forward P/E as of 5 May 2026.
| Name | Forward P/E | Price-to-Sales |
|---|---|---|
| Arm Holdings | 85x | 45x |
| Nvidia | ~60x | 35x (EV/Revenue) |
| Cisco (2000 peak) | ~120x | N/A |
| S&P 500 | ~20.62x | N/A |
Cisco’s dot-com peak at approximately 120x provides a ceiling reference. Current multiples for Arm sit comfortably within the range of peak-era semiconductor valuations, even if they have not yet reached Cisco’s extreme.
The Shiller CAPE ratio context matters here: at 40-41 as of May 2026, the S&P 500 sits at the second-highest reading in 155 years of market data, exceeded only by the dot-com peak of 44.2, which places current semiconductor valuations inside a historically rare band of aggregate market pricing.
What is sustaining these multiples is not near-term earnings power. It is long-duration total addressable market projections, such as the widely cited $15 trillion AI TAM by 2030. When premium valuations are justified primarily by revenue scenarios five or more years away, rather than by current or next-quarter earnings growth, the pricing dynamic carries a characteristic common to late-stage speculative cycles: the further out the justification, the more fragile the multiple.
Market breadth measures how many stocks are participating in a rally versus how many are sitting it out. The most common indicator is the advance/decline ratio, which tracks the number of stocks rising against the number falling on any given session. A healthy bull market typically sees broad participation across sectors and market capitalisations, not returns concentrated in a handful of names.
Breadth tends to deteriorate before price peaks, not simultaneously. When fewer stocks are doing the work of holding an index up, the index’s headline resilience is masking an underlying narrowing that can reverse quickly once the leaders correct.
The US equity recovery from late March 2026 has been driven by what the Financial Times described as a record-narrow cohort of stocks. The advance/decline ratio for the semiconductor sector sits near historically low levels, consistent with a rally led by very few names.
According to BlackRock iShares data, a significant share of SMH semiconductor ETF inflows since January 2026 has concentrated in Nvidia and Arm. JPMorgan’s early 2026 research flagged that approximately 70% of semiconductor sector market capitalisation was concentrated in the top five names.
The advance/decline ratio weakness visible in semiconductor ETFs is part of a broader pattern: the April 2026 S&P 500 posted a 98th-percentile monthly return while only 23% of its constituents outperformed the benchmark, a 5-percentage-point cap-weight versus equal-weight gap that reveals just how few names were doing the index-level heavy lifting.
Three structural breadth warning signals stand out:
Paul Tudor Jones, speaking to CNBC on 6 May 2026, estimated one to two years of AI bull market runway and drew a direct comparison to 1999. A similarly narrow Cisco/Microsoft/Intel-driven NASDAQ characterised the period he referenced. Breadth is not a timing tool, but it is a structural risk indicator: when a small number of stocks carry an entire index, the apparent strength is fragile.
The most structurally important difference between the current AI cycle and the dot-com era is hyperscaler capital expenditure. Aggregate 2026 AI capex from major cloud platforms is projected above $300 billion, representing approximately 40-50% year-on-year growth. This spending is real, large-scale, and verifiable through quarterly earnings filings, not speculative revenue recognition.
Microsoft’s Azure AI revenue is growing approximately 60% year on year. Alphabet’s Q1 2026 capex showed greater than 50% year-on-year growth. AMD reported a strong earnings period with an approximately 19% surge on the back of an upbeat AI data centre forecast. Arm’s own AI CPU order volume doubling to $2 billion over five weeks reinforces that demand at the infrastructure level is not theoretical.
The supply-constraint argument also matters. Current semiconductor demand is constrained by available manufacturing capacity, not by absent buyers. This is structurally different from the dot-com era’s overcapacity problem, where companies built infrastructure ahead of demand that never arrived.
The hyperscaler capital expenditure trajectory reported through Q1 2026 provides the strongest single piece of evidence for the bull case: Amazon, Microsoft, Alphabet, and Meta collectively spent $130 billion in the quarter alone, with Microsoft’s annualised AI revenue run rate surpassing $37 billion at 123% year-over-year growth, figures that are audited and verifiable rather than projected.
Dan Ives of Wedbush Securities characterised the AI investment cycle as being in its “third inning” on 1 May 2026, forecasting approximately 15% technology sector upside for 2026. David Tepper of Appaloosa Management cited hyperscaler capex as evidence of real demand rather than speculative excess.
Three structural differences from the dot-com era in summary:
If hyperscaler spending continues to grow at current rates, the fundamental demand underpinning elevated semiconductor valuations remains intact. That is the bull case at its strongest.
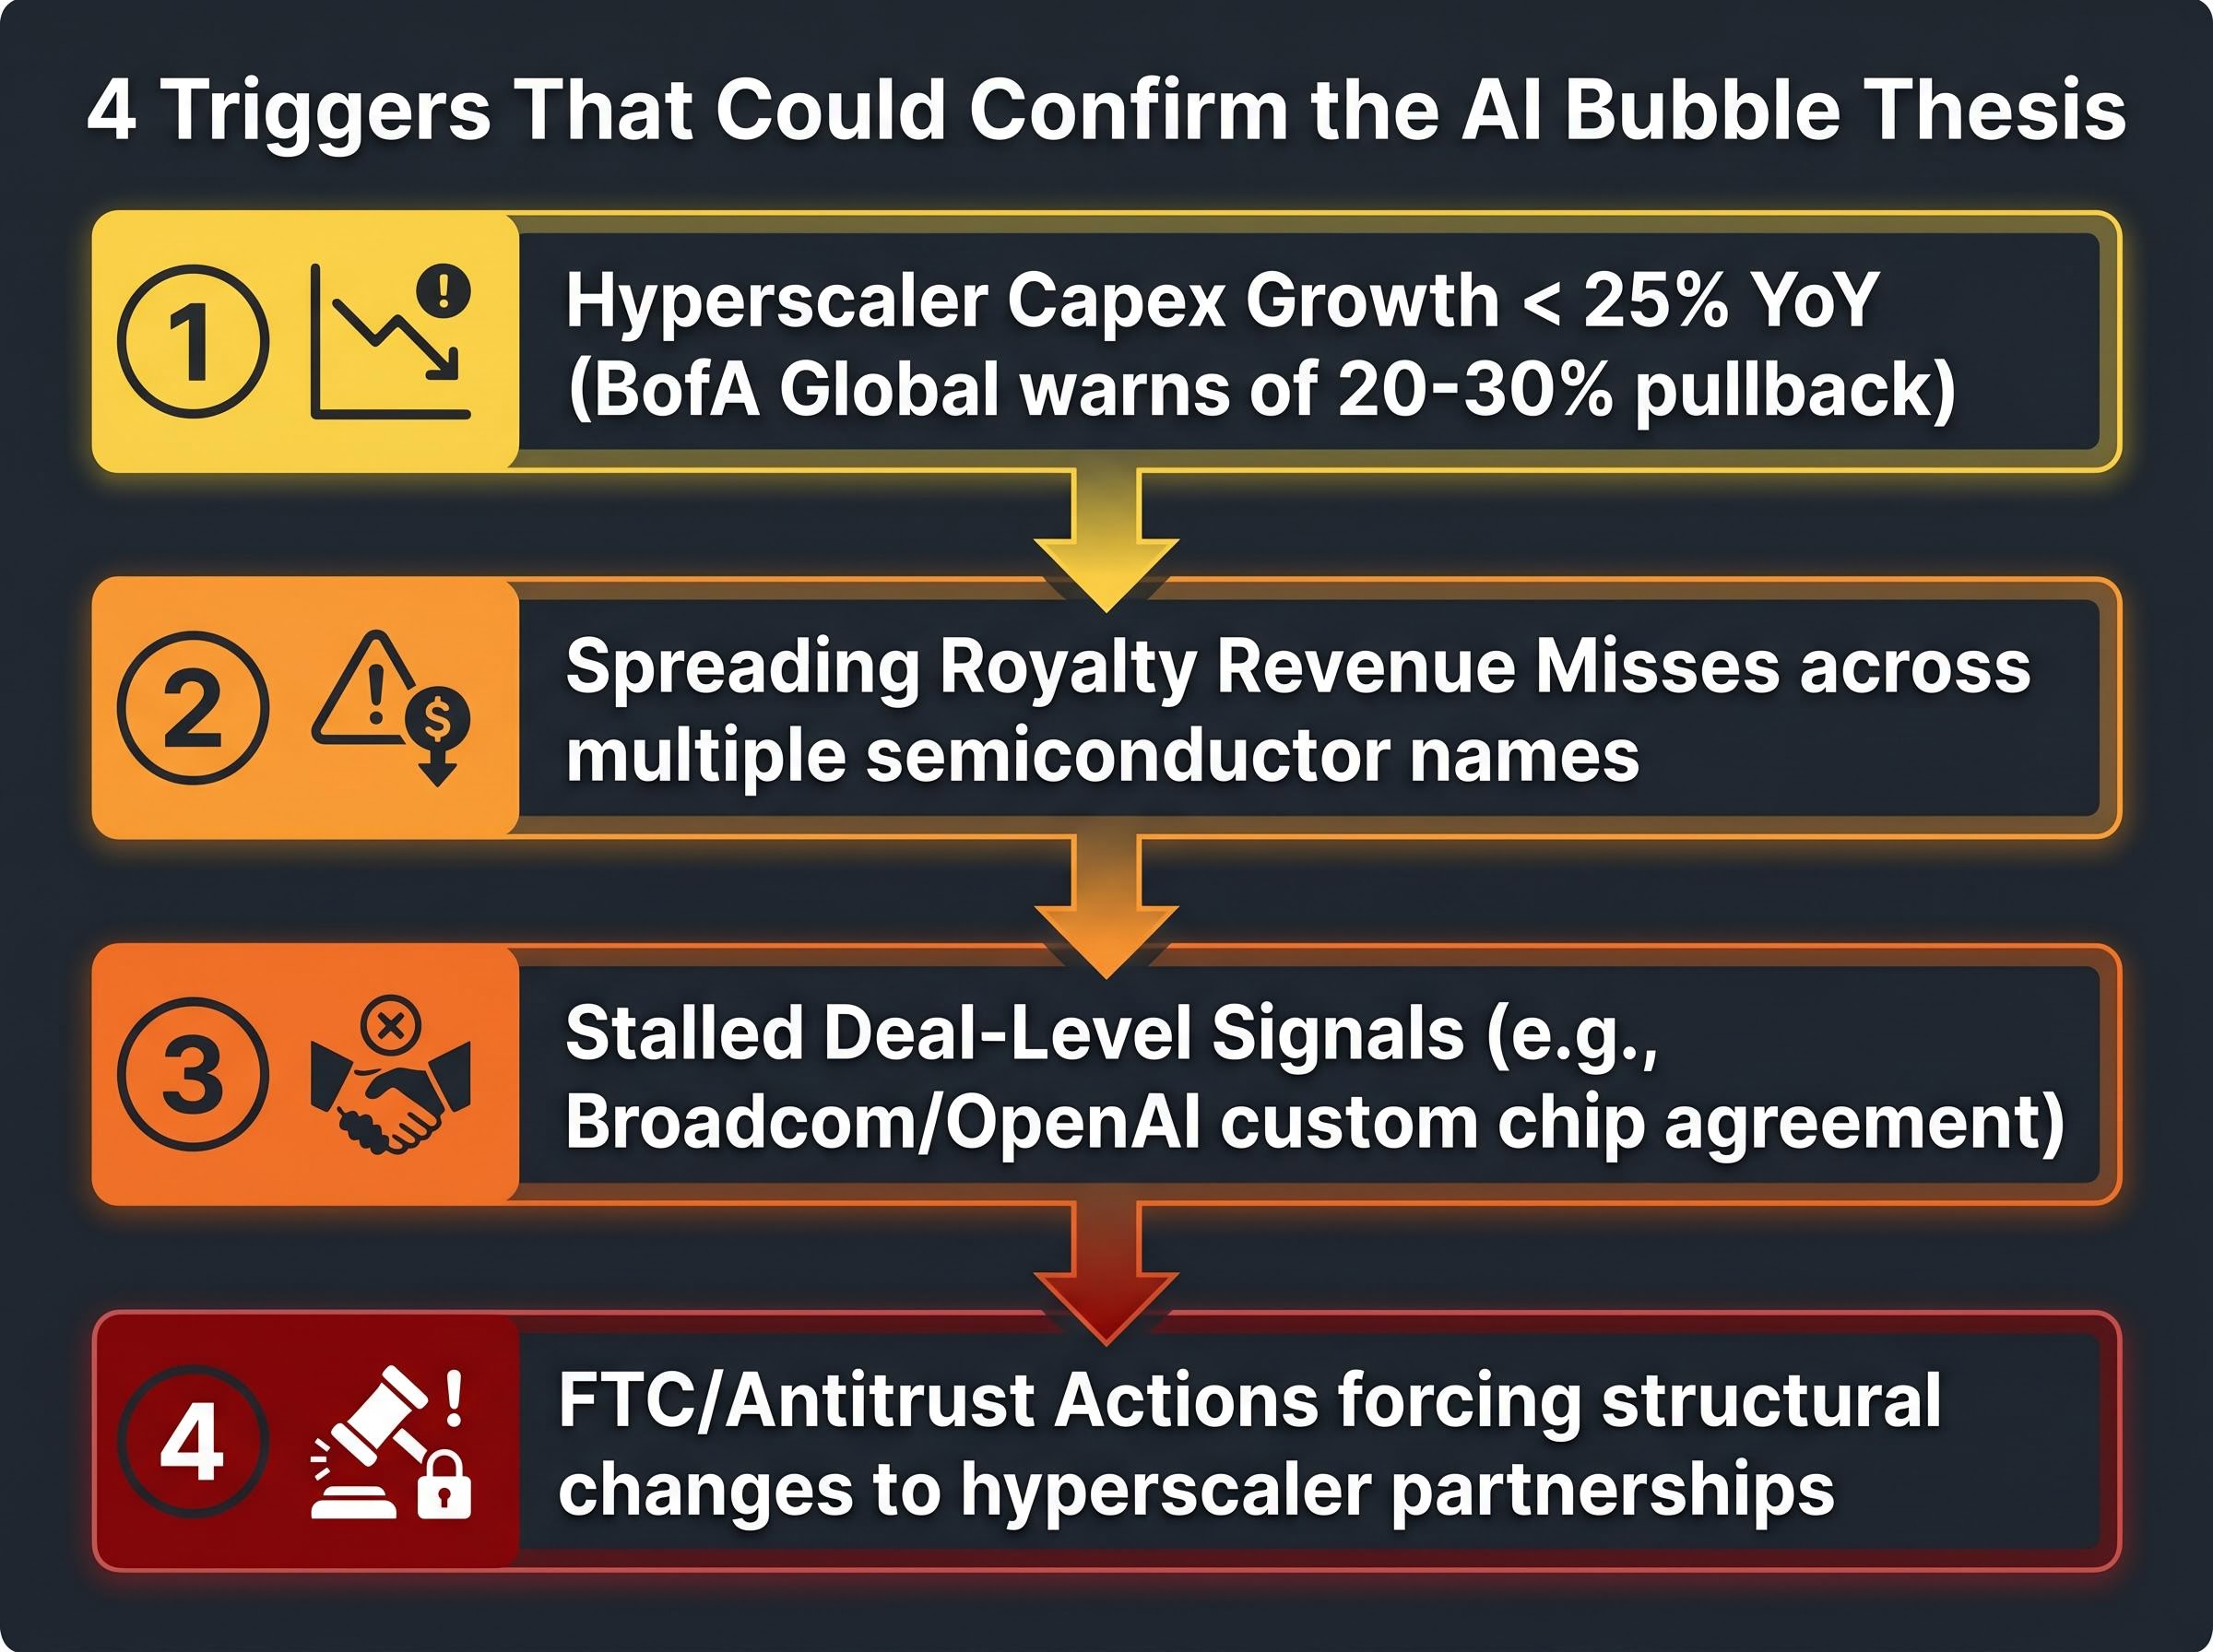
The primary trigger variable is hyperscaler capex growth. BofA Global has warned of a potential 20-30% pullback if that growth rate dips below approximately 25% year on year. At that threshold, the valuation premiums currently assigned to semiconductor suppliers would face significant compression risk, because the multiples assume acceleration, not merely continuation.
A secondary trigger sits in royalty revenue trends. If misses like Arm’s $671 million print begin appearing across multiple chip names, and if those misses reflect demand weakness rather than supply constraints, the thesis shifts from a timing question to a fundamental one. Marvell declined 7%, Micron fell 3%, and Broadcom dropped 3% in the 7 May session, suggesting the semiconductor pullback was already broader than Arm alone.
The stalled Broadcom/OpenAI custom chip agreement represents a specific deal-level signal worth monitoring, as failure to close would indicate friction in the commercial AI hardware pipeline.
The FTC has ongoing inquiries into generative AI investments and hyperscaler partnerships as of early 2026. A material antitrust action targeting AI infrastructure concentration could disrupt the partnership structures that currently channel capital into semiconductor demand. This regulatory overhang operates on a slower timeline than market-driven deceleration, but it represents a non-trivial tail risk.
The FTC inquiries into generative AI partnerships and investments, active through late 2025 and into 2026, target the same hyperscaler relationships that underpin semiconductor demand projections, meaning a material enforcement action could simultaneously disrupt both the commercial AI pipeline and the valuation assumptions built on top of it.
Four confirmation signals to watch, in order of likely timing:
Translating a macro concern into specific, monitorable thresholds gives investors a disciplined framework for managing AI semiconductor exposure rather than reacting emotionally to individual session moves.
The capex cycle is real and ongoing. The valuations, however, have priced in a scenario where it accelerates further, not merely continues. That asymmetry means even a deceleration in hyperscaler spending, without an outright reversal, could produce significant multiple compression for semiconductor names trading at 60-85x forward earnings.
Tudor Jones’ one-to-two-year runway estimate, delivered on CNBC on 6 May 2026, is worth treating not as a buy signal but as a risk horizon. If his framing is correct, the period of maximum valuation risk falls around 2027, which implies position management rather than immediate exit.
The 7 May session offered a real-time illustration of how the AI trade fragments under stress. The semiconductor ETF fell 2.86% while the iShares Expanded Tech-Software ETF rose 3.4% in the same session. Software held. Hardware sold off. That divergence is exactly the kind of within-theme rotation a risk-aware investor can use rather than simply endure.
Three practical portfolio implications:
The AI investment thesis is not broken. The margin of safety around it is narrower than at any point in this cycle, and the difference between a structural bull market and a late-stage speculative run will be resolved by the specific data points outlined above, not by pundit commentary.
This article is for informational purposes only and should not be considered financial advice. Investors should conduct their own research and consult with financial professionals before making investment decisions. Past performance does not guarantee future results. Financial projections are subject to market conditions and various risk factors.
An AI stock bubble refers to a period where AI-related equities trade at valuations far above what near-term earnings justify, driven by long-duration growth projections. The current cycle shares similarities with 1999, including narrow market breadth and extreme semiconductor multiples, though it differs in that hyperscaler capital expenditure is real and verifiable rather than speculative.
Paul Tudor Jones told CNBC on 6 May 2026 that the AI bull market resembles 1999 and estimated approximately one to two years of runway remain before a potential bust, framing it as a risk horizon for position management rather than an immediate sell signal.
The four key confirmation signals to monitor are: hyperscaler capex growth falling below 25% year on year, royalty revenue misses spreading across multiple semiconductor names, stalled or cancelled custom chip agreements, and FTC or antitrust actions forcing structural changes to hyperscaler AI partnerships.
Arm Holdings shares fell approximately 10% after its Q4 FY26 results because royalty revenue of $671 million missed the $693 million estimate, with CEO Rene Haas citing negative smartphone unit growth and memory chip supply constraints, while Q1 FY27 guidance signalled a sequential step-down to $1.26 billion.
Investors can manage risk by monitoring hyperscaler capex growth rates quarterly, watching royalty revenue trends as the primary near-term health signal for chip names, and considering a relative shift in weighting from semiconductor to software AI exposure, given that software ETFs held up while hardware sold off in the 7 May 2026 session.