
How to Analyse Any High-Multiple Stock Using Tesla as a Case Study
23 mins ago

At roughly $400 per share, Tesla trades at more than 300 times its trailing earnings. That number is either the most obvious red flag in the market or the most misunderstood discount in the market, depending entirely on which future the investor believes is coming.
Tesla’s Q1 2026 earnings, reported 22 April, landed with a beat on EPS ($0.41) and revenue ($22.39 billion), yet the stock’s real story has almost nothing to do with those figures. With a $25 billion capital expenditure plan, Cyber Cab production underway, Optimus scale-up consuming former Model S/X factory space, and regulatory approval for California robotaxi operations still outstanding, the company sits in the middle of a transformation that has not yet produced the revenue it is priced to deliver. That makes it an ideal case study for investors who want to understand how to evaluate any company whose current price is a bet on a future that may or may not arrive.
This guide uses Tesla’s live bull and bear case numbers to teach a repeatable methodology for scenario-based stock valuation analysis, with particular focus on why the price paid at entry shapes every possible return outcome.
The instinct is to check the price-to-earnings ratio, compare it to the sector average, and form a judgement. For a company like Procter & Gamble or Johnson & Johnson, that instinct works. For Tesla in May 2026, it misleads.
A stock trading at 317-364x trailing earnings is not mispriced relative to what the business earns today. It is priced relative to an earnings base that does not yet exist. Every buyer at $400 is implicitly forecasting a future in which robotaxis generate billions in recurring revenue, Optimus robots ship at commercial scale, and margins expand toward software-like economics. That implicit forecast is what analysts call “embedded expectations,” the unwritten business plan baked into every share price.
Standard valuation ratios were designed for companies whose earnings base grows or shrinks, not for companies whose earnings base is expected to change category entirely. Consider what they capture versus what they miss:
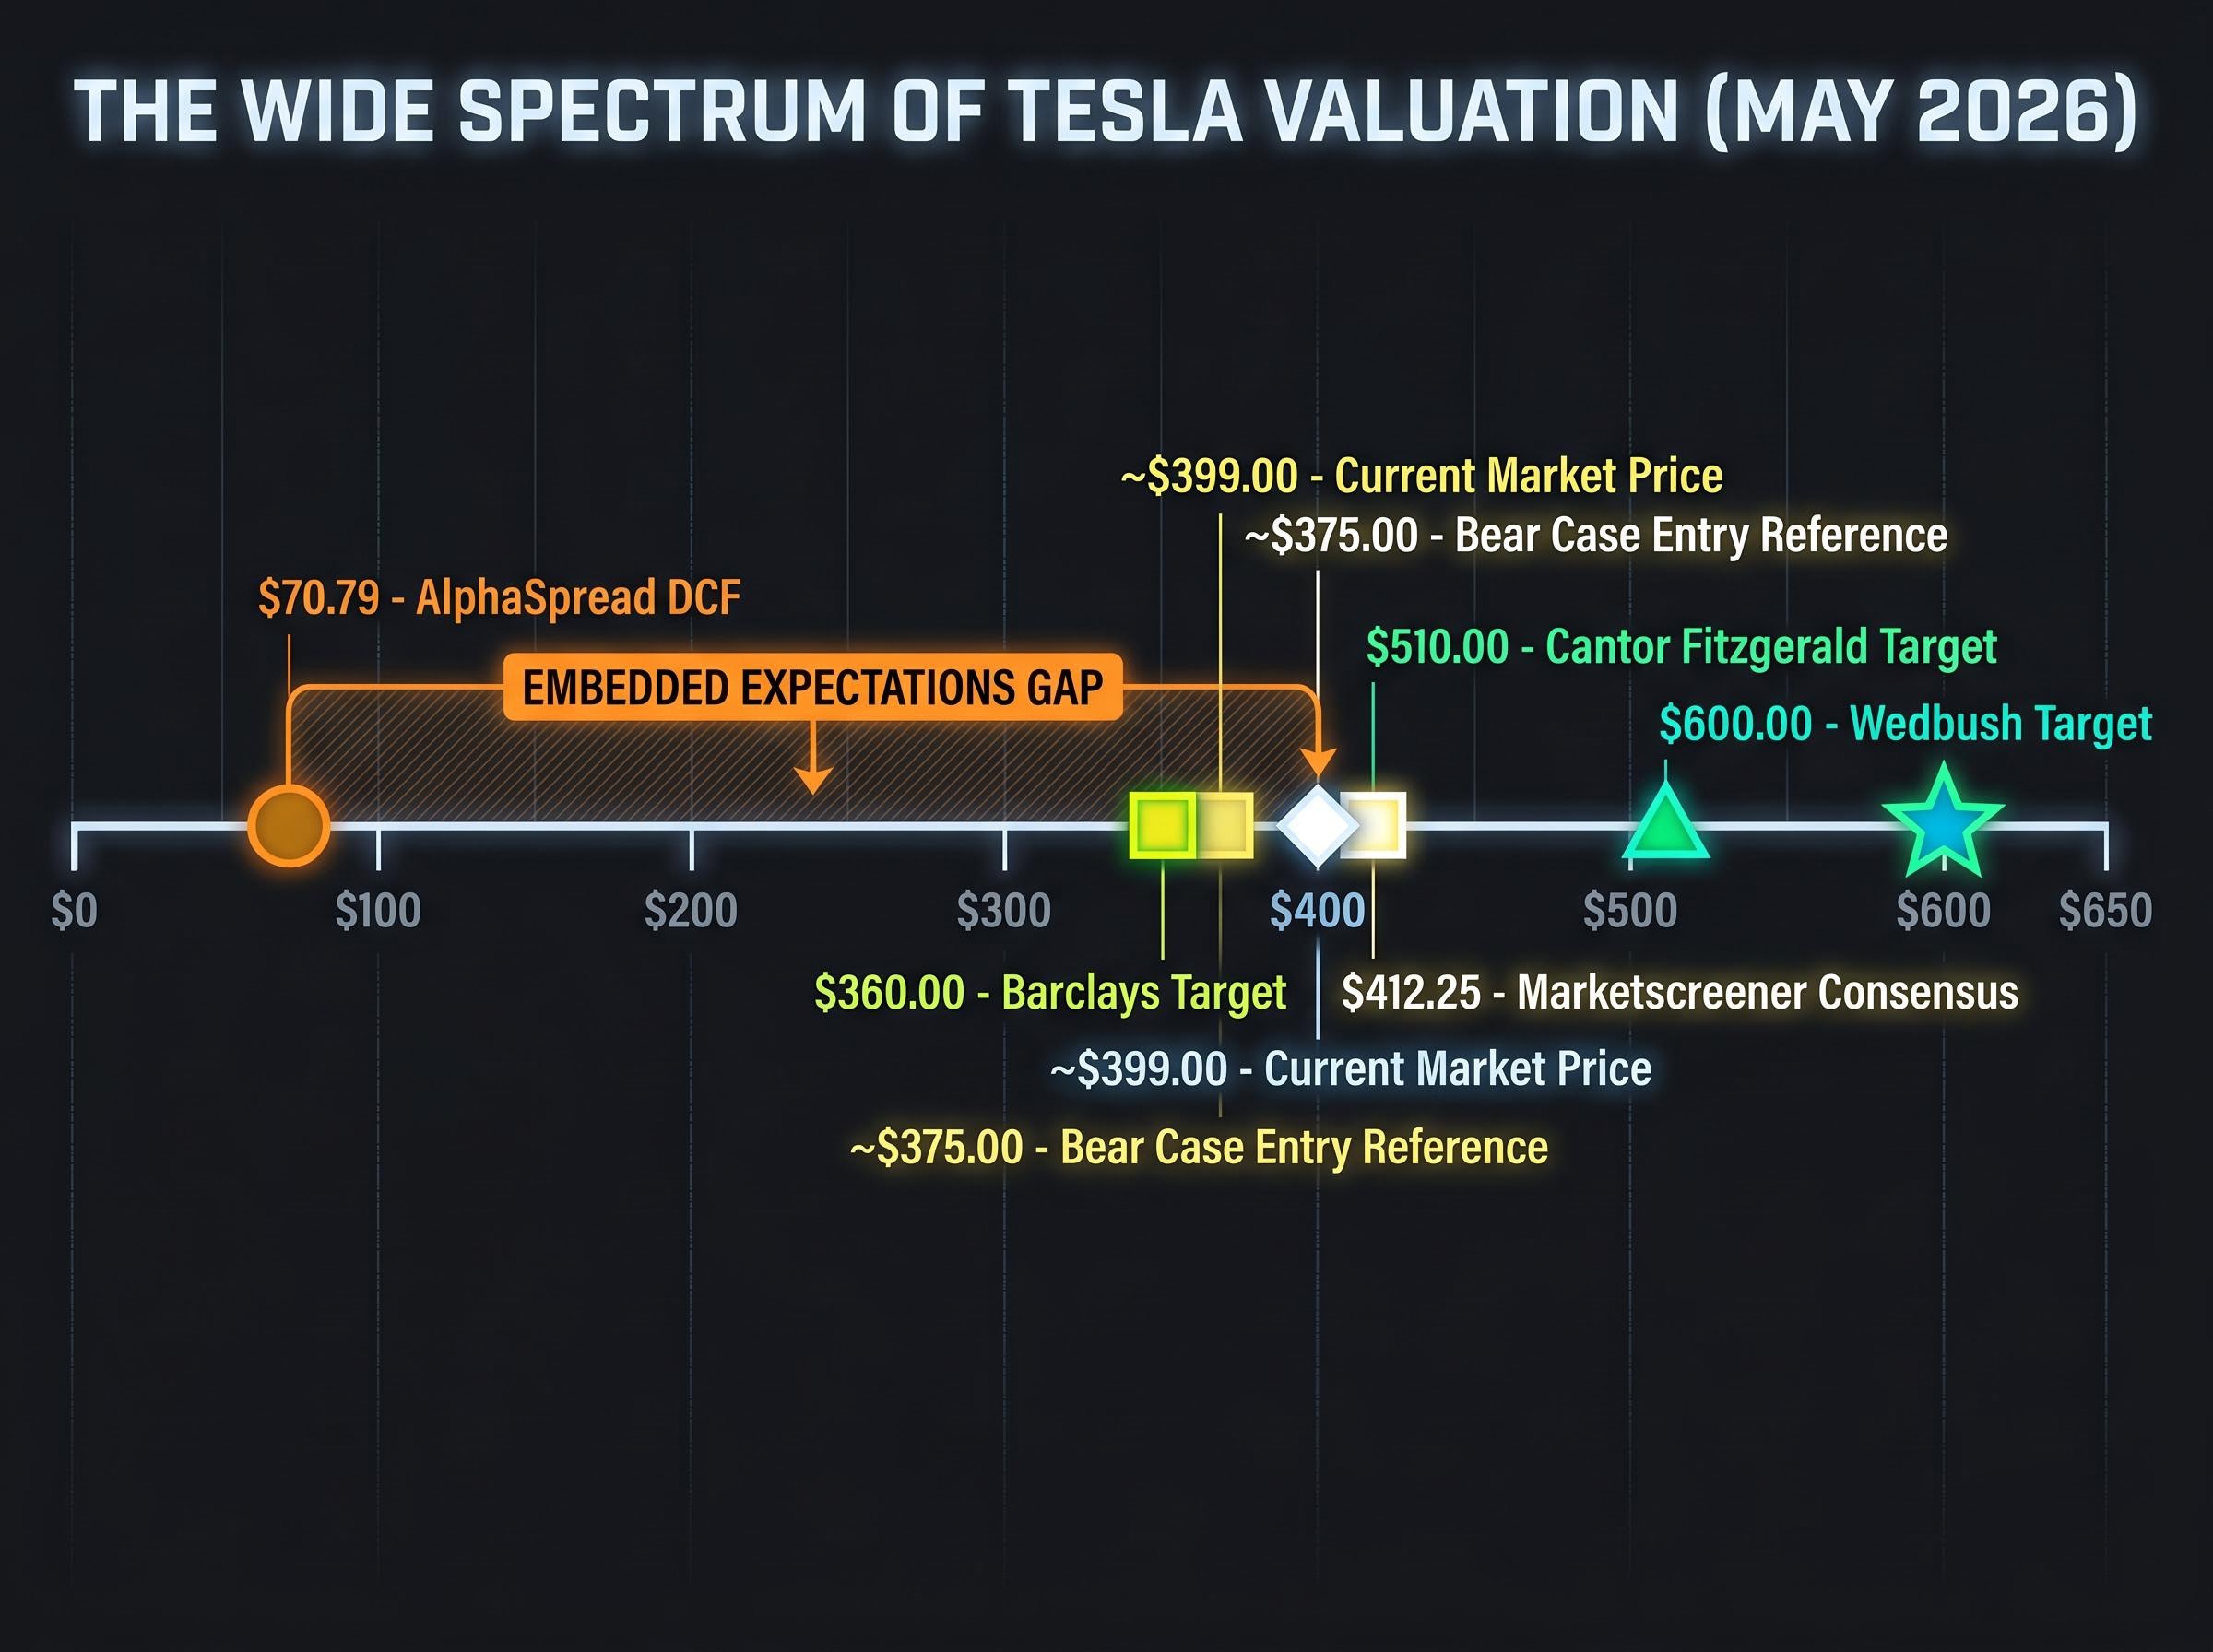
AlphaSpread’s discounted cash flow model values Tesla at $70.79 per share, implying approximately 82% overvaluation at the current market price of roughly $399. The gap between that figure and the live market price is the distance between what Tesla earns today and what the market believes it will earn.
Investors who skip this mental model recalibration tend to evaluate transformation-stage stocks with tools designed for mature businesses. The result is systematic misjudgement in both directions: dismissing a legitimate opportunity because the P/E looks absurd, or buying into a narrative without quantifying what must be true for it to pay off.
Scenario-based valuation sounds like a specialist tool. It is not. At its core, the methodology asks three questions, each one a dial the investor can turn.
First: how fast will revenue grow? Second: what share of that revenue will convert to profit? Third: what multiple will the market assign to those profits at the end of the holding period?
Small changes in any of these inputs compound dramatically over a 10-year horizon, which is precisely why scenario analysis produces such wide outcome ranges. A 5-percentage-point difference in annual revenue growth, compounded over a decade, creates an earnings gap measured in tens of billions. The table below illustrates how these three inputs differ across bull, base, and bear scenarios for Tesla.
| Input Variable | Bull Case | Base Case | Bear Case |
|---|---|---|---|
| Annual Revenue Growth | 20-35% (midpoint ~27%) | 12-20% | 6-12% (midpoint ~9%) |
| Net Profit Margin | 20-30% | 14-20% | 8-14% |
| Exit Valuation Multiple | 25-35x earnings | 22-25x earnings | 18-22x earnings |
The standard sequence for applying these inputs runs as follows:
Discounted cash flow (DCF) modelling is the more rigorous complement to this multiple-based approach. DCF projects actual free cash flows rather than earnings and discounts them at a rate reflecting the investor’s required return. Its weakness is acute sensitivity to two assumptions: the discount rate and the terminal growth rate applied after the projection window closes. AlphaSpread’s $70.79 intrinsic value estimate represents a DCF anchored to current cash flows, which is why it diverges so dramatically from the market price.
Damodaran’s framework for valuing high-growth firms identifies terminal growth rate and discount rate assumptions as the two variables with the greatest capacity to distort DCF outputs, which explains why a modest shift in either input can move an intrinsic value estimate by hundreds of percentage points when applied to a company like Tesla.
Understanding these three inputs and how they interact gives investors a structured way to interrogate any analyst price target or market narrative, rather than simply accepting or rejecting it.
Sum-of-the-parts methodology offers an alternative valuation lens for high-optionality companies, assigning separate revenue multiples to Tesla’s automotive business, energy division, FSD licensing, robotaxi network, and Optimus programme before aggregating them into a total equity value, and the range of legitimate outputs from this approach spans from under $300 to over $5,800 per share depending on which segments the analyst credits.
The bull case for Tesla is not a vague appeal to innovation. It is a specific set of operational milestones, each of which must be met within a defined timeframe for the current share price to deliver satisfactory returns.
Those milestones include:
If all of these milestones materialise on schedule, the bull case projects annualised returns of 11-35% over 10 years. Cantor Fitzgerald holds a price target of $510; Wedbush set a $600 target in January 2026. Autonomous vehicle miles driven nearly doubled in Q1 2026 versus the prior period, providing early-stage evidence that the FSD software stack is accumulating the data needed for regulatory approval.
Tesla’s Q1 2026 earnings beat every Wall Street consensus metric on revenue, adjusted EPS, and gross margin, yet the Fremont facility had already been physically converted for Optimus production by the reporting date, locking in capital commitments that will suppress free cash flow through 2026 and into 2027.
The question the bull case cannot answer on its own is probabilistic. Even a credible set of milestones carries a probability of full materialisation, and reasonable estimates place that probability in a range that changes the expected value calculation fundamentally.
This outcome is estimated to carry roughly a 5-10% probability of fully materialising, meaning the expected value of the bull case is a fraction of its headline return.
Tesla’s CFO framed the $25 billion in planned 2026 capital expenditure as “just starting,” a characterisation that carries direct implications for free cash flow over 2026-2027. Q1 2026 capex alone reached $2.49 billion, and the full-year guidance sits approximately 25% above prior guidance and 67% higher year-over-year.
The company is investing simultaneously across Optimus manufacturing, AI chips, and Cyber Cab production. That concurrent spend is the structural reason near-term earnings cannot carry the valuation weight. The bull case requires patience measured in years, not quarters, and the investor must be comfortable with suppressed free cash flow throughout the investment cycle.
The bear case does not require Tesla to fail as a company. It requires only that the transformation arrives later or smaller than priced.
Under bear case assumptions, Tesla is treated as a strong electric vehicle manufacturer without autonomous or robotics revenue contribution. Even this framing assumes above-average margins relative to Ford or General Motors, with net margins of 8-14% and revenue growth of 6-12% annually. The exit multiple of 18-22x earnings would still place Tesla among the most highly valued automakers on the planet.
The problem is the entry price. At approximately $375 per share (the reference price at the time of Q1 earnings), every modelled return outcome under the bear case was negative. The current price contains no margin of safety for the scenario where the transformation timeline slips.
At approximately $375 per share, every projected return outcome under the bear case was negative.
Regulatory reality gives the bear case meaningful weight. The California DMV adopted new autonomous vehicle rules on 29 April 2026, and Tesla’s ride-hailing activities are not classified as robotaxi under the current California regulatory framework. Full approval for robotaxi operations could be delayed until 2027 or later.
Elon Musk’s historical relationship with timelines adds further context:
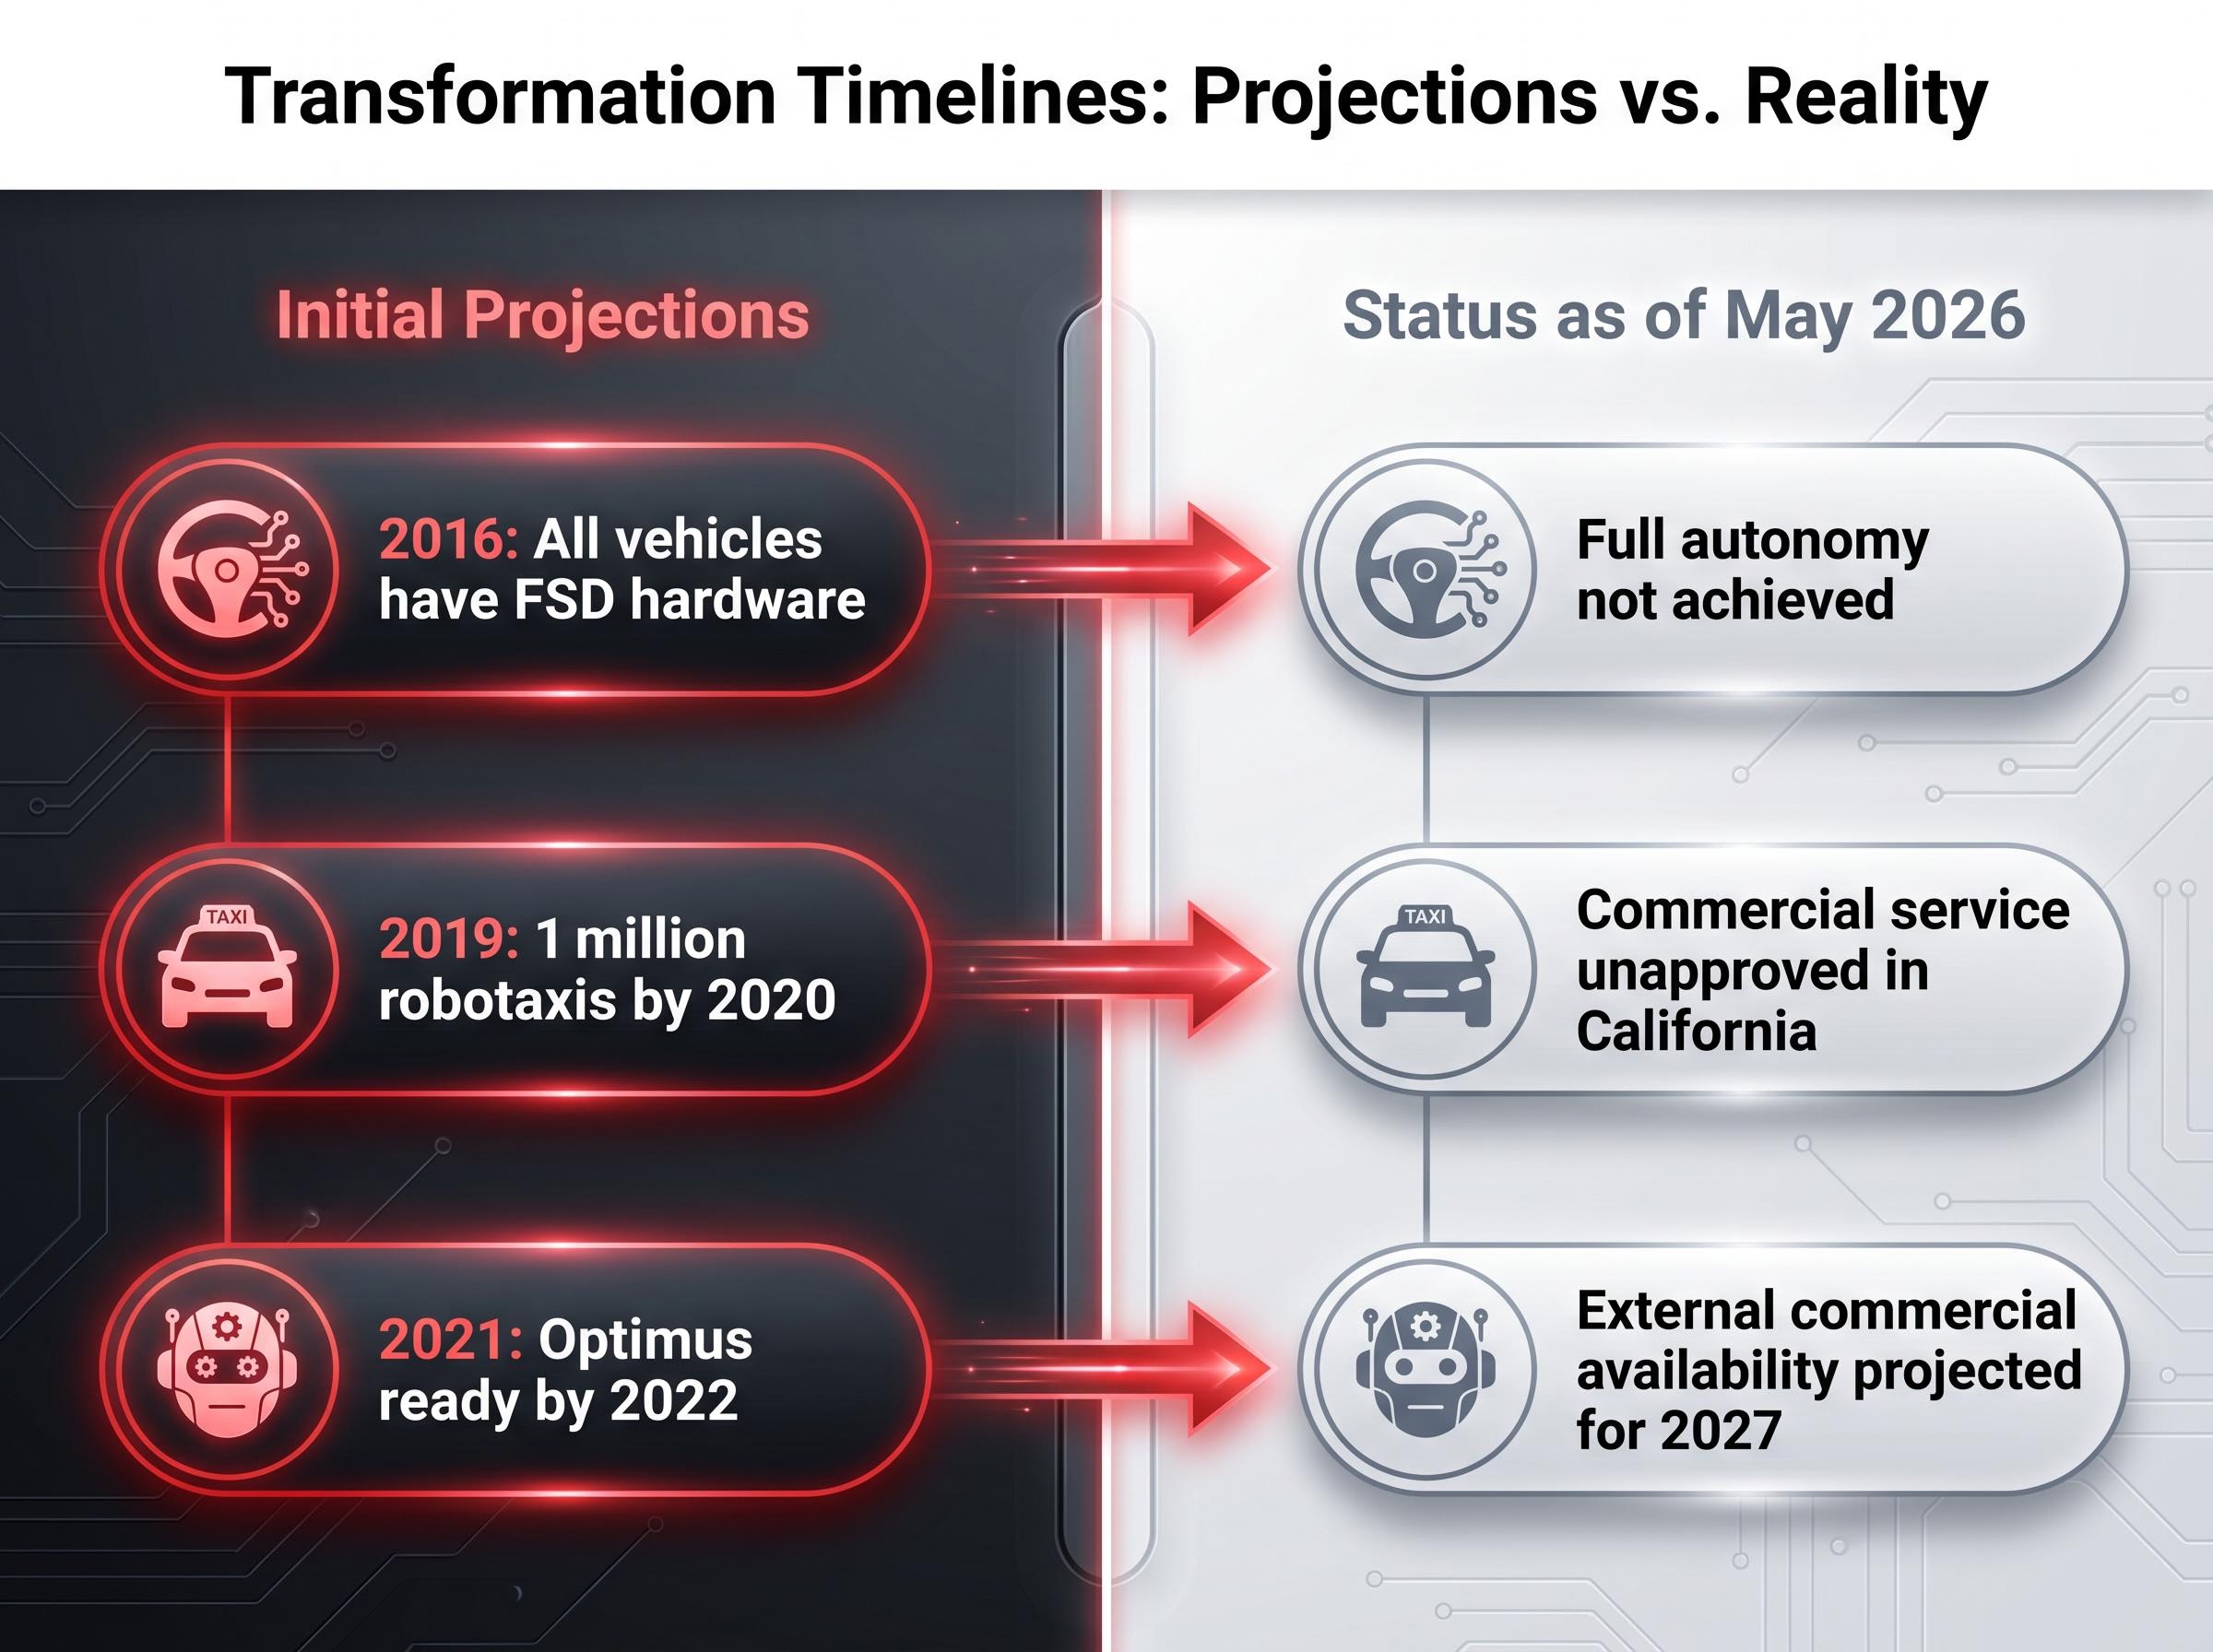
Meanwhile, BYD has surpassed Tesla as the largest EV producer by volume globally, and core automotive margins sit at 7-10%. Barclays holds the lowest analyst target at $360.
| Assumption | Bull Case | Bear Case |
|---|---|---|
| Annual Revenue Growth | 20-35% | 6-12% |
| Net Profit Margin | 20-30% | 8-14% |
| Exit Valuation Multiple | 25-35x | 18-22x |
| Implied 10-Year Return (Annualised) | 11-35% | Negative across all scenarios |
The bear case does not require catastrophe. It only requires that the most likely historical pattern, where technology transitions arrive later and smaller than initially projected, holds once more.
Two investors can hold identical views on Tesla’s transformation potential and produce completely different returns. The difference is the price they paid.
Consider three entry points for the same underlying business. An investor who bought Tesla near $100 a few years prior holds a position with a cost basis that provides a buffer against even significant declines. An investor entering near $400 (roughly the current price) needs the bull case to at least partially materialise before the position reaches break-even on a risk-adjusted basis. An investor who bought near the prior peak of approximately $450 is already underwater relative to the May 2026 price and needs substantial upside to recover.
The average analyst consensus target sits at $412.25, according to Marketscreener. The range spans from $360 (Barclays) to $600 (Wedbush). Analyst EPS estimates for Tesla declined more than 90% from their peak before recovering; forward estimates project EPS growing more than 5x from current levels, with 2027 net income estimated at approximately $7.3 billion. Tesla’s enterprise value sits at approximately $1.54 trillion as of early May 2026.
The entry price paid for a stock has a significant impact on future returns, illustrated by the contrast between buying Tesla near $100 versus near $400. The same company, the same transformation thesis, yet vastly different risk-reward profiles.
The probabilistic weighting technique forces the investor to confront what they actually believe rather than defaulting to hope:
Probability-weighted scenario analysis converts three narrative outcomes into a single blended expected return that can be tested against a required internal rate of return at any given entry price, and the same calculation that produces a buy decision at $100 per share can produce a hold or sell decision at $411 per share with no change in the underlying business assumptions.
Margin of safety is the gap between the price paid and the estimated intrinsic value of the business. It functions as a structural buffer against scenario uncertainty. All major intrinsic value models place Tesla’s intrinsic value far below its current market price: AlphaSpread’s DCF sits at $70.79, and Morningstar’s normalised P/E of 206.64x still implies a valuation well below the trailing P/E of 317-364x.
This does not make the stock a definitive sell. It does mean the investor buying at current levels is relying entirely on the bull case materialising, with limited buffer for error, delay, or partial execution.
Three principles emerge from this exercise, and none of them are specific to Tesla.
Scenario analysis produces a range of outcomes, not a single answer. The width of that range is itself information: a company whose bull and bear cases span from 35% annualised gains to negative returns is telling the investor that certainty is not available at any price. Entry price determines which part of that range the investor can access. The same thesis, purchased at different prices, produces different returns. Probability assignments must be honest, not aspirational. If the bull case carries a 5-10% chance of full materialisation, the expected value calculation must reflect that, not the return the investor hopes to achieve.
Partial execution, where some milestones land and others slip, is the most probable outcome according to the available evidence. It may produce neither the bull case return nor a catastrophic loss. The investor’s task is to determine whether the current price compensates fairly for the uncertainty between those outcomes.
For investors who conclude that the current entry price is too high but remain constructive on the long-term transformation thesis, our dedicated guide to dollar-cost averaging examines what the historical data shows about staged entry strategies versus lump-sum deployment, including the specific conditions under which a phased approach reduces risk-adjusted regret without mathematically sacrificing expected return.
For any company in transition, the questions are transferable. What specific milestones would confirm the bull case is on track? What milestones would signal the bear case is unfolding? And does the current price compensate the investor fairly for the uncertainty between those two futures?
This article is for informational purposes only and should not be considered financial advice. Investors should conduct their own research and consult with financial professionals before making investment decisions. Past performance does not guarantee future results. Financial projections are subject to market conditions and various risk factors.
Scenario-based stock valuation analysis is a method that projects a range of outcomes (bull, base, and bear cases) by varying three key inputs: revenue growth rate, net profit margin, and exit valuation multiple, allowing investors to quantify what must be true for a stock price to be justified.
Standard ratios like trailing P/E measure a company's current earnings base, but transformation-stage companies are priced on earnings that do not yet exist, meaning a high P/E may reflect future product lines rather than present mispricing.
Two investors with identical views on a company's future can produce completely different returns based solely on the price they paid; an investor entering Tesla near $100 has a cost buffer that an investor entering near $400 does not, even if both hold the same long-term thesis.
Assign an explicit probability to each scenario (bull, base, bear) so they sum to 100%, multiply each scenario's projected annualised return by its probability, then sum the results to produce a blended expected return that can be compared against your required rate of return.
Tesla's $25 billion 2026 capex guidance, roughly 67% higher year-over-year, signals that free cash flow will remain suppressed through 2026-2027 as the company invests simultaneously in Optimus manufacturing, AI chips, and Cyber Cab production.


