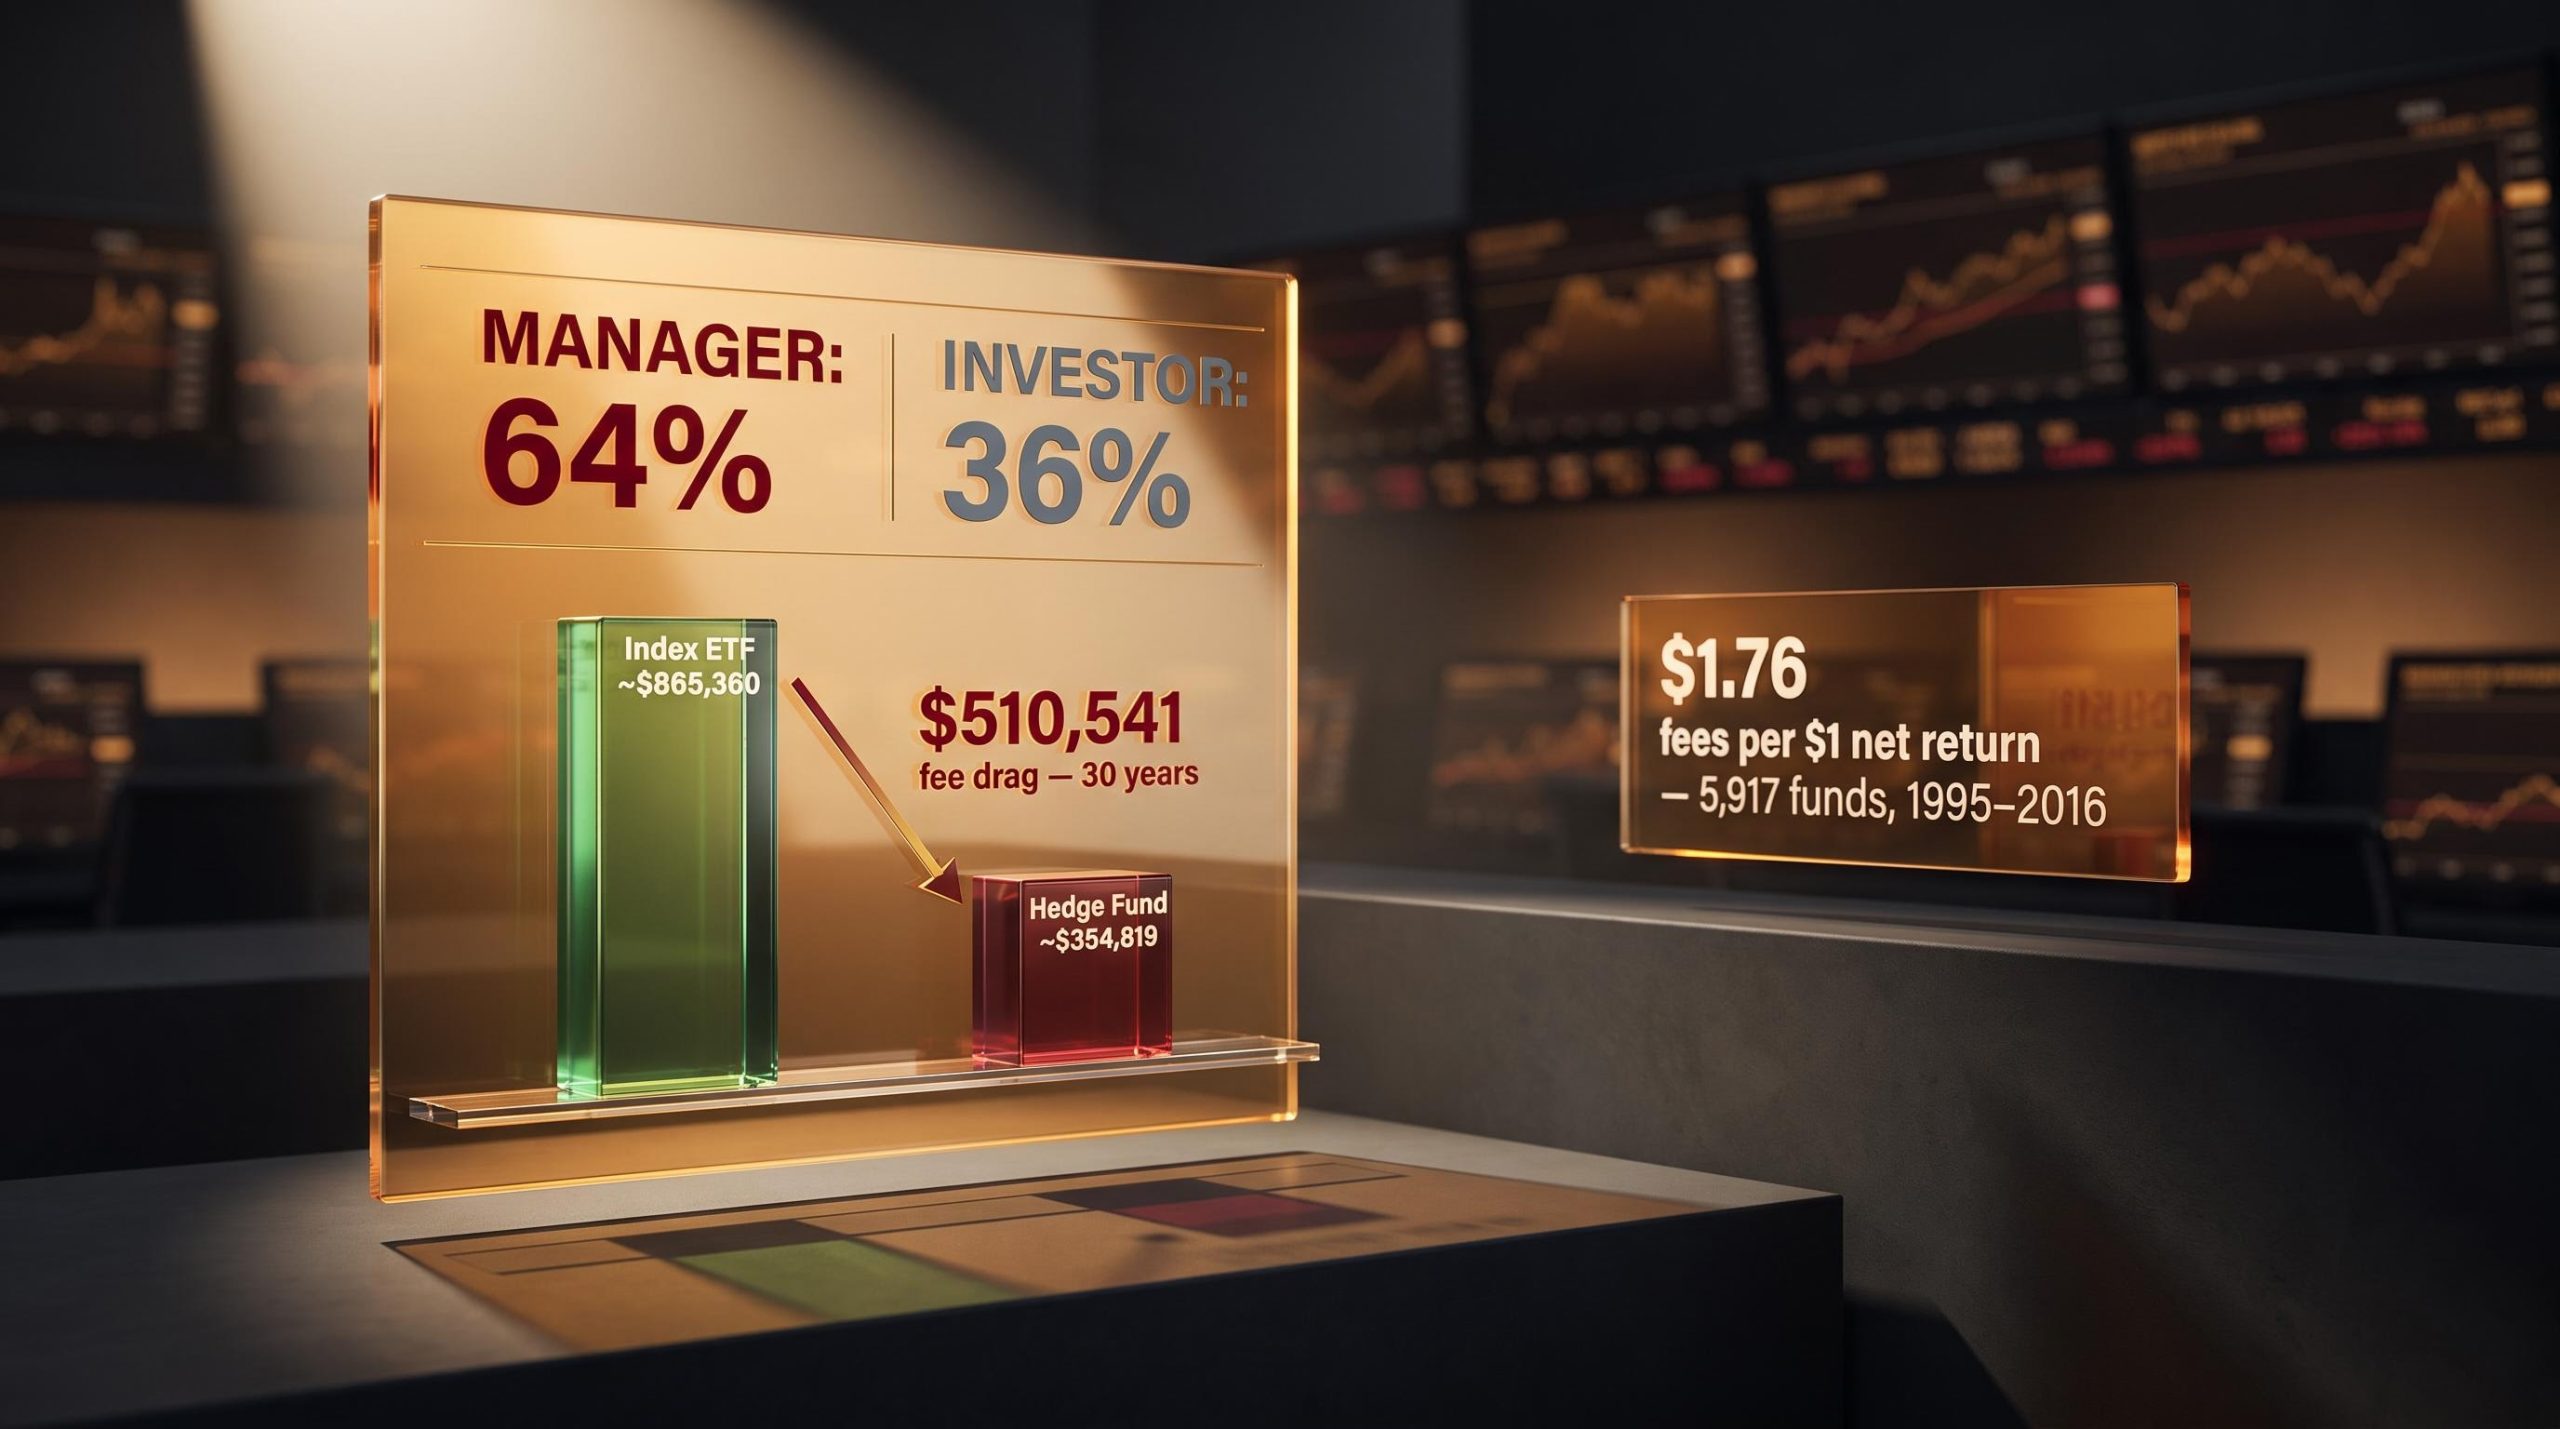
Over a 22-year period ending in 2016, investors in 5,917 hedge funds paid $1.76 in fees for every $1 of net return they actually received. The fee was the primary output of the relationship, not the investment return.
That finding, from NBER Working Paper 27454 by Itzhak Ben-David, Justin Birru, and Andrea Rossi, reframes the hedge fund fee question entirely. The issue is not whether hedge funds generate returns. It is who captures them. When you run a 30-year compounding simulation with fees as the only variable, the gap between a low-cost index ETF and a hedge fund exceeds $510,000 on an identical $50,000 starting balance.
Here is what the numbers actually tell you about the long-term cost of high-fee investment products, why institutional investors still use them despite that cost, and a single evaluative question you can apply to any high-fee product you currently hold or are considering.
The fee structure that built an industry (and who it actually benefits)
The hedge fund fee model was not a natural evolution of investment management. It was a design choice. In 1949, Alfred Winslow Jones, a sociologist and former Fortune magazine editor, created a fund with $100,000 in starting capital, $40,000 of which came from his own pocket, structured to generate returns whether markets rose or fell. The fee structure he attached to it, 2% of assets annually plus 20% of profits, predated modern portfolio theory, performance attribution, and most of what institutional investors now understand about separating manager skill from luck.
That structure became the industry standard for 70 years. Its two components work differently:
- Management fee: A flat annual charge on total assets under management, collected regardless of whether the fund makes or loses money
- Performance fee: A percentage of any gains the fund generates, charged on gross profits rather than on net gains recovered from prior losses
Recent industry surveys show the headline numbers have softened to approximately 1.5% management and 17-18% performance. That looks like a correction. It is a partial concession at best. The structural problem sits in how performance fees are calculated, not in the percentage itself.
NBER Working Paper 27454 found that investors paid $1.76 in fees for every $1 of net return they received, because roughly 60% of the gains on which fees were charged were later offset by losses that investors bore alone.
The declining headline fees matter less than you might expect, because the mechanism that produces the real cost, performance fees charged on gains that are subsequently erased, remains intact regardless of whether the rate is 20% or 17%.
Performance fee benchmarks are the mechanism that determines whether a manager is being compensated for genuine skill or simply for bearing risk the investor was already exposed to; when a high-risk strategy is measured against a low-volatility reference rate, the effective incentive fee rate climbs toward the 50% figure the NBER study documents.
When big ASX news breaks, our subscribers know first
What the NBER study found when it looked at 5,917 funds over 22 years
The study’s scale is the first thing worth registering. Ben-David, Birru, and Rossi examined 5,917 hedge funds operating between 1995 and 2016. This is not a critique of a single bad actor or a cherry-picked time window. It is an industry-wide accounting.
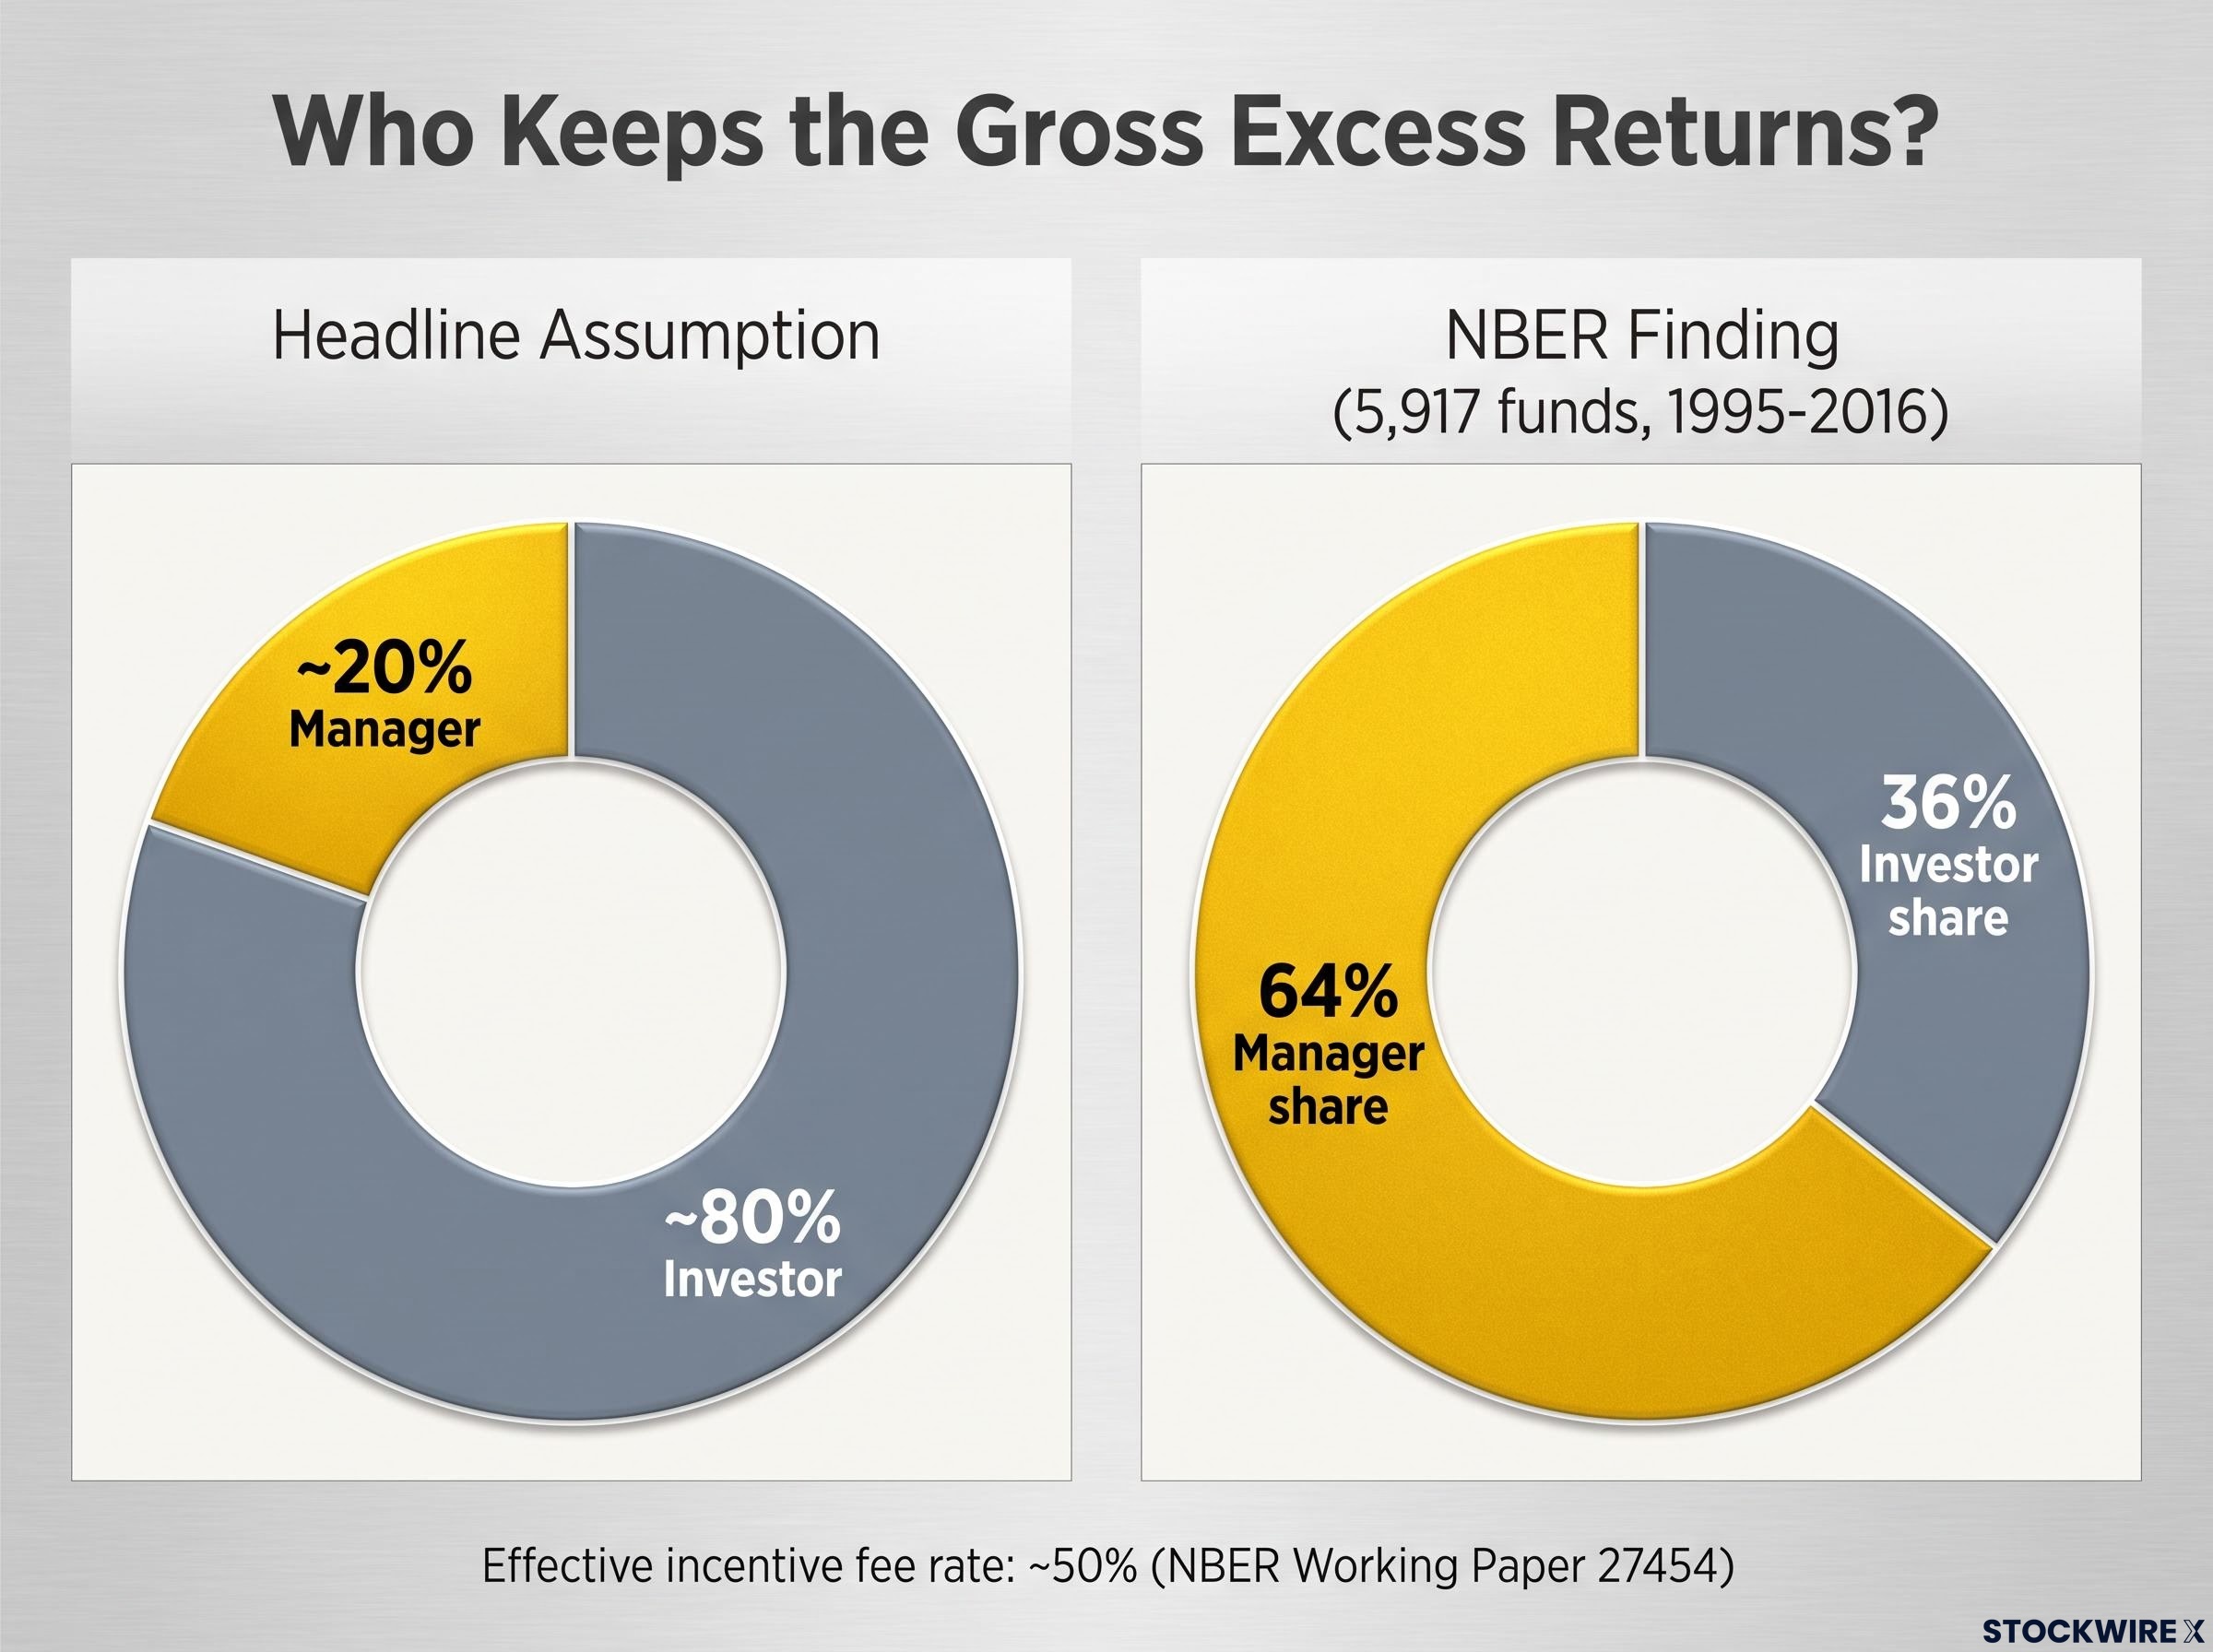
The headline performance fee is 20%. The effective incentive fee rate the researchers documented was approximately 50%. The mechanism is specific: performance fees apply to gross gains with no provision to recover subsequent losses, meaning around 60% of the gains on which fees were levied were eventually wiped out by declines that investors carried entirely on their own. The manager collected the fee regardless. The investor absorbed the loss.
The clearest single-number summary: managers kept 64% of aggregate gross excess returns. Investors kept 36%.
| Metric | Headline assumption | NBER finding |
|---|---|---|
| Incentive fee rate | ~20% | ~50% effective |
| Average annual cost (% of AUM) | ~2% management only | 3.44% all-in |
| Investor share of gross excess returns | ~80% | 36% |
| Manager share of gross excess returns | ~20% | 64% |
That 64/36 split reframes what hedge fund returns represent for you as an investor: a minority share of the economic value the strategy creates, not a return on capital in the conventional sense.
What the industry-wide numbers confirm
The NBER findings are not confined to the study window. According to LCH Investments data cited in the Wall Street Journal, hedge funds have produced roughly $3.72 trillion in gross gains since the late 1960s, while keeping around $1.8 trillion of that total in fees, an amount that represents close to half of all gains generated.
This pattern is moving in the wrong direction rather than self-correcting. In the period from 1969 through the early 2000s, fees absorbed around 30% of gross gains. That proportion has climbed to just above 50% over the past two decades. The industry’s growth has amplified the fee problem rather than eroding it.
The long-term cost of fees: a 30-year compounding simulation
The simulation isolates fees as the only variable. Four accounts start with $50,000. Each earns a 10% gross annual return (approximating the S&P 500’s historical average since 1957). The horizon is 30 years. No additional contributions are made. The only difference is the fee each vehicle charges.
Using the S&P 500’s historical gross return as the baseline is a concession in the hedge fund’s favour, given that hedge funds typically pursue strategies quite different from equity index replication. The hedge fund’s net return of approximately 6.75% is derived directly from the NBER-documented 3.44% annual fee cost applied to the 10% gross return.
| Vehicle | Annual fee | Net return used | Terminal balance (30 years) | vs. ETF gap |
|---|---|---|---|---|
| Index ETF | 0.03% | ~9.97% | ~$865,360 | — |
| Index mutual fund | 0.04% | ~9.96% | ~$863,022 | ~$2,338 |
| Actively managed mutual fund | 0.64% | ~9.36% | ~$732,361 | ~$133,000 |
| Hedge fund | ~3.44% | ~6.75% | ~$354,819 | ~$510,541 |
“The hedge fund’s terminal balance is roughly one-third of what the same $50,000 would produce in a low-cost index ETF under identical market conditions.”
The total gap between the best and worst outcome exceeds 10 times the original investment. None of the four accounts received additional contributions, meaning real-world investors who continue adding money annually would see an even wider absolute dollar gap.
A $510,541 gap produced by fees alone, not by market performance differences, tells you that the choice of fee structure is quantitatively more consequential than most active investment decisions you will ever make.
The structural case for index funds vs active management rests on the same arithmetic the simulation above illustrates: fees are a certain, compounding drag, while active outperformance is neither certain nor persistent, and Warren Buffett’s decade-long bet against a professionally selected hedge fund portfolio demonstrated exactly that outcome at scale.
Institutional vs. individual needs: when hedge funds make sense (and when they don’t)
Institutional investors allocate to hedge funds for reasons that are genuinely legitimate within their specific circumstances. Three rationales appear consistently:
- Uncorrelated returns: Equity short-selling, currency positions, and interest rate bets can all produce positive returns in years when stock markets fall, acting as a stabilising counterweight for institutions that face ongoing obligations regardless of what markets are doing.
- Downside protection: Unlike conventional mutual funds, hedge funds face no requirement to maintain full market exposure, which gives capable managers the option to reduce positions before a downturn arrives. In 2008, the S&P 500 fell approximately 38% within a single calendar year; the average hedge fund experienced meaningfully smaller losses.
- Access to specialised asset classes: Strategies built around distressed debt, private credit, or sophisticated derivatives sit outside the regulatory boundaries of standard mutual fund and ETF wrappers, making hedge funds one of the few available routes to that exposure.
Each rationale depends on a specific institutional condition: multi-generational obligations that demand capital preservation across market cycles, annual funding commitments that must be met regardless of drawdowns, and asset bases large enough to absorb liquidity lockups and high minimums.
The 2008 example is the strongest real-world case for institutional use. For a pension fund required to distribute capital annually, limiting a 38% drawdown to a smaller loss has concrete, immediate value. But for an individual with a 30-year horizon and no annual obligation to distribute capital, the calculus is different. You can absorb the drawdown and participate in the recovery, which historically has more than compensated for the decline.
Where the institutional argument breaks down for individual investors
Three mismatches weaken the transfer of institutional logic to individual portfolios. You have time horizon flexibility that most institutions lack. You face no annual distribution obligation forcing you to lock in losses. And diversification into uncorrelated assets is achievable at substantially lower cost through other structures available to retail investors.
The CFA Institute describes hedge funds as a “poor choice for most long-term investors”, citing the high average fee burden and the relatively modest net returns delivered after fees. Post-2009, hedge fund net returns have averaged approximately 6-8% annually, while the S&P 500 has produced average annual returns of approximately 12-14% over the same period.
Predictable fees in an unpredictable market: the power of the expense ratio
No one can reliably forecast future market returns. Expense ratios, by contrast, are legally required to be disclosed and are findable in a single line of a fund prospectus or brokerage platform listing. Unlike returns, which remain unknown until they arrive, a fund’s annual fee can be calculated with certainty across any investment horizon before you commit a single pound.
A high expense ratio is not evidence that a fund is poorly managed. It does mean the manager must outperform by the full fee amount just to match a lower-cost alternative, and that bar applies every single year for the life of the investment. The $133,000 gap between the ETF and the actively managed mutual fund in the simulation demonstrates that fee drag matters well before you reach hedge fund territory, even at a common fee level of 0.64%.
The expense ratio is the one certain number in an investment decision. Future returns are not knowable. Fees are.
Fee quintile success rates across multisector growth funds, where the cheapest quintile achieves an 87% success rate against just 14% for the most expensive, translate the abstract fee-drag arithmetic into a probability statement: a higher fee does not just reduce your terminal balance, it substantially reduces your odds of a successful outcome altogether.
Before committing capital to any high-cost investment product, three questions give you a structured way to evaluate whether the fee is justified:
- What is the exact annual fee, including any performance-based components?
- What has this product historically delivered net of fees versus a low-cost benchmark?
- What specific benefit does this fee purchase for your situation that a lower-cost alternative cannot replicate?
The right question is not “does this fund perform well?” It is “does this fund perform well enough to justify its fee relative to alternatives available to me?”
Beyond exclusivity: evaluating the true value of high-cost investments
High minimums, waitlists, and selective entry processes are commonly read as markers of quality. In investment products, however, they primarily reflect the capital thresholds required to make the fee model commercially viable for the manager. Restricted access is a feature of the business model, not a signal that outcomes for investors will be superior.
The NBER 64/36 split is the clearest empirical answer to who the fee structure serves. Whether gross excess returns are actually being produced is a separate question from who ends up holding them, and the evidence across two decades points consistently toward the manager rather than the investor. According to LCH Investments, fees have consumed just over 50% of gross gains over the past twenty years. The CFA Institute notes that even 1% in extra annual fees can cost nearly a quarter of potential retirement savings over 30 years.
The appropriate response to any high-fee product is not alarm. It is a structured evaluation:
- Assess the net-of-fee return versus a low-cost benchmark over a meaningful time period
- Identify what the fee is specifically purchasing: strategy access, downside protection, uncorrelated exposure, or something else
- Determine whether that specific benefit applies to your situation, your time horizon, and your liquidity needs
Exclusivity signals quality in product markets where scarcity limits supply. In investment management, where any fee is paid from your own returns, the exclusivity premium is a cost you bear without a guaranteed corresponding benefit. Separating the strategy from the access narrative, and then asking whether the net-of-fee return justifies the cost relative to alternatives, is the most durable framework you can apply, to hedge funds and to any high-cost investment product you encounter.
For investors wanting a structured process to apply before committing capital, our dedicated guide to evaluating fund benchmarks provides a five-step due diligence checklist that identifies misaligned fee hurdles in under an hour, covering the specific red flags that headline performance numbers alone will not reveal.
This article is for informational purposes only and should not be considered financial advice. Investors should conduct their own research and consult with financial professionals before making investment decisions. Past performance does not guarantee future results. Financial projections are subject to market conditions and various risk factors.