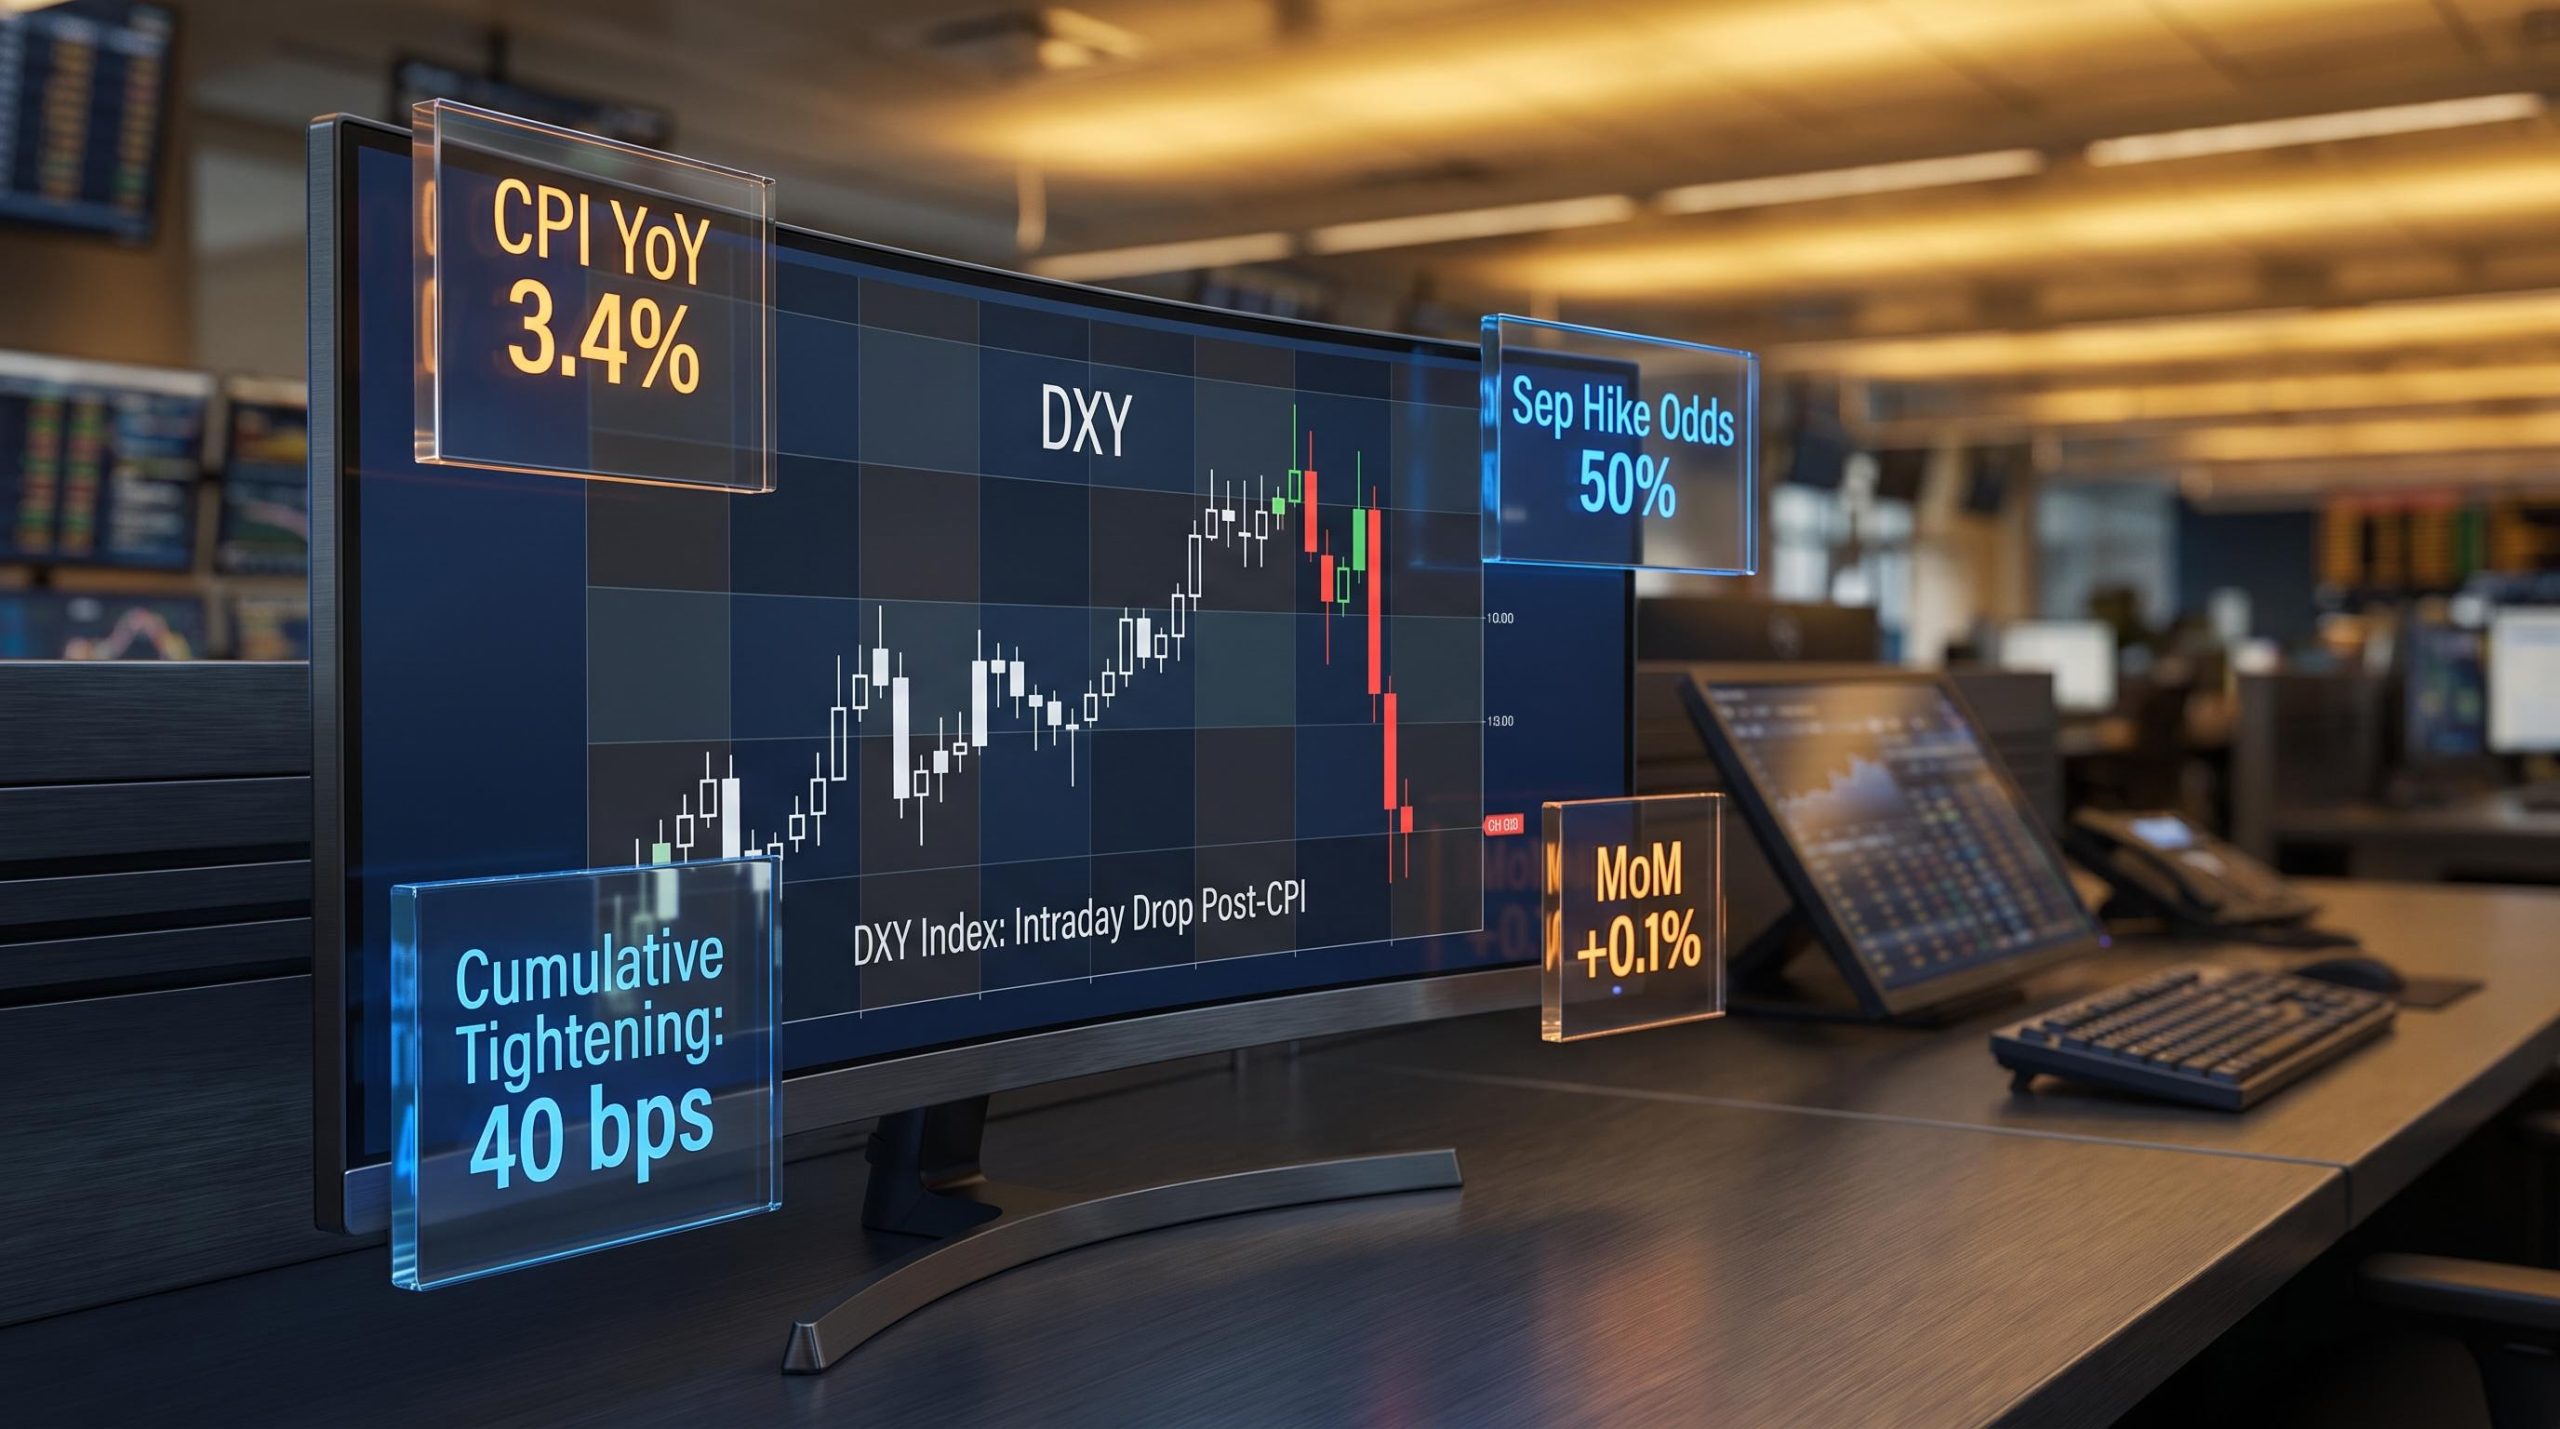
In January 2024, the Consumer Price Index (CPI) came in hotter than the consensus forecast. The textbook response would be a stronger dollar. Instead, the DXY (the US Dollar Index, which measures dollar strength against a basket of major currencies) dropped.
That scenario breaks the most basic assumption most readers hold about how inflation data moves the US dollar. And it happens more often than the simplified version of the relationship suggests.
The standard retail understanding, that hot CPI lifts the dollar and soft CPI weakens it, is correct as a starting point. But it is incomplete in a way that costs traders real money. The gap between that simplified view and how institutional currency desks actually position ahead of CPI releases is where the edge sits. Here is the framework professional analysts use to assess the dollar’s likely directional skew before any CPI release, built from the same inputs you can access for free.
What CPI data actually does to the dollar
The surprise, not the number
Markets do not react to the CPI number itself. They react to the gap between the released figure and the pre-release consensus forecast. A CPI print of 3.5% that was expected at 3.5% moves nothing. The same 3.5% print, expected at 3.2%, moves markets significantly. The consensus estimate, compiled from surveyed economists before each release, is the baseline. Only the deviation from it triggers a repricing event.
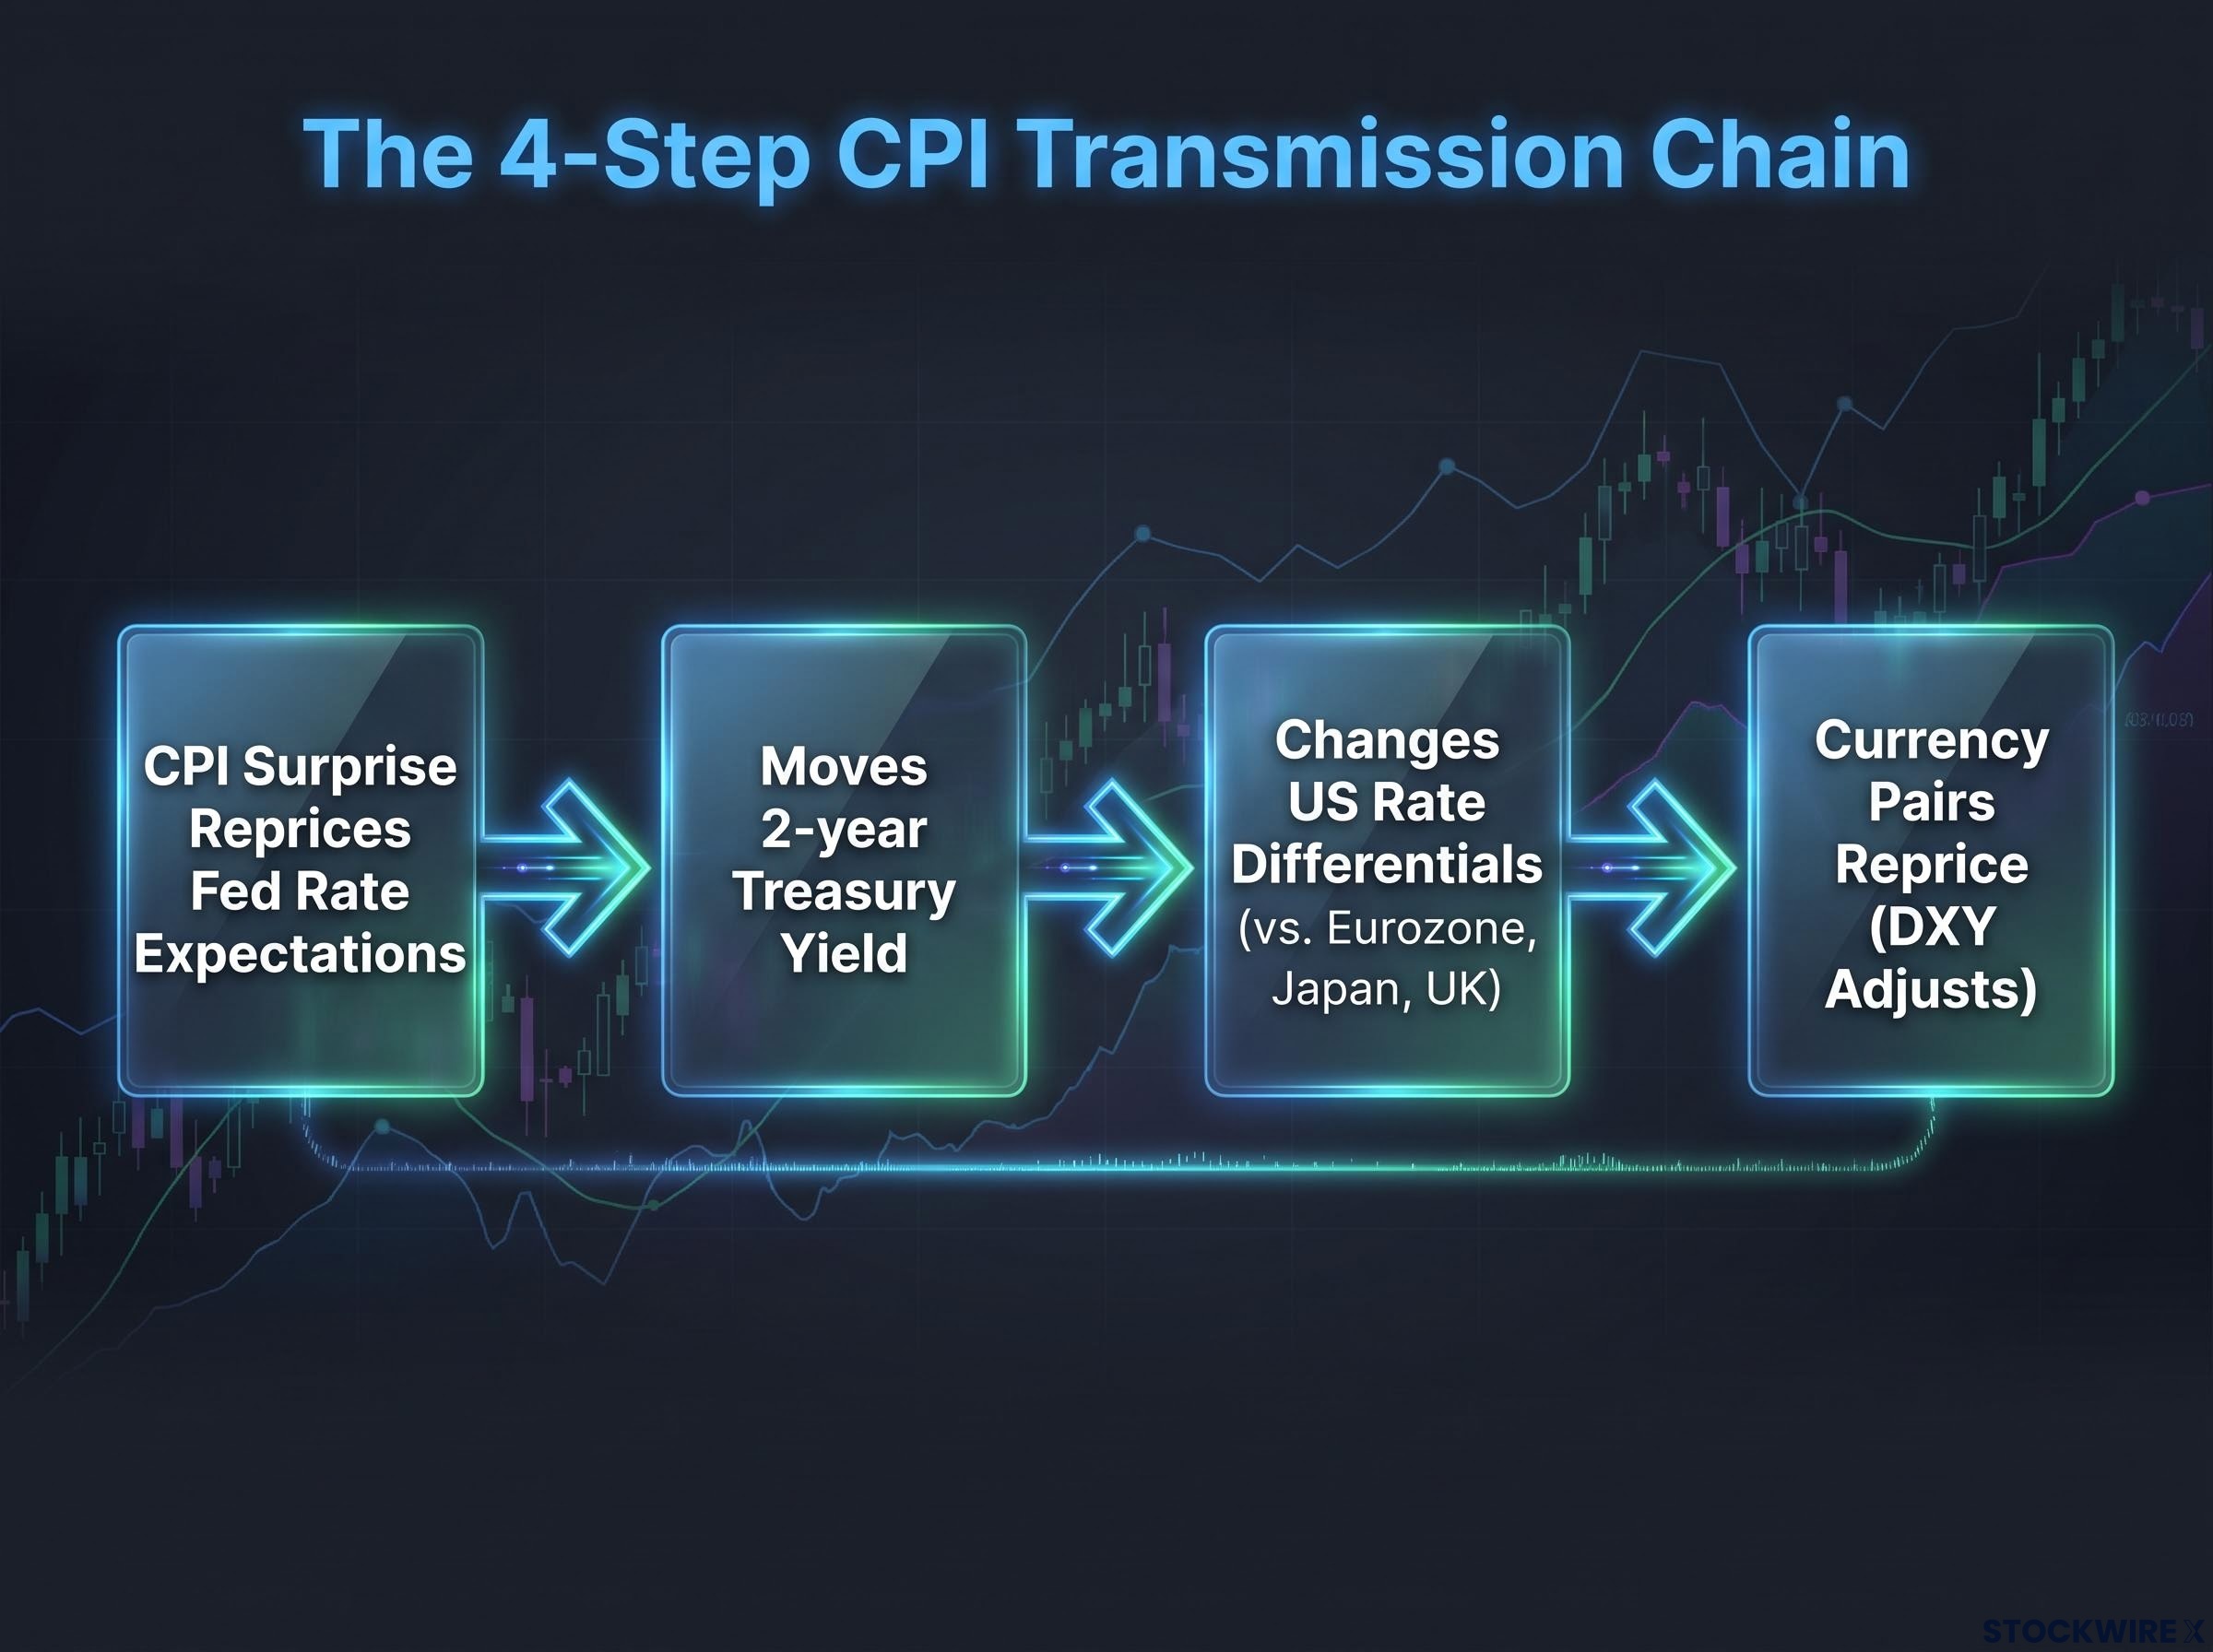
The four-step transmission chain
The CPI surprise feeds into the dollar through a specific sequence, and each step happens within milliseconds via algorithmic trading:
- CPI surprise reprices Fed rate expectations. A hot print raises the probability of further hikes or delays cuts. A soft print does the opposite.
- Fed expectations move the 2-year Treasury yield. The 2-year yield is the most policy-sensitive point on the yield curve, making it the most direct conduit for CPI surprises into financial markets.
- The 2-year yield shift changes US rate differentials. Higher US short-term yields versus the Eurozone, Japan, or the UK make dollar-denominated assets relatively more attractive.
- Currency pairs reprice. The DXY adjusts to reflect the new interest rate differential, with hot surprises lifting both the 2-year yield and the dollar, and soft surprises doing the reverse.
What you are really trading when you trade the dollar around CPI is not inflation itself. It is the market’s instant recalculation of what the Fed will do next. That distinction changes how you read every data release.
The dollar’s reserve currency role, which places it on one side of 89.2% of all global FX trades according to the BIS, is the structural reason why Fed rate decisions transmit so immediately and forcefully into currency pairs around every CPI release.
When big ASX news breaks, our subscribers know first
Why the same CPI surprise does not always produce the same dollar move
Your intuition probably assumes equal and opposite reactions. A 0.2 percentage point upside surprise should produce a dollar rally of roughly the same magnitude as the sell-off from a 0.2 downside surprise. It does not work that way.
Asymmetric risk, in the CPI context, means the dollar’s potential move is larger in one direction than the other for a given surprise size. The direction of the asymmetry depends on where expectations and policy already sit.
When policy is already restrictive and markets have priced a lot of Fed tightening, a 0.2 percentage point downside CPI surprise (soft) can trigger a large USD sell-off. A 0.2 upside surprise (hot) under the same conditions may produce only a muted rally. The repricing room simply is not there on the hawkish side.
The logic is straightforward. If markets have already priced aggressive tightening, there is limited room for further hawkish repricing on a hot print, but plenty of room to unwind on a soft one. The concept of “repricing room” acts as a constraint on how far expectations can shift in either direction.
This tells you not just which direction the dollar is likely to move, but which direction it is capable of moving more. Those two things are not always the same, and that distinction is the insight that separates institutional positioning from retail guesswork.
Voting machine dynamics, where narrative shifts and expectation repricing drive short-run exchange rates far more than underlying fundamentals, are the same force the CPI transmission chain harnesses: the dollar is moving on what markets now believe the Fed will do, not on the inflation number itself.
The neutral rate and what it tells you about which direction carries more risk
The neutral interest rate (sometimes written as r-star) is the theoretical Fed funds rate that neither stimulates nor restrains the economy. It is not directly observable. You cannot look it up on a terminal and get a single number. Estimates typically place it in the 2.5-3.5% range for the US, depending on the model. Professional analysts pick a specific assumed value as their analytical reference point.
The analysis from Brown Brothers Harriman (BBH), attributed to strategist Elias Haddad, used an assumed neutral rate of 3.00% as its reference point for assessing policy restrictiveness around the July CPI release. That number serves as the anchor for a simple but powerful diagnostic.
Three regimes, three different asymmetry profiles
Where the Fed funds rate sits relative to neutral determines which direction carries the larger potential dollar move on a CPI surprise.
| Policy Stance | Hot CPI Dollar Reaction | Soft CPI Dollar Reaction | Asymmetry Direction |
|---|---|---|---|
| Below neutral (accommodative) | Potentially large rally; room to price in more hikes | Muted sell-off; less room to reprice dovishly | USD upside |
| Near neutral | Moderate; Fed could go either way | Moderate; Fed could go either way | Roughly symmetric |
| Above neutral (restrictive) | Muted rally; limited room for further hawkish repricing | Potentially large sell-off; room to accelerate cut expectations | USD downside |
Knowing where the Fed funds rate sits relative to neutral gives you the single most important structural input for assessing the dollar’s directional skew before any CPI release. It tells you how much runway exists for expectations to reprice in each direction.
How rate-hike probability pricing sharpens the asymmetry signal
The neutral rate gives you the structural backdrop. Fed funds futures give you the real-time input. These futures-implied probabilities for upcoming meetings tell you exactly how much hawkish or dovish repricing room exists at any given moment.
The cap-and-floor logic works like this:
- High starting hike probability (70-80%). A hot CPI can only push that probability marginally higher, capping USD upside. A soft CPI has room to pull probabilities sharply lower, creating a larger USD sell-off.
- Low starting hike probability (20-30%). A hot CPI can move probabilities dramatically higher, creating a large USD rally. A soft CPI produces only a muted effect because there is little hawkish positioning to unwind.
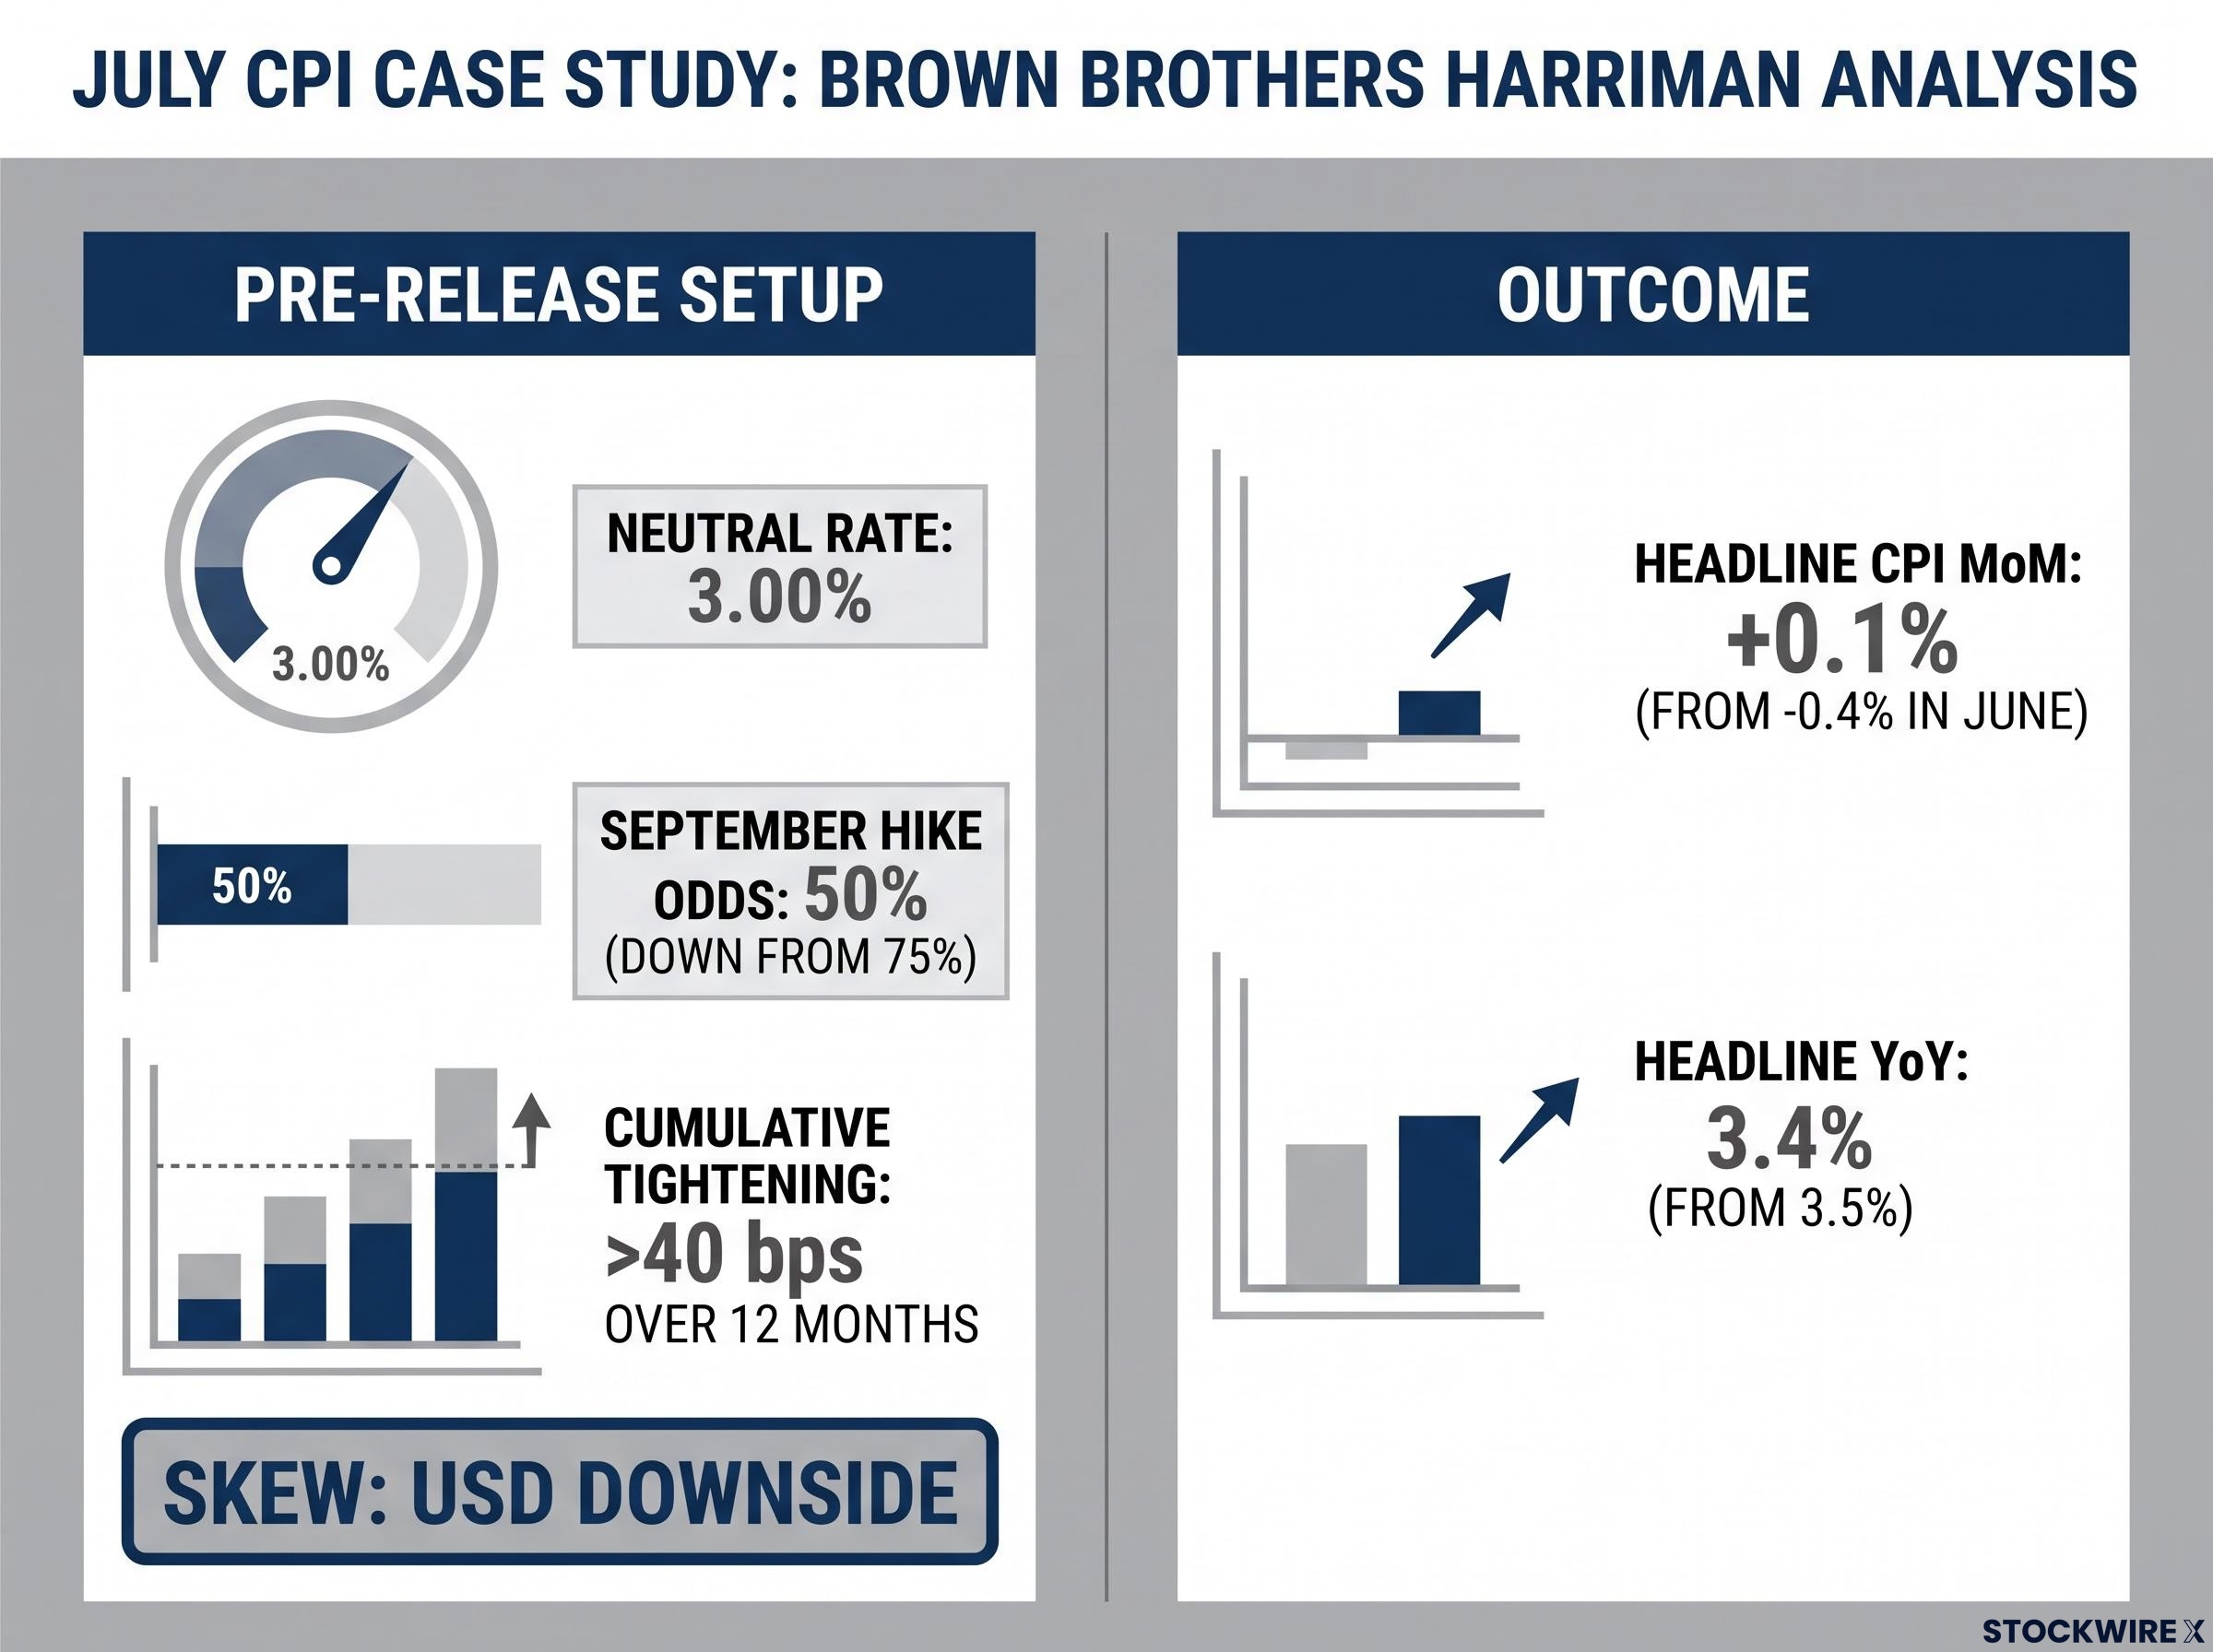
Ahead of the July CPI release, the BBH/Elias Haddad analysis showed that Fed funds futures assigned roughly 50% odds to a September hike, a figure that had retreated from a high of around 75% seen at end-July. Over the subsequent 12 months, cumulative tightening expectations had settled at slightly above 40 basis points.
With hike odds at 50% and falling from 75%, the market was positioned closer to the restrictive end of expectations. That made the soft-CPI scenario more potent for USD than the hot-CPI scenario.
Checking starting hike probabilities before a CPI release is the quickest real-time diagnostic available to any trader. The closer those odds are to 100%, the more capped the dollar’s upside on a hot print, and the more exposed it is on a soft one. Fed funds futures data is publicly available and free, which means you can access the same starting-probability inputs that institutional desks use.
For readers who want to understand how the removal of forward guidance changes the way Fed funds futures probabilities should be interpreted, our full explainer on the end of Fed forward guidance covers what Kevin Warsh’s communication overhaul means for reading rate expectations in real time.
Beyond headline CPI: what professionals actually watch
Institutional analysts treat headline CPI as only one input in a richer inflation signal array. The supplementary measures often determine whether the initial dollar reaction holds or reverses within the same session.
The five key measures watched alongside headline CPI:
- Core CPI (ex-food and energy). Less volatile than headline; often more relevant for policy. Published by the Bureau of Labor Statistics (BLS).
- Super-core (core services ex-shelter). Closely linked to wages and services inflation. Fed officials have explicitly highlighted this measure in recent cycles as the most relevant real-time gauge of domestically generated inflation pressure.
- Trimmed mean CPI. Strips out extreme price moves to focus on the underlying trend. Published by the Federal Reserve Bank of Dallas.
- Median CPI. Identifies the middle price change across all categories, filtering out outliers. Published by the Federal Reserve Bank of Cleveland.
- Sticky-price CPI. Tracks items with prices that change infrequently (rent, insurance), which tend to reflect embedded inflation expectations. Published by the Federal Reserve Bank of Atlanta.
For the July release, the supplementary measures monitored alongside the headline figure included trimmed mean, median, sticky-price, and super-core CPI. The Atlanta and Cleveland Fed variants were due at 11:00am New York, roughly two and a half hours after the main BLS release at 8:30am. Core CPI for July printed at 0.2% month-over-month, recovering from 0.0% in June, while the annual core rate eased to 2.5% from 2.6% the prior month.
The 3-month versus 12-month momentum signal
The single most operationally useful inflation trend input is the divergence between the 3-month annualised change and the 12-month change, for both headline and core CPI. When the 3-month annualised rate falls below the 12-month rate, that signals decelerating momentum (dovish for rates, bearish for USD). When the 3-month rate rises above the 12-month rate, that signals re-acceleration (hawkish for rates, bullish for USD).
If the headline CPI print surprises in one direction but the supplementary measures tell a different story, the initial dollar move is likely to be faded by institutional desks. That means if you only watch headline, you are often reacting to a signal that professionals are about to reverse.
Running the pre-CPI checklist: a six-step framework for any release
Every input in this framework is publicly available and can be assessed the day before a CPI release. Here is the sequence, from the most structural input to the most tactical:
- Locate policy versus neutral. Is the Fed funds rate clearly below, near, or above your neutral rate estimate (typically 2.5-3.5%)? This determines the structural directional skew.
- Check next-meeting hike probabilities via Fed funds futures. Are hikes already priced above 70%, or below 30%? Are cuts priced, and how aggressively?
- Assess cumulative tightening or easing priced over 12 months. A high cumulative-hike profile means more room for dovish repricing than for additional hawkish repricing.
- Check dollar positioning and recent price behaviour. Has USD been strong on the back of prior hawkish data (crowded longs)? Crowded positioning amplifies moves in the direction of the unwind, making this step a critical amplifier of the asymmetry signal identified in steps 1-3.
- Map the asymmetry direction. If policy is restrictive and hike odds are high, skew likely favours USD downside on a soft CPI. If policy is accommodative and hike odds are low, skew likely favours USD upside on a hot CPI.
- Adjust position sizing and risk parameters. Asymmetry informs where the bigger move is likely, not which direction CPI will print. Size your exposure to reflect where reaction potential is largest, not simply which direction you believe inflation will come in.
The July CPI release provides a worked example of the checklist in action:
| Checklist Step | July Market Condition | Implication for USD Asymmetry |
|---|---|---|
| 1. Policy vs. neutral | Fed funds rate above 3.00% neutral (BBH estimate) | Restrictive; structural skew to USD downside |
| 2. Next-meeting hike odds | 50% for September, down from 75% peak | Declining odds limit further hawkish repricing room |
| 3. Cumulative tightening | Just over 40 basis points over 12 months | Elevated; more room to unwind than to add |
| 4. Positioning | Prior hawkish data had supported USD | Crowded positioning amplifies any dovish unwind |
| 5. Asymmetry direction | Restrictive policy + high starting odds | Skew tilted to USD downside (BBH assessment) |
| 6. Sizing | Larger potential move on soft print | Adjust risk to reflect downside USD exposure |
When the July CPI figures were released, they bore out the pre-release skew assessment: headline CPI rose 0.1% month-over-month, recovering from a 0.4% decline in June, while the year-on-year reading slipped to 3.4% from 3.5%. The data pointed to only a gentle firming in price pressures, well short of any signal that inflation was picking up pace again. That outcome was consistent with BBH’s pre-release view, attributable to Elias Haddad, that the balance of risks pointed toward USD weakness rather than strength.
Working through this checklist before each CPI release converts the event from a binary coin-flip into a structured risk assessment where you know in advance which outcome carries the larger market reaction, and you can size your exposure accordingly.
This article is for informational purposes only and should not be considered financial advice. Investors should conduct their own research and consult with financial professionals before making investment decisions. Past performance does not guarantee future results. Financial projections are subject to market conditions and various risk factors.
What this framework changes about how you read the next CPI release
The framework installs three analytical shifts that apply to every future CPI release:
- From raw number to consensus surprise. You stop reacting to the CPI level and start measuring the deviation from the pre-release forecast, which is the only thing that triggers a repricing event.
- From symmetric assumption to asymmetry assessment. You stop assuming equal reactions to equal surprises and start checking where policy, hike probabilities, and positioning already sit to determine which direction carries the larger potential move.
- From single-number watching to multi-measure signal reading. You stop treating headline CPI as the entire signal and start monitoring core, super-core, trimmed mean, and the 3-month versus 12-month momentum divergence to assess whether the initial dollar reaction will hold or reverse.
The rate differential pillar driving the DXY’s mid-2026 recovery illustrates the transmission chain in practice: the June FOMC’s hawkish dot plot repriced cut timelines before a single underlying inflation figure had changed, producing a multi-week dollar rally on pure expectation revision.
The most common retail error is trading CPI outcomes as if reactions are symmetric and the standard hot-up, soft-down rule is sufficient, without checking where expectations already sit. That error is correctable with inputs that are entirely free and publicly available. Fed funds futures, published CPI sub-measures, and public Fed commentary on neutral rate estimates can all be assessed the day before any release, giving you time to calibrate your view without needing to react in real time.
These statements are speculative and subject to change based on market developments and company performance.