In 2008, Warren Buffett made a $1 million bet that a simple S&P 500 index fund would outperform a hand-picked portfolio of hedge funds over a decade. He won by a margin that stunned even seasoned investors. The wager has since become the most cited real-world demonstration of a thesis that decades of data have only reinforced: when it comes to index funds versus active management, passive investing holds a structural advantage that skill alone cannot reliably overcome.
The debate between the two approaches is one of the most consequential decisions a long-term investor faces. Yet it is often misunderstood as a question of talent versus laziness, rather than what the evidence reveals it to be: a cost-driven, behavioural, and statistical problem that the vast majority of professional fund managers have not solved. What follows is a guide to why passive investing wins over the long run, what the psychology of markets reveals about professional underperformance, what the data through 2025 shows, and how retail investors can apply these findings to their own portfolios.
What index funds and active management actually mean for your money
The distinction between passive and active investing is not about effort or intelligence. It is about structure. The two approaches generate returns through fundamentally different mechanisms, and understanding those mechanics is a prerequisite for evaluating the performance evidence that follows.
How index funds generate returns
An index fund tracks a market benchmark, such as the S&P 500, by holding all (or a representative sample) of its constituent companies. Returns are generated through market-capitalisation weighting, which means larger companies receive a proportionally larger share of the fund’s capital. The fund rebalances automatically as the index composition changes.
The investor receives the market’s return, minus a small management fee. There is no stock selection, no market timing, and no manager judgment involved.
The structural difference between stocks vs ETFs extends beyond ownership mechanics: a single broad market ETF share distributes capital across hundreds of companies simultaneously, which directly neutralises the concentration risk that makes individual stock selection so difficult to execute consistently.
How active funds generate returns
An actively managed fund employs a manager (or team) who applies research, analysis, and judgment to select securities expected to outperform the benchmark. The primary tools are security selection, market timing, and sector rotation.
Outperformance requires the manager to be right more often than the market has already priced in, a bar that rises as markets become more efficient and information travels faster.
The core tension between the two approaches comes down to a single question: can the costs and selection errors inherent in active management be reliably offset by outperformance? More than 20 years of SPIVA scorecard data, maintained by S&P Dow Jones Indices (SPDJI), provide the most comprehensive longitudinal answer available.
- Index funds: Returns mirror the benchmark; fees are low; no manager discretion; performance is tied to overall market movement
- Active funds: Returns depend on manager skill; fees are materially higher; manager discretion drives allocation; performance is measured against (and must exceed) the benchmark
When big ASX news breaks, our subscribers know first
The psychology behind why markets are harder to beat than they look
If markets simply reflected the underlying value of companies, beating them would be a question of doing better research. The reality is less comfortable.
Economist John Maynard Keynes proposed a framework that reframes the challenge entirely. He compared investing to a newspaper beauty contest in which readers were asked to pick the face they thought other readers would find most attractive, not the one they personally preferred.
“The winner is not the person who picks the most beautiful face, but the person who best anticipates what the crowd will call beautiful.”
Applied to financial markets, the implication is that stock prices are not set by independent fundamental assessment. They are set by expectations about what other participants expect. This creates a self-referential loop that even highly skilled managers struggle to exploit consistently.
Robert Shiller extended this behavioural insight into formal market analysis, reinforcing that crowd psychology routinely overrides company fundamentals in setting prices. The dot-com era offered the most vivid illustration. The dominant narrative of the 1990s held that internet companies would achieve total market dominance, a premise that led investors to accept the idea that profitability was unnecessary. Approximately 300,000 technology sector jobs were eliminated when the bubble collapsed.
Some companies, notably Amazon and Google, ultimately validated long-term growth expectations. The broader class of dot-com casualties did not. No reliable method existed at the time for calibrating which valuations were appropriate during the narrative-driven run-up.
- Fundamental investing logic: Value is anchored to company performance, cash flows, and earnings
- Keynesian market logic: Value is anchored to crowd expectations about what other investors will do next
This distinction matters because it shifts the question from “are fund managers smart enough?” to “is the game itself beatable at scale?” The SPIVA data suggests the answer, for the vast majority, is no.
Buffett’s million-dollar bet and what it proved
The bet was straightforward. In 2008, Buffett wagered $1 million that a Vanguard S&P 500 index fund would outperform a portfolio of hedge funds selected by asset management firm Protégé Partners over 10 years. Protégé had full professional discretion over which funds to include, a structure designed to eliminate any argument about selection bias.
By 2017, the index fund had won decisively. The S&P 500 fund compounded annual returns well ahead of the hedge fund basket across the full decade.
The result was not a surprise to Buffett. His public position, repeated across decades of Berkshire Hathaway shareholder letters, has been consistent: the majority of investors are better served by low-cost index funds than by paying active management fees. At the time of a widely referenced April 2020 interview, Buffett’s net worth stood at approximately $67.5 billion, lending practitioner credibility to a thesis he has maintained for most of his career.
Buffett’s position, stated repeatedly, is that most investors would achieve better long-term outcomes by holding a low-cost S&P 500 index fund than by paying active managers to try to beat it.
| Participant | Strategy | Period | Outcome |
|---|---|---|---|
| Warren Buffett | S&P 500 index fund (passive) | 2008-2017 | Won decisively |
| Protégé Partners | Portfolio of hedge funds (active) | 2008-2017 | Underperformed |
The bet functions as a controlled real-world experiment. It had high stakes, a named adversary with professional selection authority, and a clear outcome. But a single bet, however persuasive, is still a sample size of one. The statistical case requires a broader dataset.
What 20 years of performance data actually shows
The SPIVA scorecards, produced by S&P Dow Jones Indices, represent the most comprehensive longitudinal study of active versus passive performance available. Spanning more than 20 years of data across global markets, the findings present a pattern that sharpens as the time horizon lengthens.
Start with the short term. In the one-year period ending December 2025, 79% of active large-cap U.S. equity funds underperformed the S&P 500, according to the SPIVA U.S. Year-End 2025 scorecard. The S&P 500 returned approximately 18% in 2025, creating what SPDJI described as “a high hurdle to beat.”
The SPIVA U.S. Year-End 2025 scorecard, published by S&P Dow Jones Indices, documents consistent underperformance across 11 regions and multiple asset classes, reinforcing that the pattern observed in U.S. large-cap funds is not an isolated result but a global structural finding.
That 79% figure may leave room for optimism: roughly one in five active managers did outperform over a single year. The question is whether those same managers sustain it.
What the data looks like over 10 years
The Indian ELSS fund data from the SPIVA India Year-End 2025 scorecard provides a detailed multi-horizon view that illustrates how the pattern accumulates.
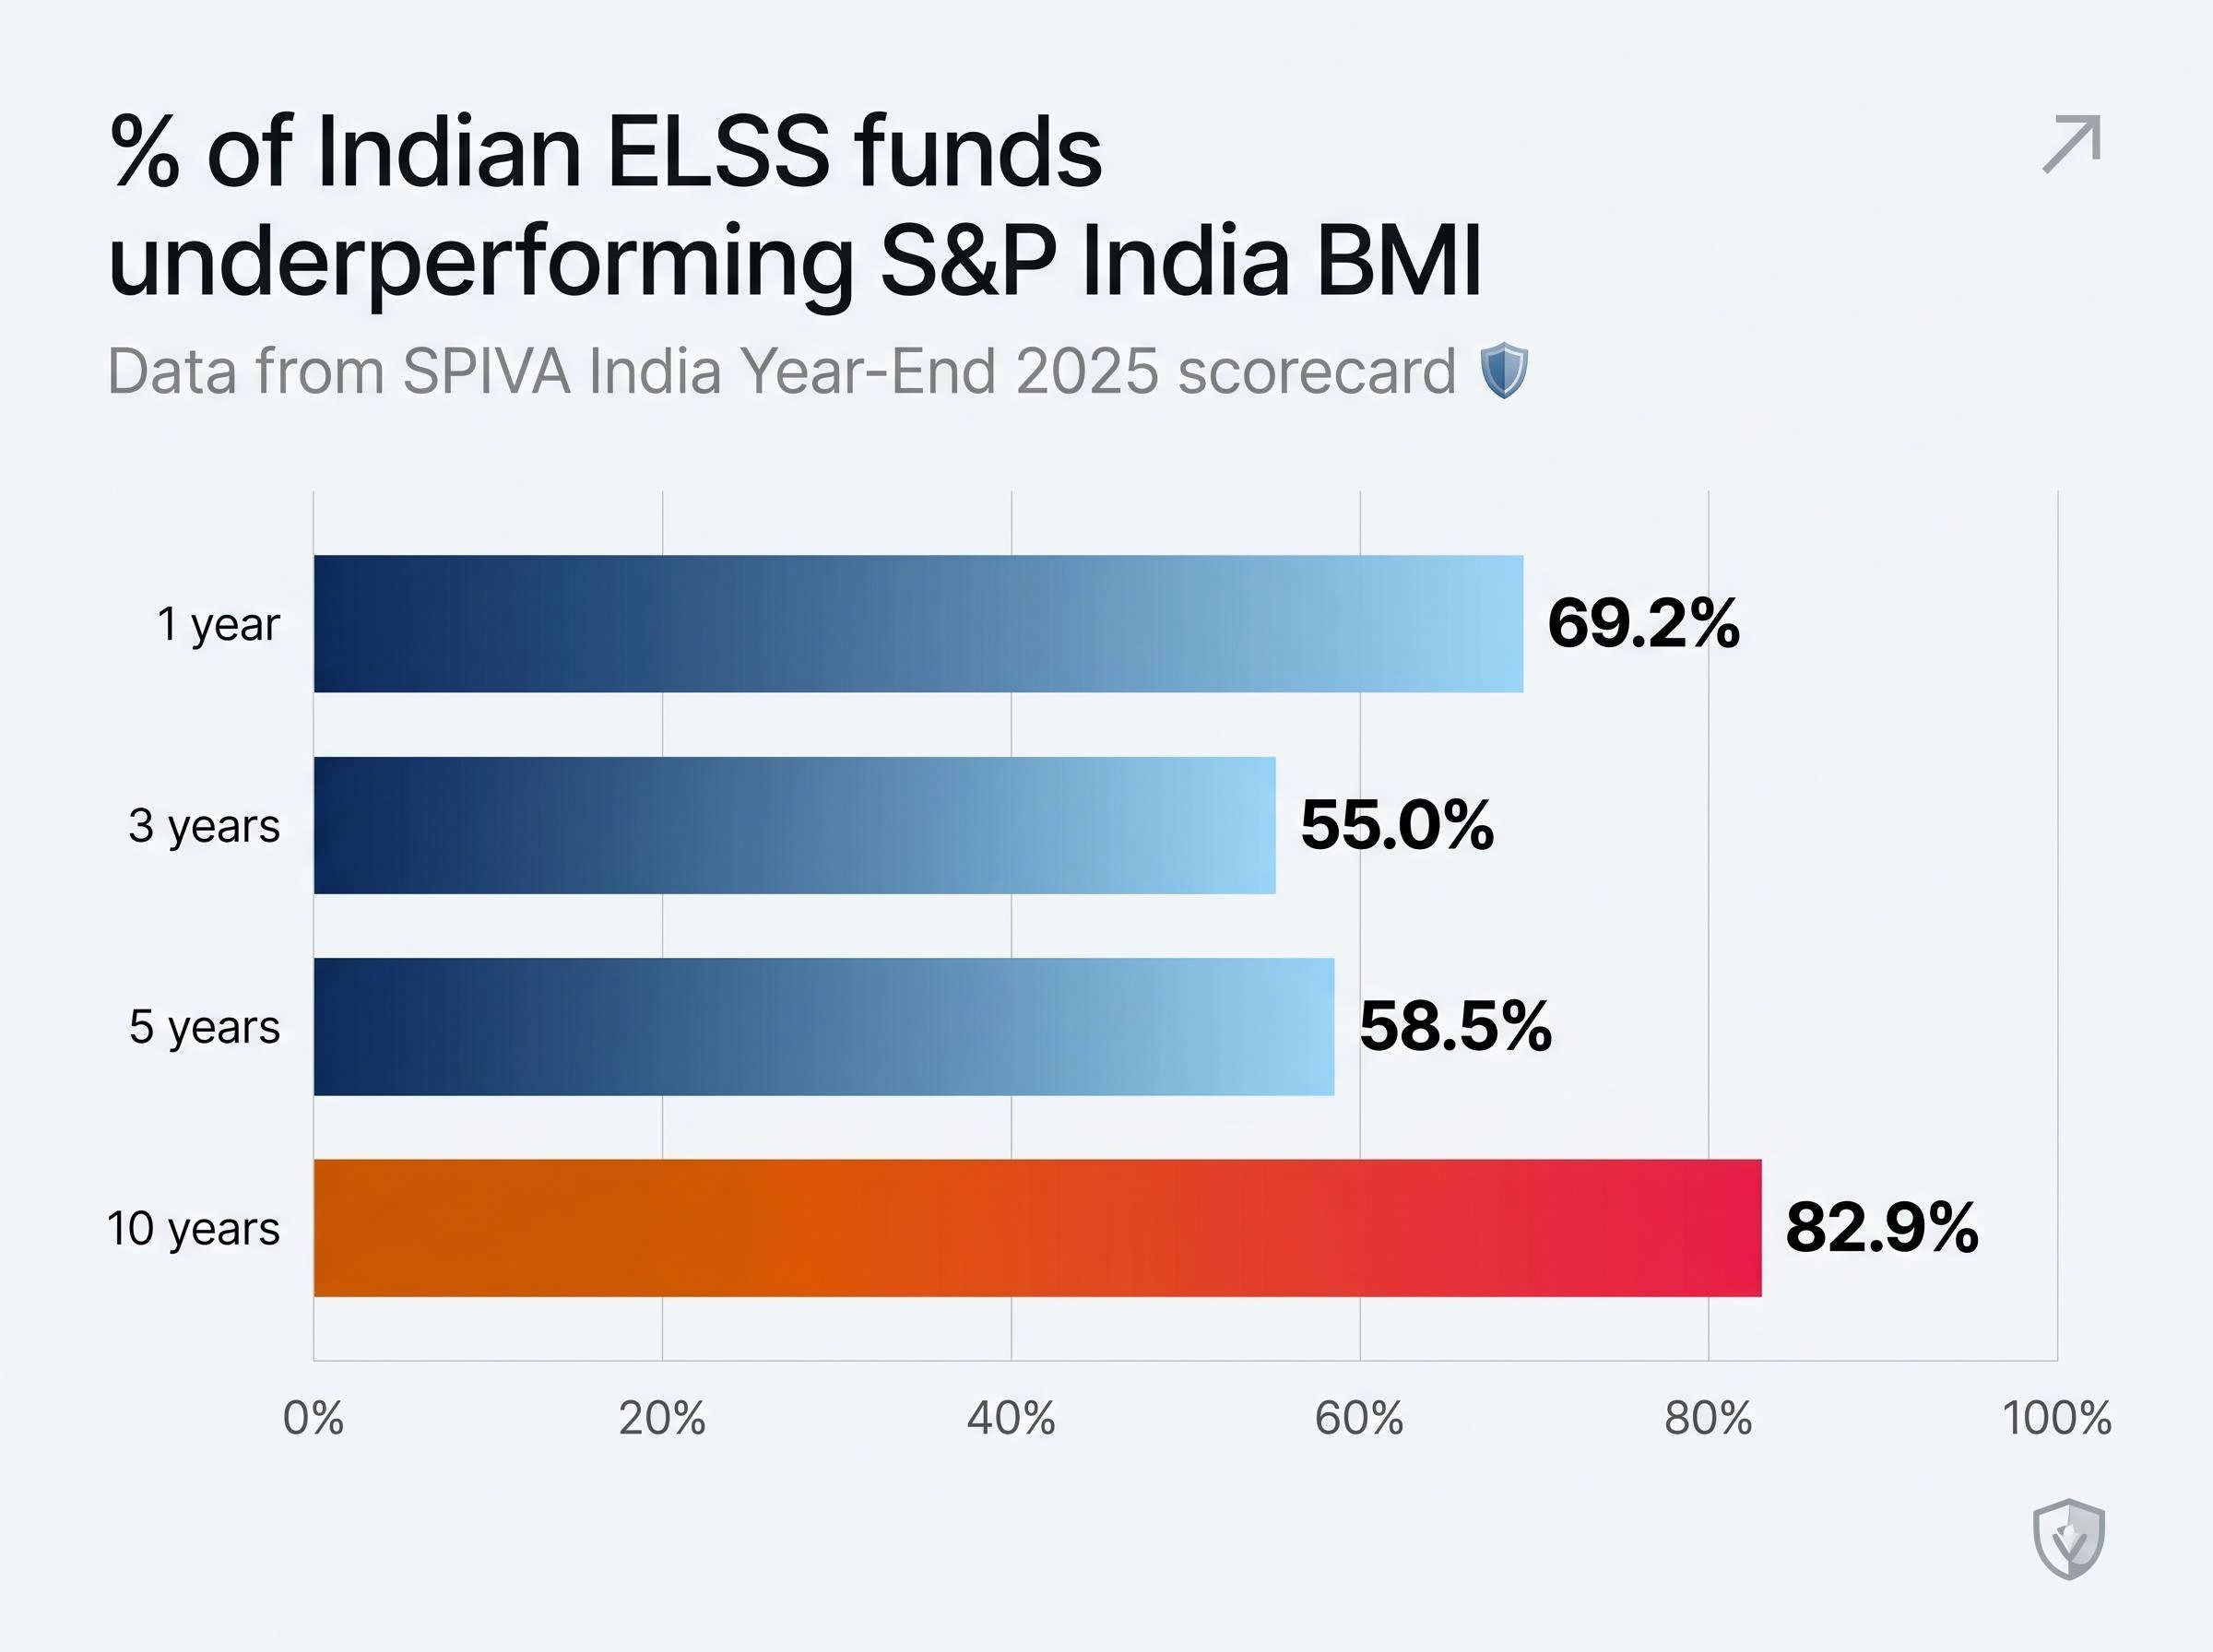
| Time period | % of Indian ELSS funds underperforming S&P India BMI |
|---|---|
| 1 year | 69.2% |
| 3 years | 55.0% |
| 5 years | 58.5% |
| 10 years | 82.9% |
At the one-year mark, roughly 69% underperformed. At 10 years, the figure reached 82.9%. SPDJI has stated that the underperformance tendency “typically rises as the observation period lengthens.” Short-term active outperformance does occur, but persistence, defined as the same manager outperforming consistently across multiple periods, is rare.
According to S&P Dow Jones Indices, summarising more than 20 years of SPIVA data: “most institutional managers underperform most of the time.”
SPDJI describes these conclusions as “robust across geographies,” with similar patterns documented across the U.S., Europe, Asia, and Latin America. The Indian data is not an outlier. It is a representative case study within a global pattern.
The cost problem that most investors underestimate
Even if an active manager possesses genuine stock-picking ability, the arithmetic of fees works against them. An expense ratio is the annual percentage fee deducted from a fund’s assets. It compounds against the investor every year, and over long horizons, the effect is larger than most investors expect.
Active funds charge materially higher fees than passive index funds. This is not an outlier characteristic of poorly managed funds; it is a structural property of the category. Both the BetaShares 2024 SPIVA review and the Evidence-Based Investor’s SPIVA analysis identify cost as a primary reason why active funds underperform over time.
Fee quintile success rates reveal the relationship between cost and outcome with unusual precision: Morningstar data shows cheapest-quintile multisector growth funds achieving an 87% success rate compared to just 14% for the most expensive quintile, a roughly six-fold difference that turns fee selection from a marginal consideration into the single most consequential decision a fund investor makes.
Here is how fee compounding works in practice:
- A fund generates a gross return before fees (assume 7% annually)
- The fund’s expense ratio is deducted each year (0.1% for a typical index fund, 1.2% for a typical active fund)
- The net return compounds over time (6.9% for passive, 5.8% for active)
- Over 30 years, the gap between those net returns produces a substantial difference in terminal value
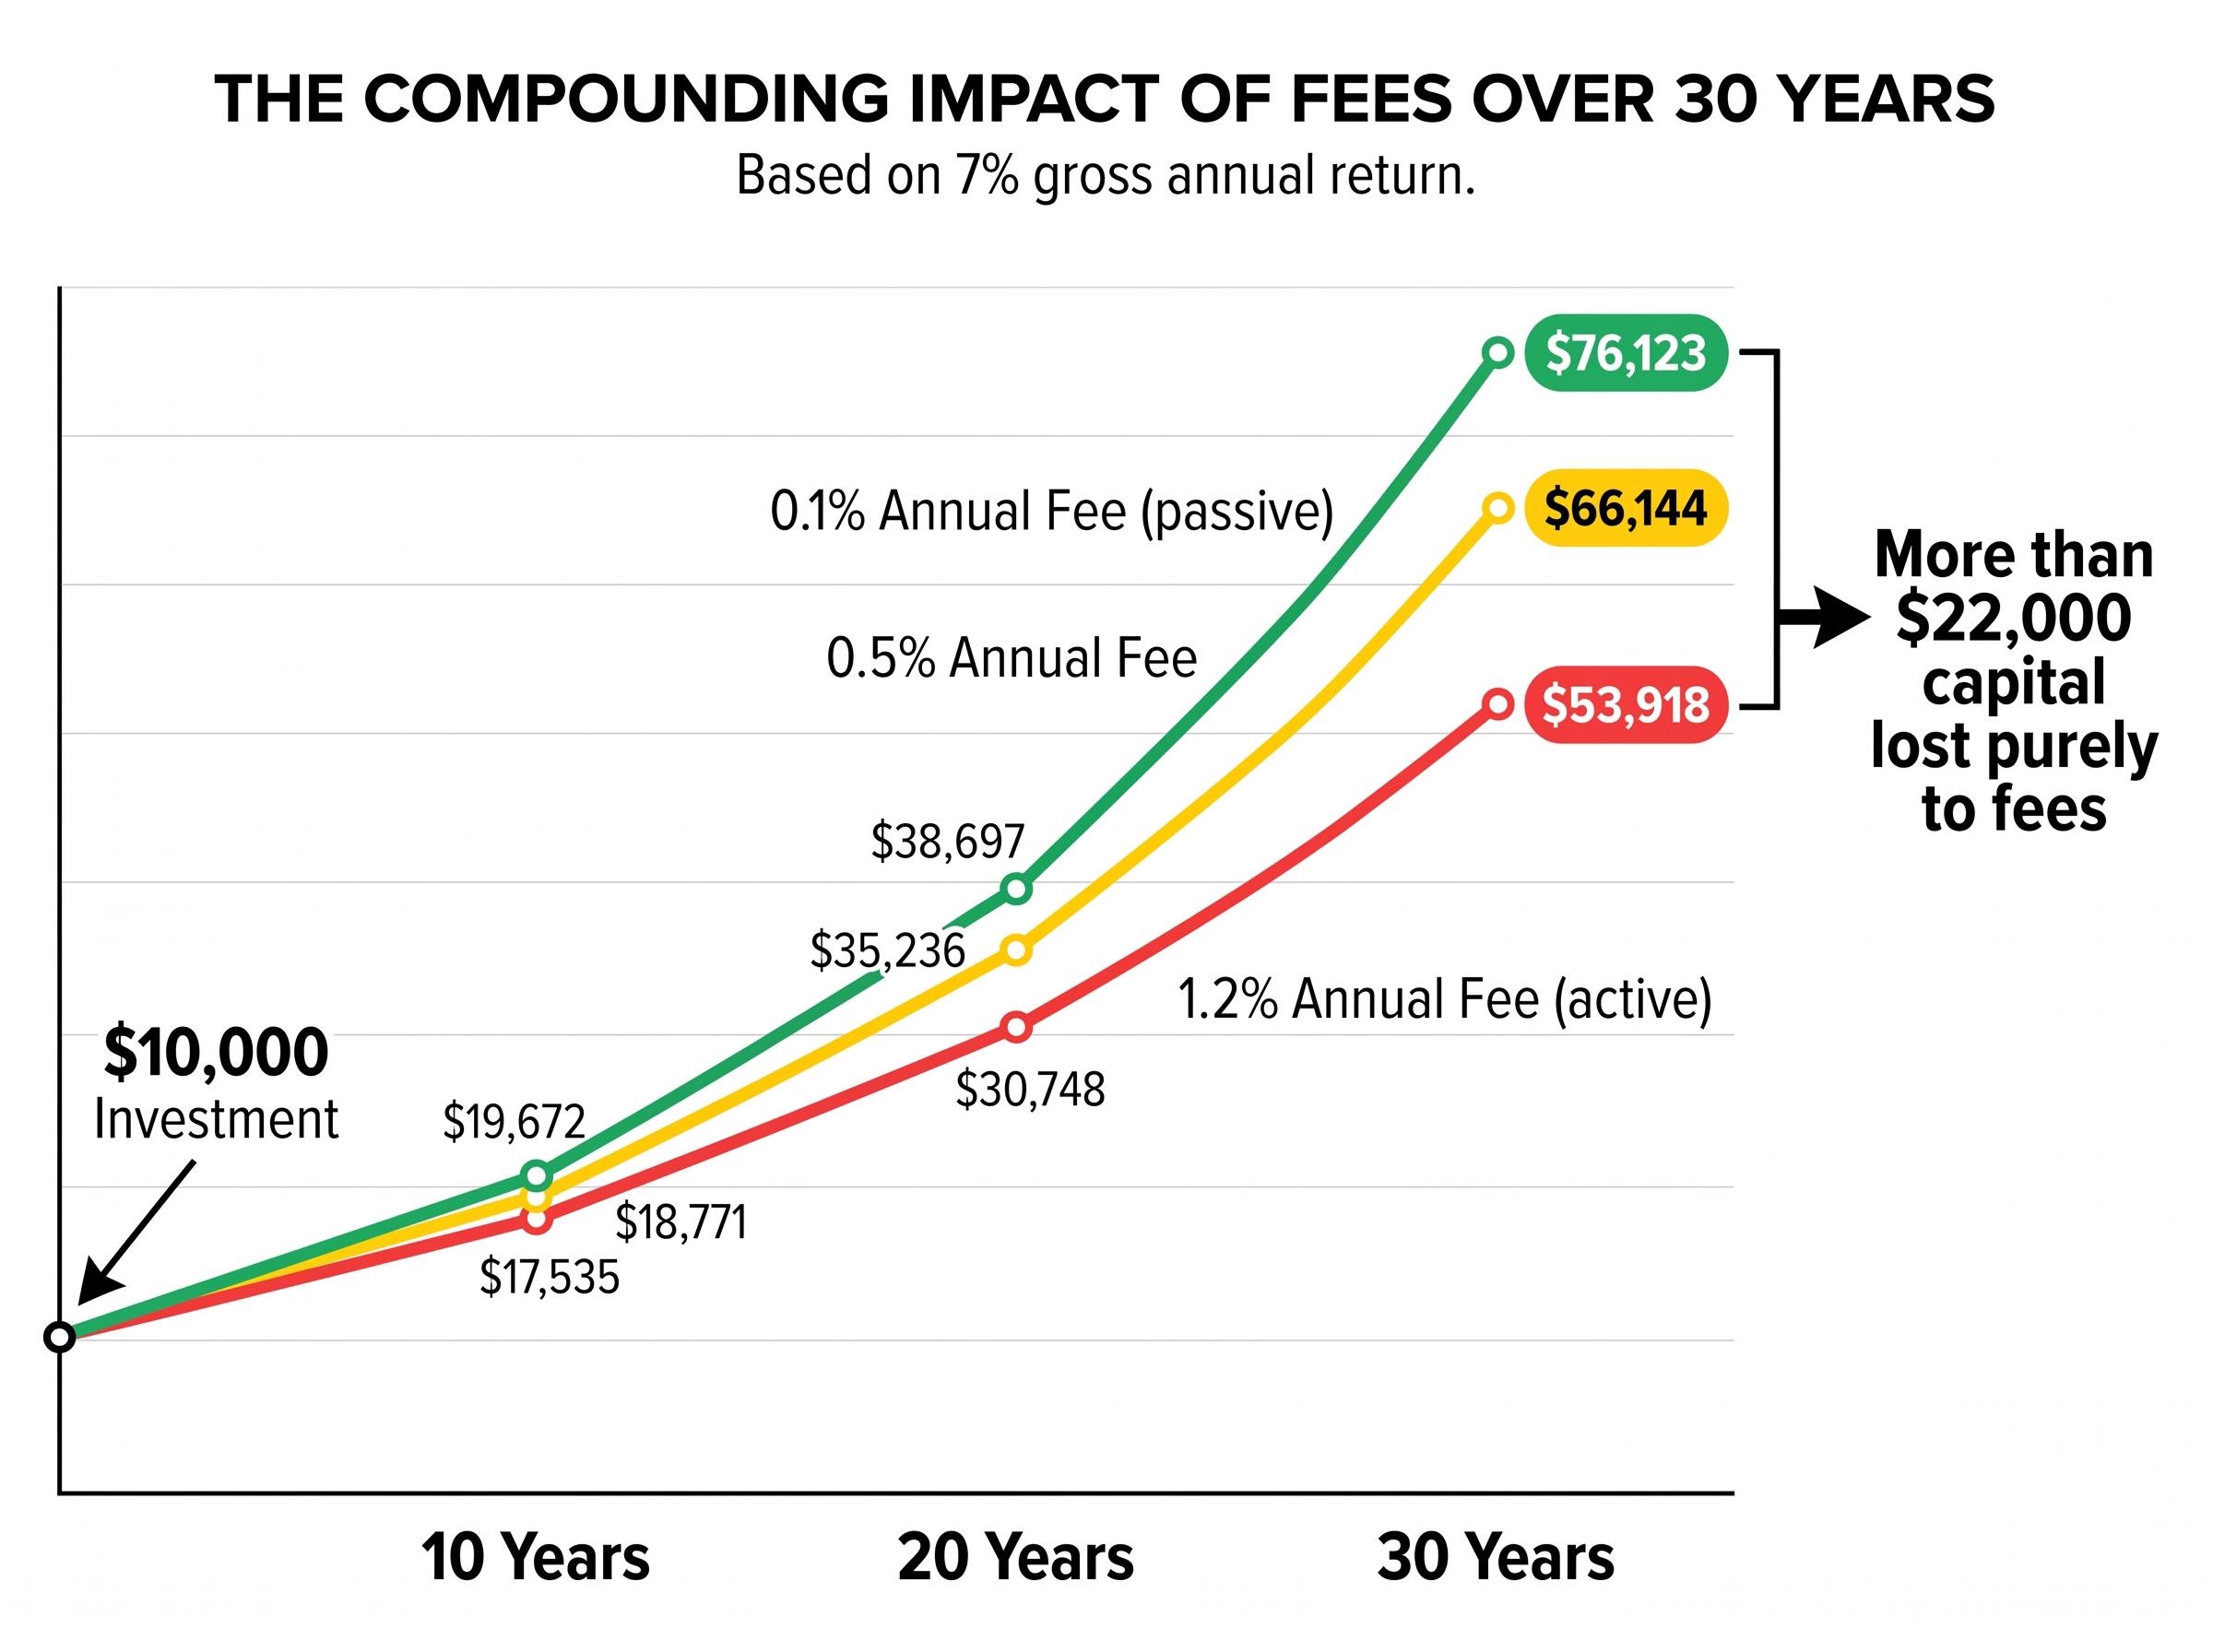
| Annual fee | Value after 10 years | Value after 20 years | Value after 30 years |
|---|---|---|---|
| 0.1% (passive) | $19,672 | $38,697 | $76,123 |
| 0.5% | $18,771 | $35,236 | $66,144 |
| 1.2% (active) | $17,535 | $30,748 | $53,918 |
A $10,000 investment at 7% gross return over 30 years produces approximately $76,123 at a 0.1% fee, compared to approximately $53,918 at a 1.2% fee. The difference of more than $22,000 represents capital lost purely to fees, not to poor market conditions or bad timing. The active manager must not merely match the market; they must beat it by enough to cover that fee drag, every year, for decades.
This is an article for informational purposes only and should not be considered financial advice. Investors should conduct their own research and consult with financial professionals before making investment decisions. Past performance does not guarantee future results.
How to apply these lessons to your own investment decisions
The evidence favours passive investing over long horizons. Applying that evidence requires a practical framework, not a blanket endorsement.
Active management may have a legitimate role in specific circumstances:
- Illiquid or niche asset classes where no index fund exists to provide exposure
- Tax-loss harvesting strategies that require individual security selection
- Managed accounts with constraints specific to the investor’s circumstances (such as ethical exclusions or concentrated position management)
For most retail investors, however, the decision framework is straightforward:
- Define the time horizon. The passive case is strongest over 10 years or more, consistent with both the SPIVA evidence and the structure of Buffett’s bet.
- Assess the fees. Compare the expense ratios of current or prospective funds. A difference of even 0.5% annually compounds into a material gap over decades.
- Determine whether an index fund covering the target market exists. For broad equity exposure (U.S., global, emerging markets), low-cost index products are widely available.
- Default to passive unless specific circumstances justify active. The burden of proof, based on the data, sits with active management to demonstrate why the cost and performance disadvantages do not apply in a given case.
Index concentration risk has become a structural qualifier on the passive case: when five mega-cap stocks control approximately 23% of the broad US market index, the investor who holds a cap-weighted S&P 500 fund is not neutrally exposed to the market but is substantially exposed to the earnings and valuation trajectories of a handful of technology companies.
ETF fees are a more reliable predictor of long-term relative returns than past performance, fund size, or star ratings, according to Morningstar research, which is why the fee comparison step belongs at the beginning of fund selection rather than at the end as a tiebreaker.
Buffett’s public position remains that most investors would achieve better outcomes in low-cost index funds. The SPIVA data, extending across more than 20 years and multiple geographies, supports that view with statistical weight.
The bet Buffett made is one any long-term investor can replicate
Three findings converge. Markets are harder to beat than skill alone can explain, because price-setting is a crowd-psychology problem, not purely a valuation problem. The historical data confirms that active management underperforms over long horizons, with underperformance rates rising as the observation period lengthens. And costs compound the disadvantage structurally, turning even small fee differences into large terminal value gaps.
For retail investors, consistent access to index funds at low cost is itself a form of investment edge. It sidesteps the compounding fee drag and the selection errors that the majority of professional managers have not been able to overcome across more than two decades of measurement.
The evidence base has only strengthened. The structural reasons for active underperformance, costs, psychology, and the Keynesian nature of price-setting, have not changed.
Buffett’s thesis, distilled: a low-cost index fund, held with discipline over decades, will outperform the vast majority of professionally managed alternatives. The data, through 2025, continues to agree.