A fund delivering 10% annual returns sounds impressive. But if the portfolio carries equity-like credit risk and the manager charges a performance fee measured against a consumer price index benchmark, that bonus may reward risk-bearing rather than skill. Performance fees are marketed as an alignment mechanism, ensuring managers earn extra only when they deliver genuine value. In practice, the investment benchmark chosen to trigger those fees does most of the work. For Australian investors evaluating managed funds, private debt vehicles, and alternative strategies, the benchmark is not a footnote buried in disclosure documents. It is the mechanism that determines whether extra fees are earned or simply extracted. This explainer walks through how benchmarks interact with fee structures, why the choice of benchmark matters more than most investors realise, how to identify when a benchmark is misaligned with a fund’s actual risk profile, and what questions to ask before committing capital.
What an investment benchmark actually does (and what it is supposed to do)
Most investors encounter benchmarks as scoreboards: the fund returned X%, the benchmark returned Y%, and the difference is the manager’s value-add. That framing is incomplete. A benchmark is a contractual trigger embedded in the Product Disclosure Statement (PDS) with direct financial consequences for both manager and investor.
A benchmark performs three distinct functions:
- It defines the performance hurdle a manager must clear before performance fees are triggered
- It communicates the fund’s risk reference point to investors
- It shapes how the manager allocates capital in pursuit of outperformance
A fair benchmark should reflect the risk profile of the strategy. Investors should only pay extra when returns exceed what the market would have delivered for the same level of risk. The benchmark selection is made by the manager, documented in the PDS, and rarely renegotiated once the fund launches.
The regulatory gap Australian investors should know about
ASIC’s Regulatory Guide 97 (RG 97) governs how performance fees must be disclosed in PDSs and periodic statements, but it does not prescribe which benchmark a manager must use. No Australian regulation currently requires alignment between a fund’s strategy risk and its performance fee hurdle.
ASIC’s RG 97 disclosure requirements mandate that a fund’s PDS specify how performance fees are calculated, including the benchmark used, but the guide stops short of requiring that benchmark to reflect the strategy’s actual risk profile.
The gap is instructive when compared with ASIC’s approach to sustainability claims. ASIC Information Sheet 271 (updated March 2026) warns that cherry-picking easy metrics to claim outperformance in a sustainability context is misleading. No equivalent rule applies to benchmark selection for performance fees.
Treasury’s ongoing review of the managed investment scheme (MIS) regulatory framework has flagged complex fee structures as a consumer protection concern, but no in-force benchmark-alignment rule has resulted as of May 2026.
When big ASX news breaks, our subscribers know first
The mechanics of benchmark misalignment: how a low hurdle inflates apparent performance
Consider a private credit fund that lends to property developers, finances construction projects, and holds subordinated loan positions. The portfolio carries meaningful credit risk, illiquidity risk, and concentration risk. Now consider its performance fee benchmark: the RBA cash rate plus 4-5% per annum.
The fund delivers 10% annual returns. Against a cash-plus benchmark, that looks like clear outperformance. The manager collects a performance fee on the spread.
The question is what happens when that same 10% return is measured against a benchmark reflecting the risk the investor actually bears. A diversified corporate bond index or a blended credit spread benchmark would set a higher hurdle, because it prices in the credit risk inherent to the strategy. Against that comparator, the same 10% return may represent no outperformance at all.
The mechanism is straightforward. When a high-risk strategy is benchmarked against a low-volatility reference, outperformance becomes structurally easier to achieve. The gap between the fund’s return and the benchmark captures the risk premium an investor would earn by simply taking on that level of risk, not the excess return produced by manager skill.
Outperformance measured against a low-risk benchmark captures the risk premium an investor would earn by simply bearing that risk. It does not isolate the excess return produced by manager skill.
For a benchmark to be fair, three conditions must all hold:
- The benchmark reflects equivalent credit or market risk to the strategy
- The benchmark is publicly observable and not subject to manipulation
- Outperformance above it cannot be achieved simply by increasing portfolio risk without demonstrating skill
When any of these conditions fails, the performance fee compensates risk-bearing, not active management.
Inside the numbers: how performance fees compound into significant return drag
A single year’s performance fee may appear modest. The compounding effect over a decade is not.
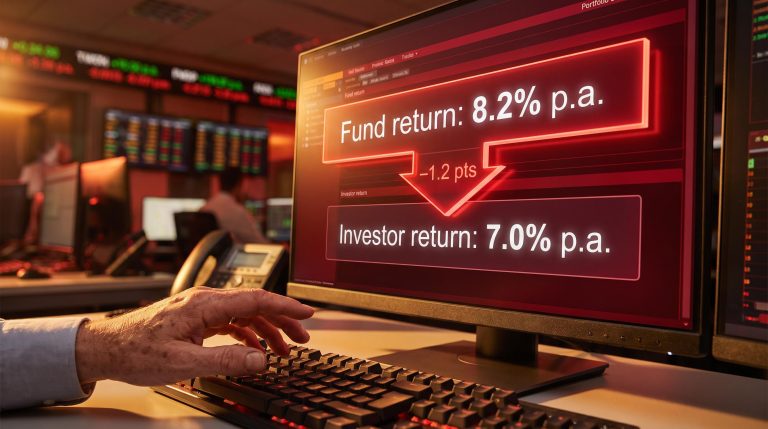
Consider a fund with a 1% base management fee and a 15% performance fee above a 5% benchmark hurdle. The fund delivers 10% gross returns. The performance fee is 15% of the 5% excess, adding approximately 0.75% annually on top of the base fee. Total annual fee drag reaches approximately 1.75%. The investor’s net return falls to roughly 8.25%.
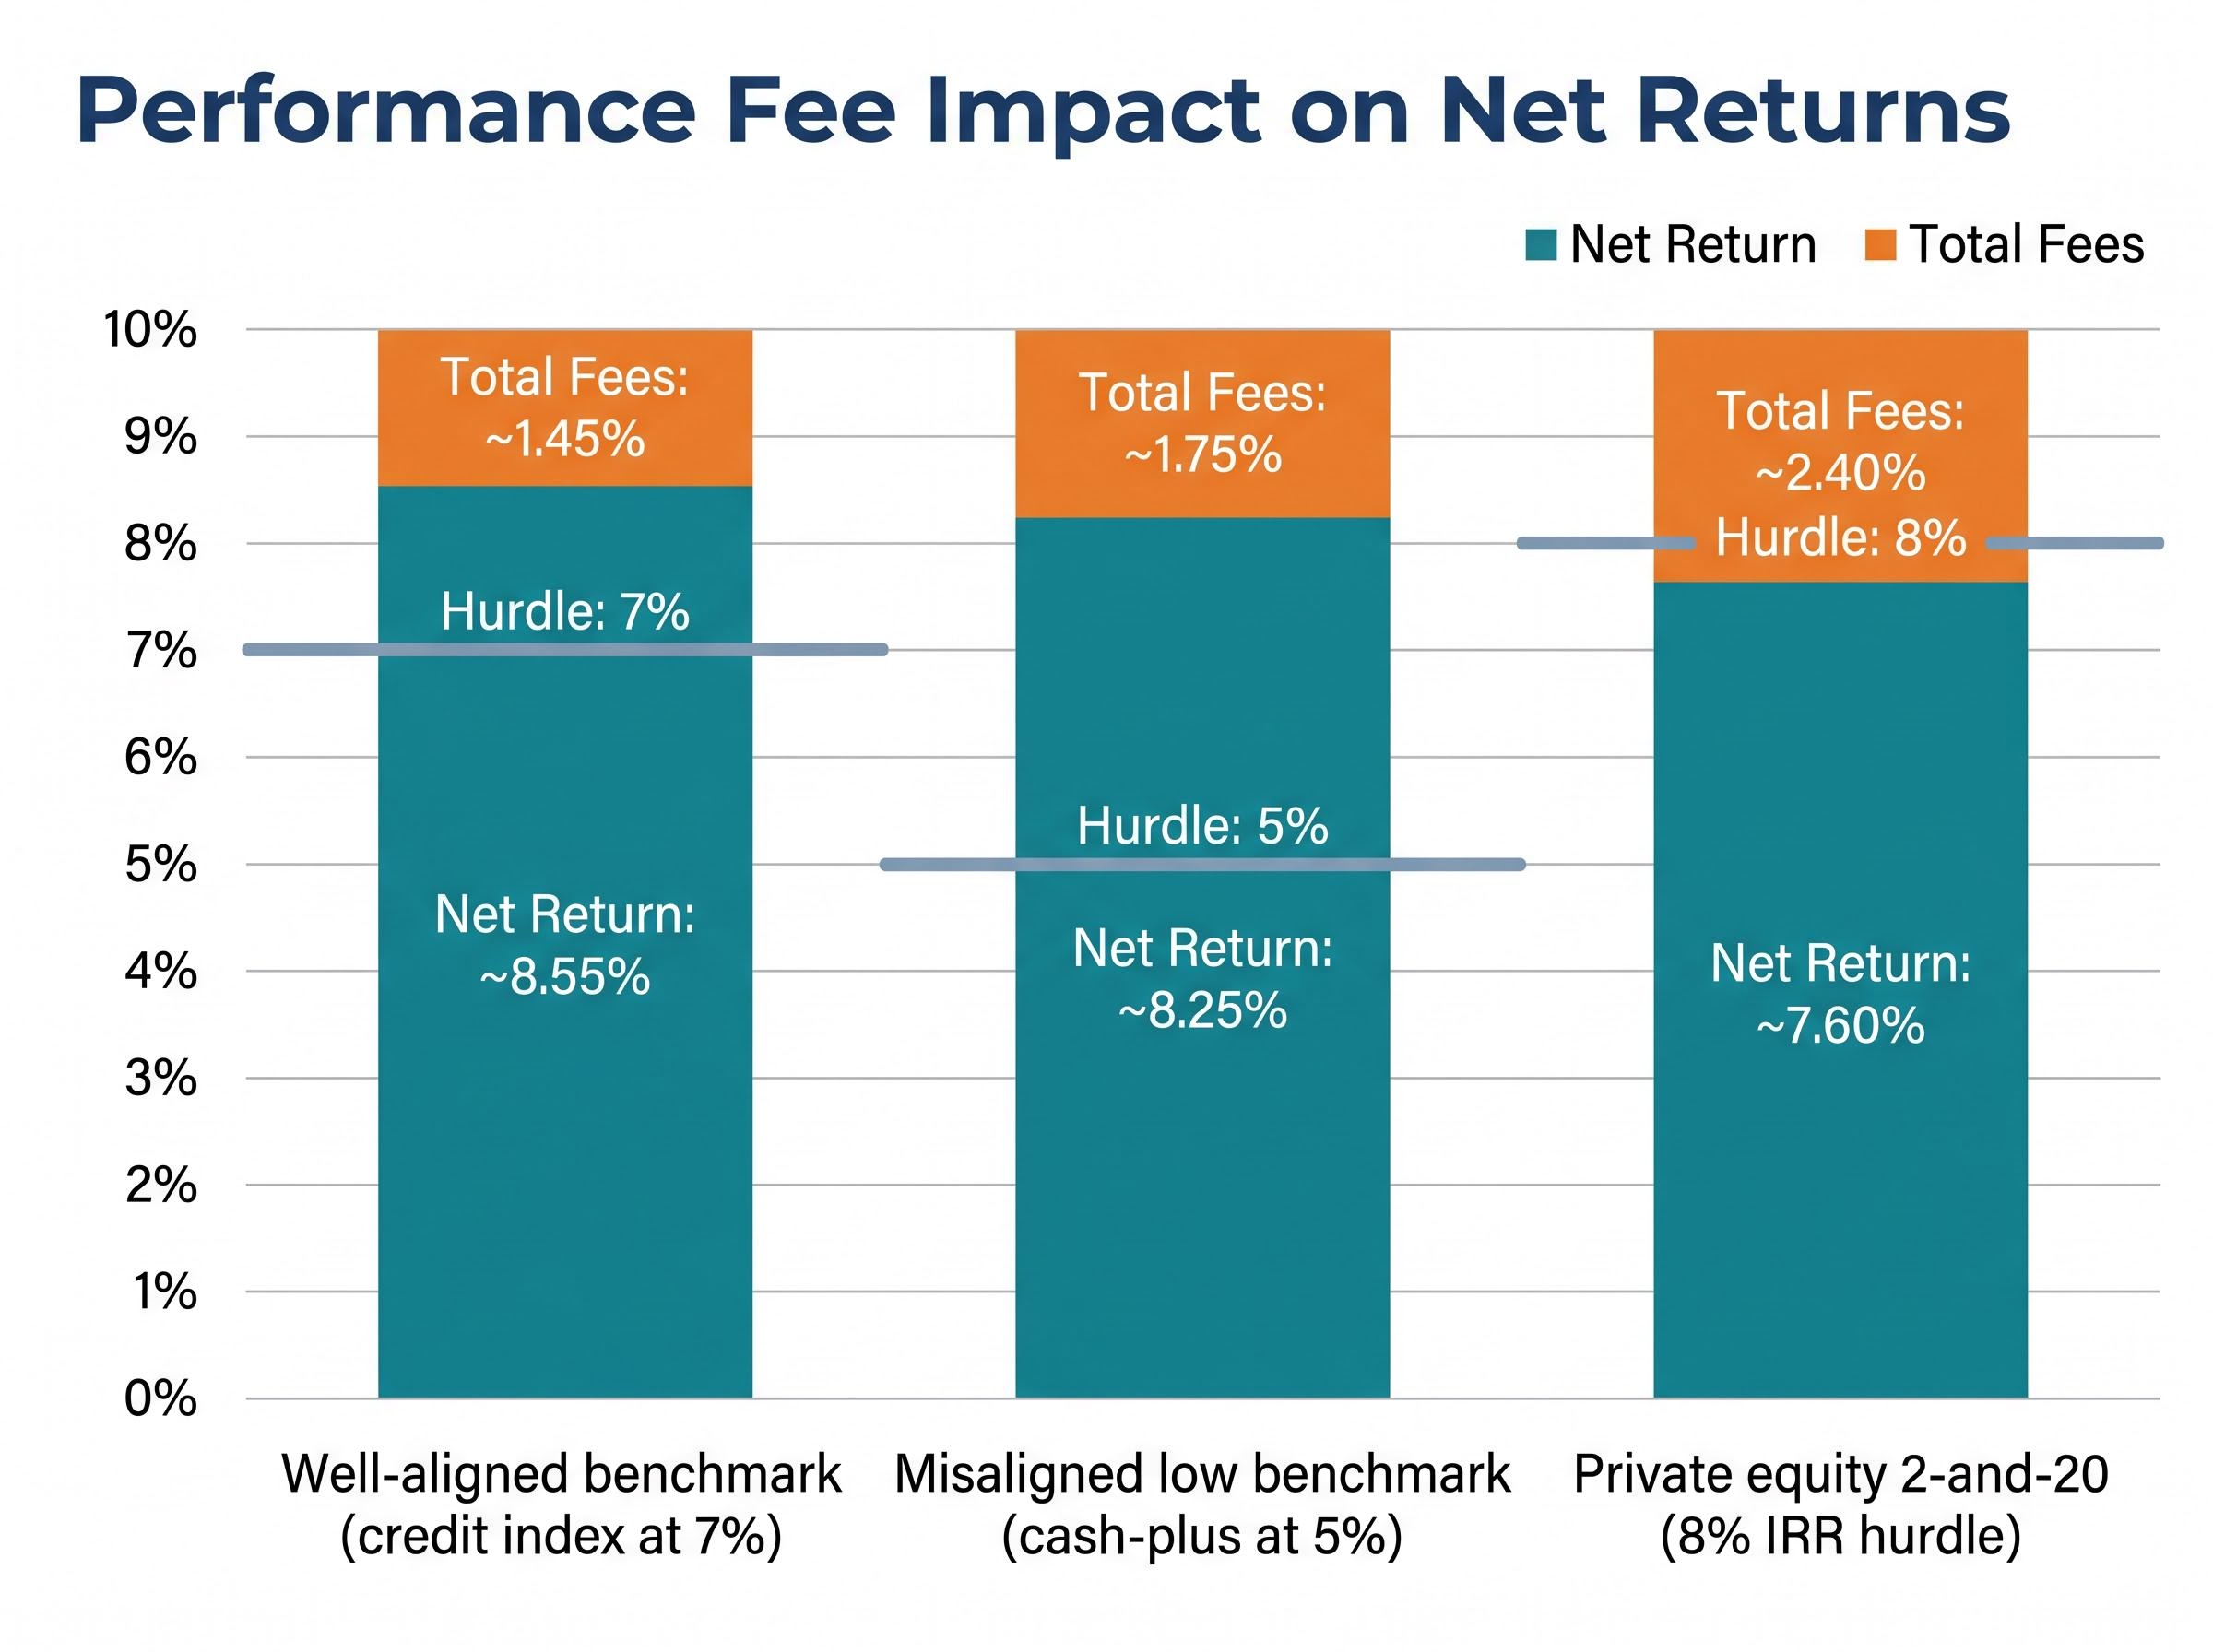
| Scenario | Gross Return | Benchmark Hurdle | Total Fees (approx.) | Investor Net Return |
|---|---|---|---|---|
| Well-aligned benchmark (e.g., credit index at 7%) | 10% | 7% | ~1.45% | ~8.55% |
| Misaligned low benchmark (e.g., cash-plus at 5%) | 10% | 5% | ~1.75% | ~8.25% |
| Private equity 2-and-20 (8% IRR hurdle) | 10% | 8% | ~2.40% | ~7.60% |
An annual fee drag of 0.5-1.0%, sustained over a decade, can reduce an investor’s total balance by 10% or more relative to a lower-fee alternative delivering identical gross returns. The difference is not visible in any single year. It compounds quietly.
The significance of fee compounding becomes clearer when considered across a full investment horizon: Morningstar Australia data shows that cheapest-quintile multisector growth funds achieved an 87% success rate compared to just 14% for the most expensive quintile, a gap that performance fee benchmarks set too low can quietly widen year after year.
The high watermark problem: when resets cost investors twice
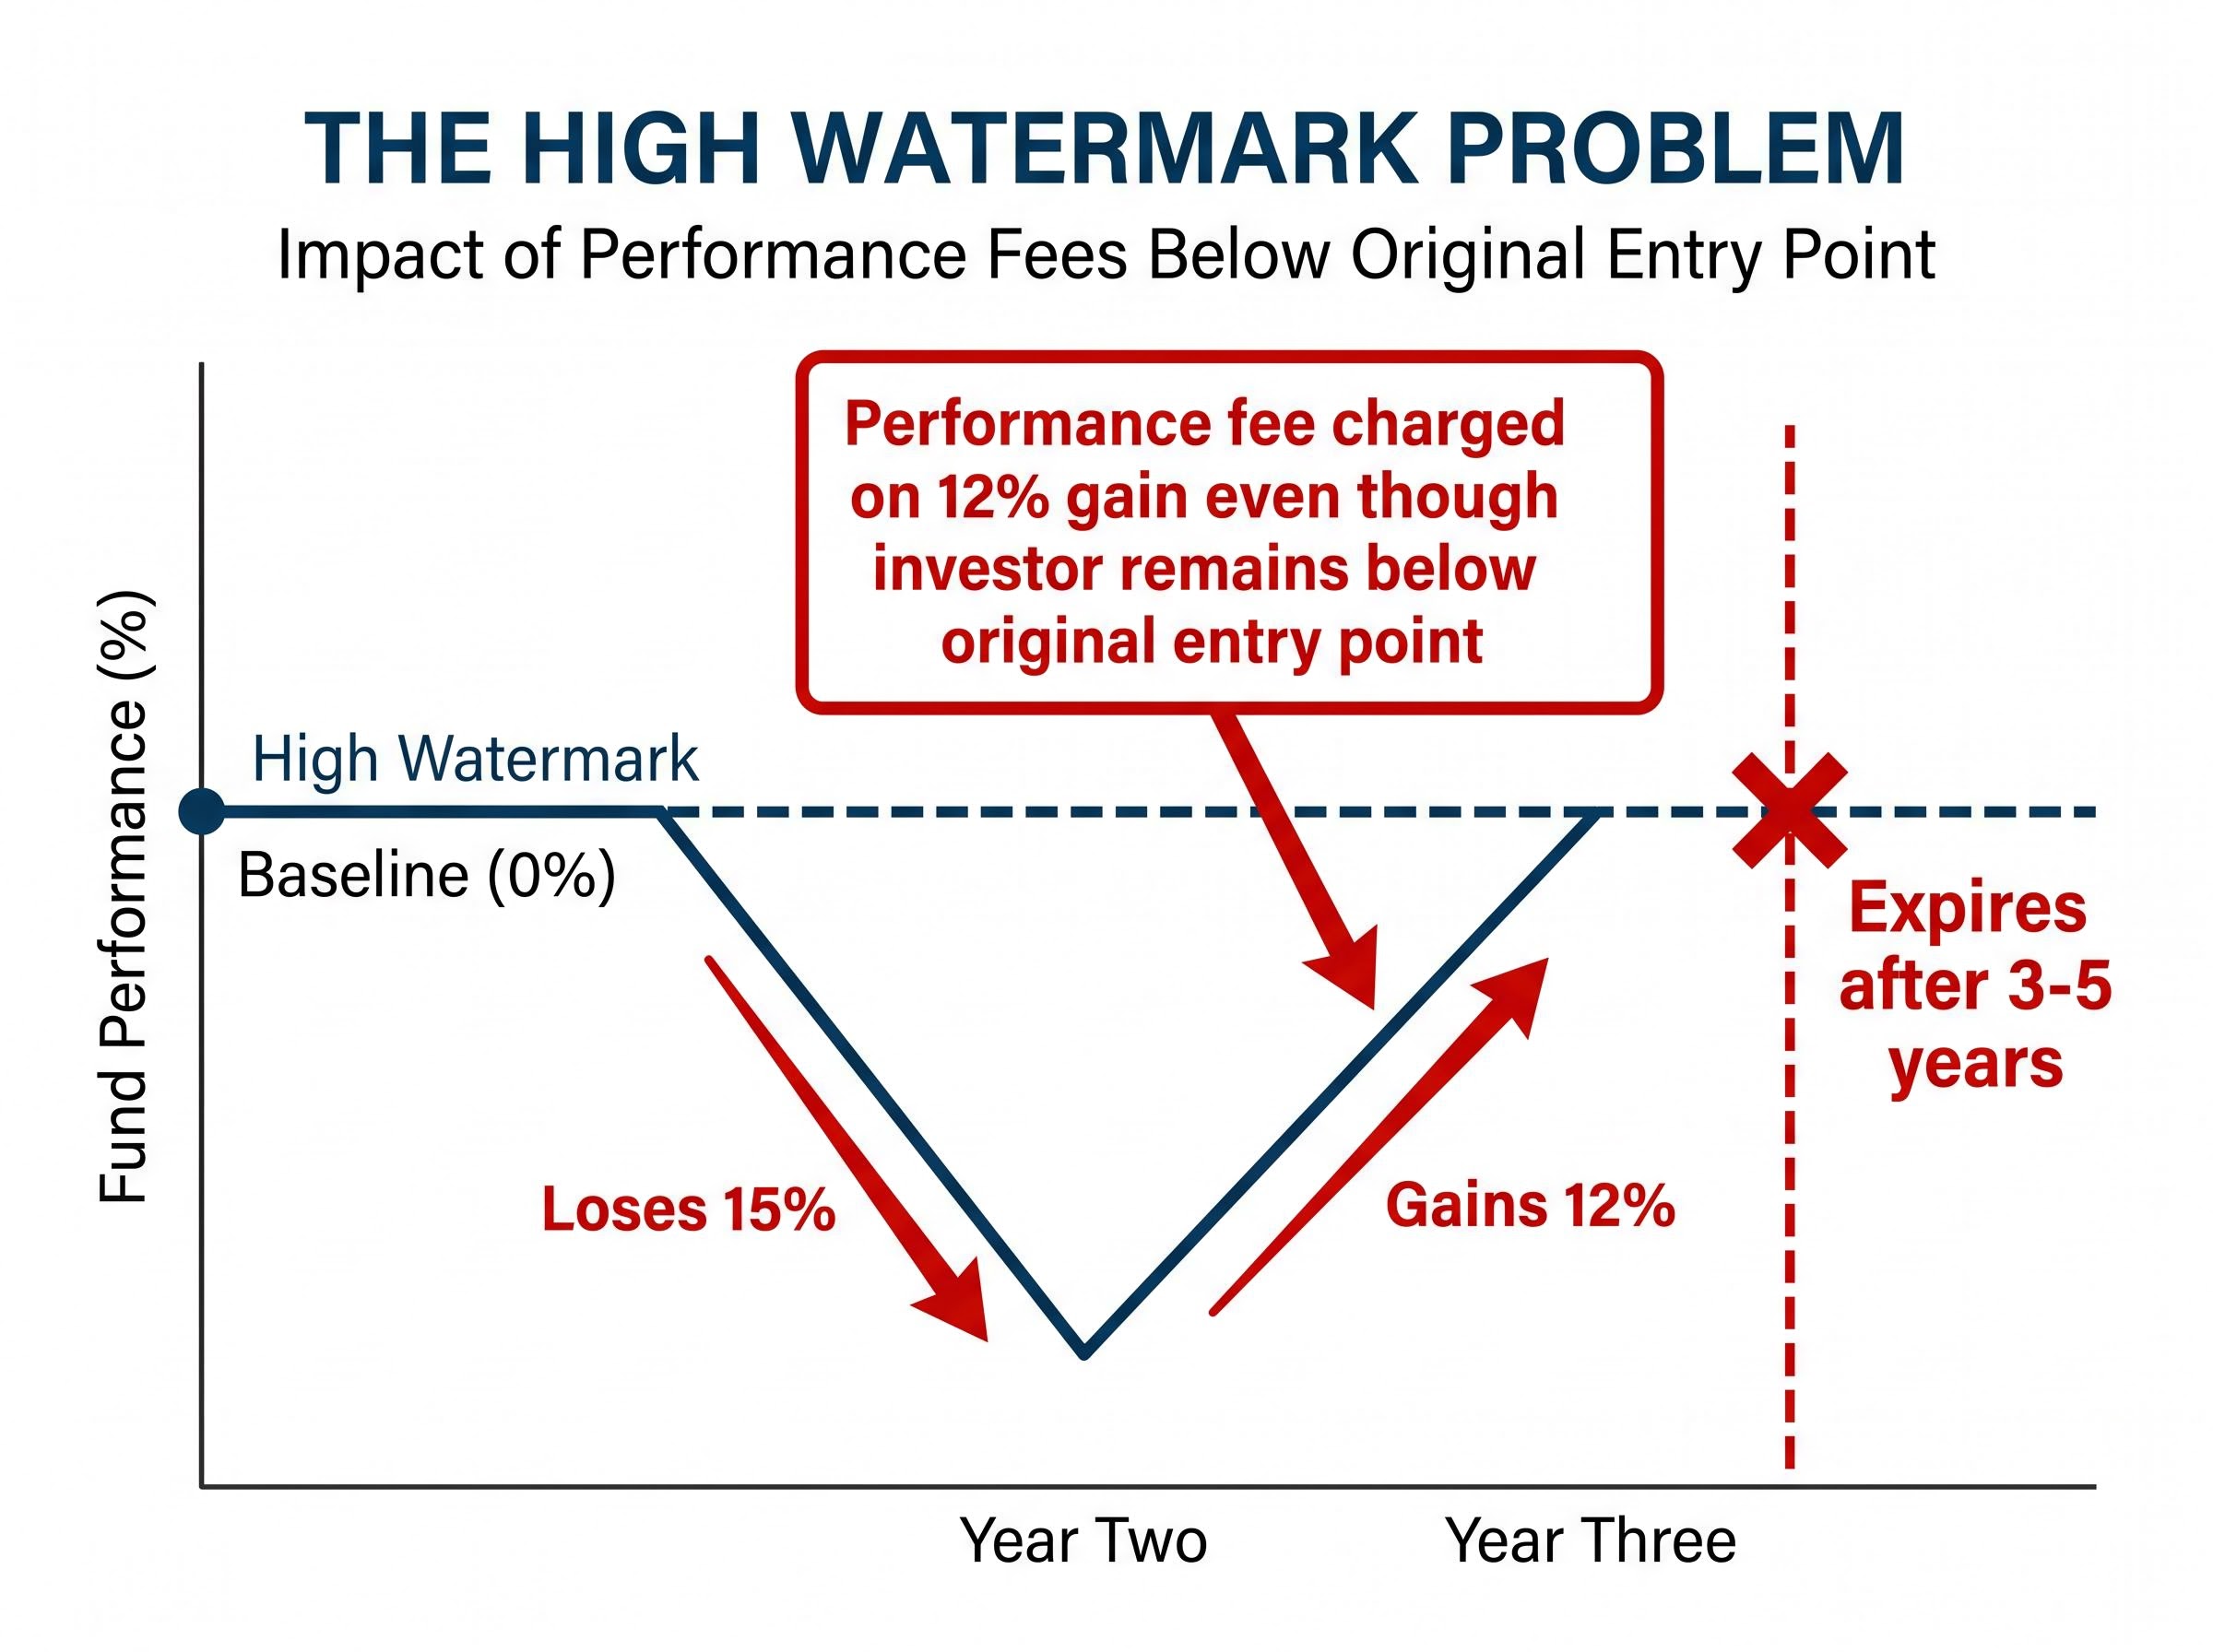
A genuine high watermark requires the manager to recover all prior losses before performance fees resume. If a fund loses 15% in year two, the manager should not collect performance fees until the investor’s capital is restored above its previous peak.
Resets undermine this protection. Some funds allow the high watermark to expire after a fixed period, commonly 3-5 years. In practice, this means a fund could lose 15% in year two, gain 12% in year three, and charge a performance fee on that 12% gain, even though the investor remains below their original entry point.
Why private debt and credit strategies are particularly exposed to this problem
Private debt has grown rapidly as an asset class for Australian retail and wholesale investors seeking yield. The benchmark structures within these funds deserve particular scrutiny.
A typical private credit portfolio may include subordinated loans, mezzanine finance, construction lending, and concentrated exposure to individual borrowers. The risk characteristics of this portfolio are materially different from what a CPI-plus or cash-rate benchmark implies:
- Private credit portfolio: subordinated lending, illiquidity, borrower concentration, credit spread exposure, potential for capital loss
- CPI-plus benchmark implies: low volatility, high liquidity, sovereign-level risk, near-zero probability of capital loss
A more appropriate comparator for a diversified private credit portfolio would be a corporate bond index or a blended credit spread benchmark, both of which price in the credit risk investors are actually bearing.
Private debt base management fees sit at approximately 0.70-1.10% per annum for wholesale funds, with performance fees commonly 10-20% of outperformance above a cash-plus or CPI-plus hurdle. Real Australian products operating in this space, including the Metrics Master Income Trust (ASX: MXT), Qualitas Real Estate Income Fund (ASX: QRI), and the La Trobe Australian Credit Fund, can be evaluated against their published PDS documents, which disclose the specific benchmark and fee structure applicable to each fund.
The gap between benchmark-implied risk and actual portfolio risk is not always deliberate. Industry convention and investor preference for simple hurdle expressions both contribute. The effect on investor outcomes, however, is the same regardless of intent.
Benchmark misalignment in private debt funds sits alongside a second structural concern: private credit liquidity risk, where the periodic redemption terms offered to investors are structurally mismatched with the illiquidity of the underlying loan book, a dynamic flagged by the Federal Reserve, IMF, and BIS as a potential amplifier of stress events across broader markets.
Does the benchmark used to trigger this fund’s performance fee reflect what could actually go wrong in this portfolio?
How to assess whether a fund’s benchmark is working for you or against you
The analytical framework above translates into a practical checklist investors can apply at the PDS-reading stage, before capital changes hands.
Four questions to bring to any fund’s PDS:
- What is the benchmark, and does it reflect the strategy’s risk class?
- Is there a high watermark, and does it reset?
- What has been the fund’s maximum drawdown versus the benchmark’s maximum drawdown?
- What would the fund’s net returns look like against a risk-matched alternative such as an equity index or credit index?
Consistent and wide outperformance of a stated benchmark should trigger scepticism about benchmark appropriateness, not simply admiration for the manager. A fund that beats a cash-plus benchmark by 5% every year is not necessarily skilful; it may simply be taking significantly more risk than the benchmark implies.
Comparing the fund’s volatility and drawdown history against the benchmark’s implied volatility is often more revealing than headline return figures. ASIC’s RG 97 requires the PDS to disclose how the performance fee is calculated. It is the investor’s responsibility to assess whether the benchmark embedded in that calculation is appropriate.
Benchmarks by strategy type: a quick reference
| Strategy Type | Fair Benchmark Comparator | Benchmark That Should Raise Concerns |
|---|---|---|
| Australian equities | S&P/ASX 200 or 300 Accumulation Index | RBA cash rate or CPI-plus |
| Private credit / corporate debt | Corporate bond index or credit spread benchmark | RBA cash rate plus 4-5% |
| Absolute return / multi-asset | Blended multi-asset index | CPI-plus with no volatility reference |
| Private equity | IRR hurdle (typically 8%) with whole-fund carry | Cash-plus or low fixed hurdle with deal-by-deal carry |
What better benchmark practice would look like, and where Australian regulation stands
Risk-aligned benchmark practice would require a private credit fund to measure outperformance against a credit spread index, an absolute return fund against a blended multi-asset index, and equity-style strategies against equity indices. In each case, the benchmark would price in the systematic risk of the strategy, so performance fees would only be triggered by returns that genuinely exceed what risk alone would deliver.
Australia’s regulatory settings fall short of this standard. The current position:
- RG 97 requires disclosure of how performance fees are calculated, but not that the benchmark be risk-appropriate
- No specific benchmark-alignment rule exists under the Corporations Act
- Treasury’s MIS review (consultation papers 2023-2024) flagged complex fee structures as a concern, but no confirmed Government Response with benchmark-specific rules has been published as of May 2026
ASIC’s existing powers under misleading conduct provisions could theoretically reach a benchmark that materially misrepresents a fund’s risk profile. In practice, no enforcement action targeting benchmark selection for performance fees has been publicly confirmed.
The closest existing analogue is ASIC’s greenwashing framework. Information Sheet 271 (updated March 2026) holds that cherry-picking easy sustainability metrics to claim outperformance is misleading. The same logic applied to performance fee benchmarks has not yet been formalised in guidance.
In the absence of regulation, scrutiny must come from investors themselves, financial advisers, and independent research houses.
ETF fee screening using category-relative measures such as the Morningstar Price Score offers investors a systematic alternative to actively managed funds with complex performance fee structures, with the ASX’s 470 listed ETFs providing a broad competitive set across asset classes from Australian equities to fixed income.
The benchmark is not a formality: what Australian investors should take away
The benchmark embedded in a fund’s PDS is the mechanism that converts fund returns into fee revenue. Its appropriateness directly determines whether investors are paying for genuine skill or for the risk they were already bearing.
Before committing capital, investors should locate the performance fee section of the PDS, identify the benchmark, assess whether it reflects the strategy’s actual risk class, and check whether the high watermark resets. Consistent wide outperformance of a low-risk benchmark warrants scepticism, not confidence.
As private credit and alternatives grow as a share of Australian retail and wholesale portfolios, benchmark scrutiny will become more important, not less. Investors evaluating managed funds, superannuation options, or private debt allocations should request the PDS and apply the risk-alignment test before money changes hands. For complex or illiquid strategies, independent financial advice is recommended.
For investors evaluating superannuation options alongside managed funds, our full explainer on hidden superannuation fees covers the structural costs that never appear as a line item in any fee disclosure document, including CGT drag from pooled trust structures, franking credit dilution, and the financing spread embedded in swap-based index strategies marketed as low-cost.
This article is for informational purposes only and should not be considered financial advice. Investors should conduct their own research and consult with financial professionals before making investment decisions.