Only about one in five Americans ever builds a consistent investing habit, yet the mathematical case for a simple index fund strategy is so thoroughly settled it fills introductory personal finance curricula worldwide. The gap between knowing and doing is where most wealth quietly disappears. This article is not about whether index fund investing works; the arithmetic has answered that question. The question is why it fails for the majority of people who attempt it, and the answer lives almost entirely in behavioural and structural territory, not in market conditions or fund selection. What follows is a clear diagnosis of the specific traps, from panic-selling and lifestyle creep to missed employer matches, high-interest debt, and underused tax-advantaged accounts, along with a concrete checklist that can be applied to any reader’s situation immediately.
The gap between index fund theory and investor reality
The strategy is simple. Buy a broad-market index fund, contribute consistently, and wait. The expected outcome is well-documented across decades of market data. And yet most people who start never finish.
Approximately 58% of U.S. households own mutual funds or ETFs, but because fund ownership concentrates in higher-income households, only about one-third of all U.S. households directly hold index funds, according to the Investment Company Institute (October 2024). Roughly 60% of new investors exit the market around year six, forfeiting the compounding gains that accelerate sharply after year ten.
The obstacle is not informational. It is behavioural and structural.
The three behavioural obstacles CFP professionals cite most frequently: reactive trading during volatility, lifestyle creep, and failure to automate savings. — CFP Board Center for Financial Planning, August 2024
Those three obstacles organise the rest of this article. The first is psychological: how emotions override arithmetic during market stress. The second and third are structural: how spending patterns, debt loads, and tax-account participation gaps quietly erode the very strategy investors believe they are following. Both categories are addressable, which is the point. The search for a better fund or a better entry point is a distraction from the work that actually determines outcomes.
When big ASX news breaks, our subscribers know first
How panic-selling and emotional exits destroy compounding permanently
Here is how a single emotional decision permanently alters a long-term trajectory:
- The market drops 20-30% over a period of weeks or months.
- The investor sells, converting an unrealised drawdown into a locked-in loss.
- The investor waits for “stability” before re-entering, missing the recovery and the lower share prices that would have accelerated their position.
Each step feels rational in isolation. Together, they form the most expensive sequence in personal finance.
Morningstar’s ‘Mind the Gap’ research puts a number on this pattern: loss aversion bias costs the average investor roughly 1-2 percentage points in annual returns, not through bad fund selection, but through selling near lows and re-entering after prices have already recovered.
U.S. equity mutual funds and ETFs saw net outflows of approximately $50 billion in March 2023, compared with average monthly outflows of $15 billion in 2022, as investors reacted to banking-sector volatility, according to the Federal Reserve’s Financial Stability Report (May 2024). Fidelity Investments found that Gen Z and millennial investors were more likely than older investors to move to cash or significantly reduce equity exposure in 2022, often locking in losses rather than maintaining their investment plan.
The arithmetic of staying invested cuts the other direction. A 30% market decline means a fixed monthly contribution of $500 buys 30% more shares at the lower price. Investors who maintained $500 monthly contributions through the 2008 financial crisis reportedly surpassed their pre-crash portfolio trajectory within approximately four years. The downturn was not the threat; the exit was.
The automation fix that removes the choice entirely
The most reliable defence against panic-selling is removing the decision point altogether. Automating contributions through payroll deduction or scheduled bank transfers means the money moves before the investor checks a headline or a portfolio balance.
The CFP Board identified “failure to automate savings” as one of the three primary behavioural obstacles to long-horizon investing success. Automation does not require discipline. It replaces discipline with structure, which is more durable under stress.
Why your lifestyle absorbs your raises before your index fund ever sees them
A raise arrives. Spending adjusts. The savings rate stays flat. Most people recognise this pattern in retrospect but cannot name it in real time.
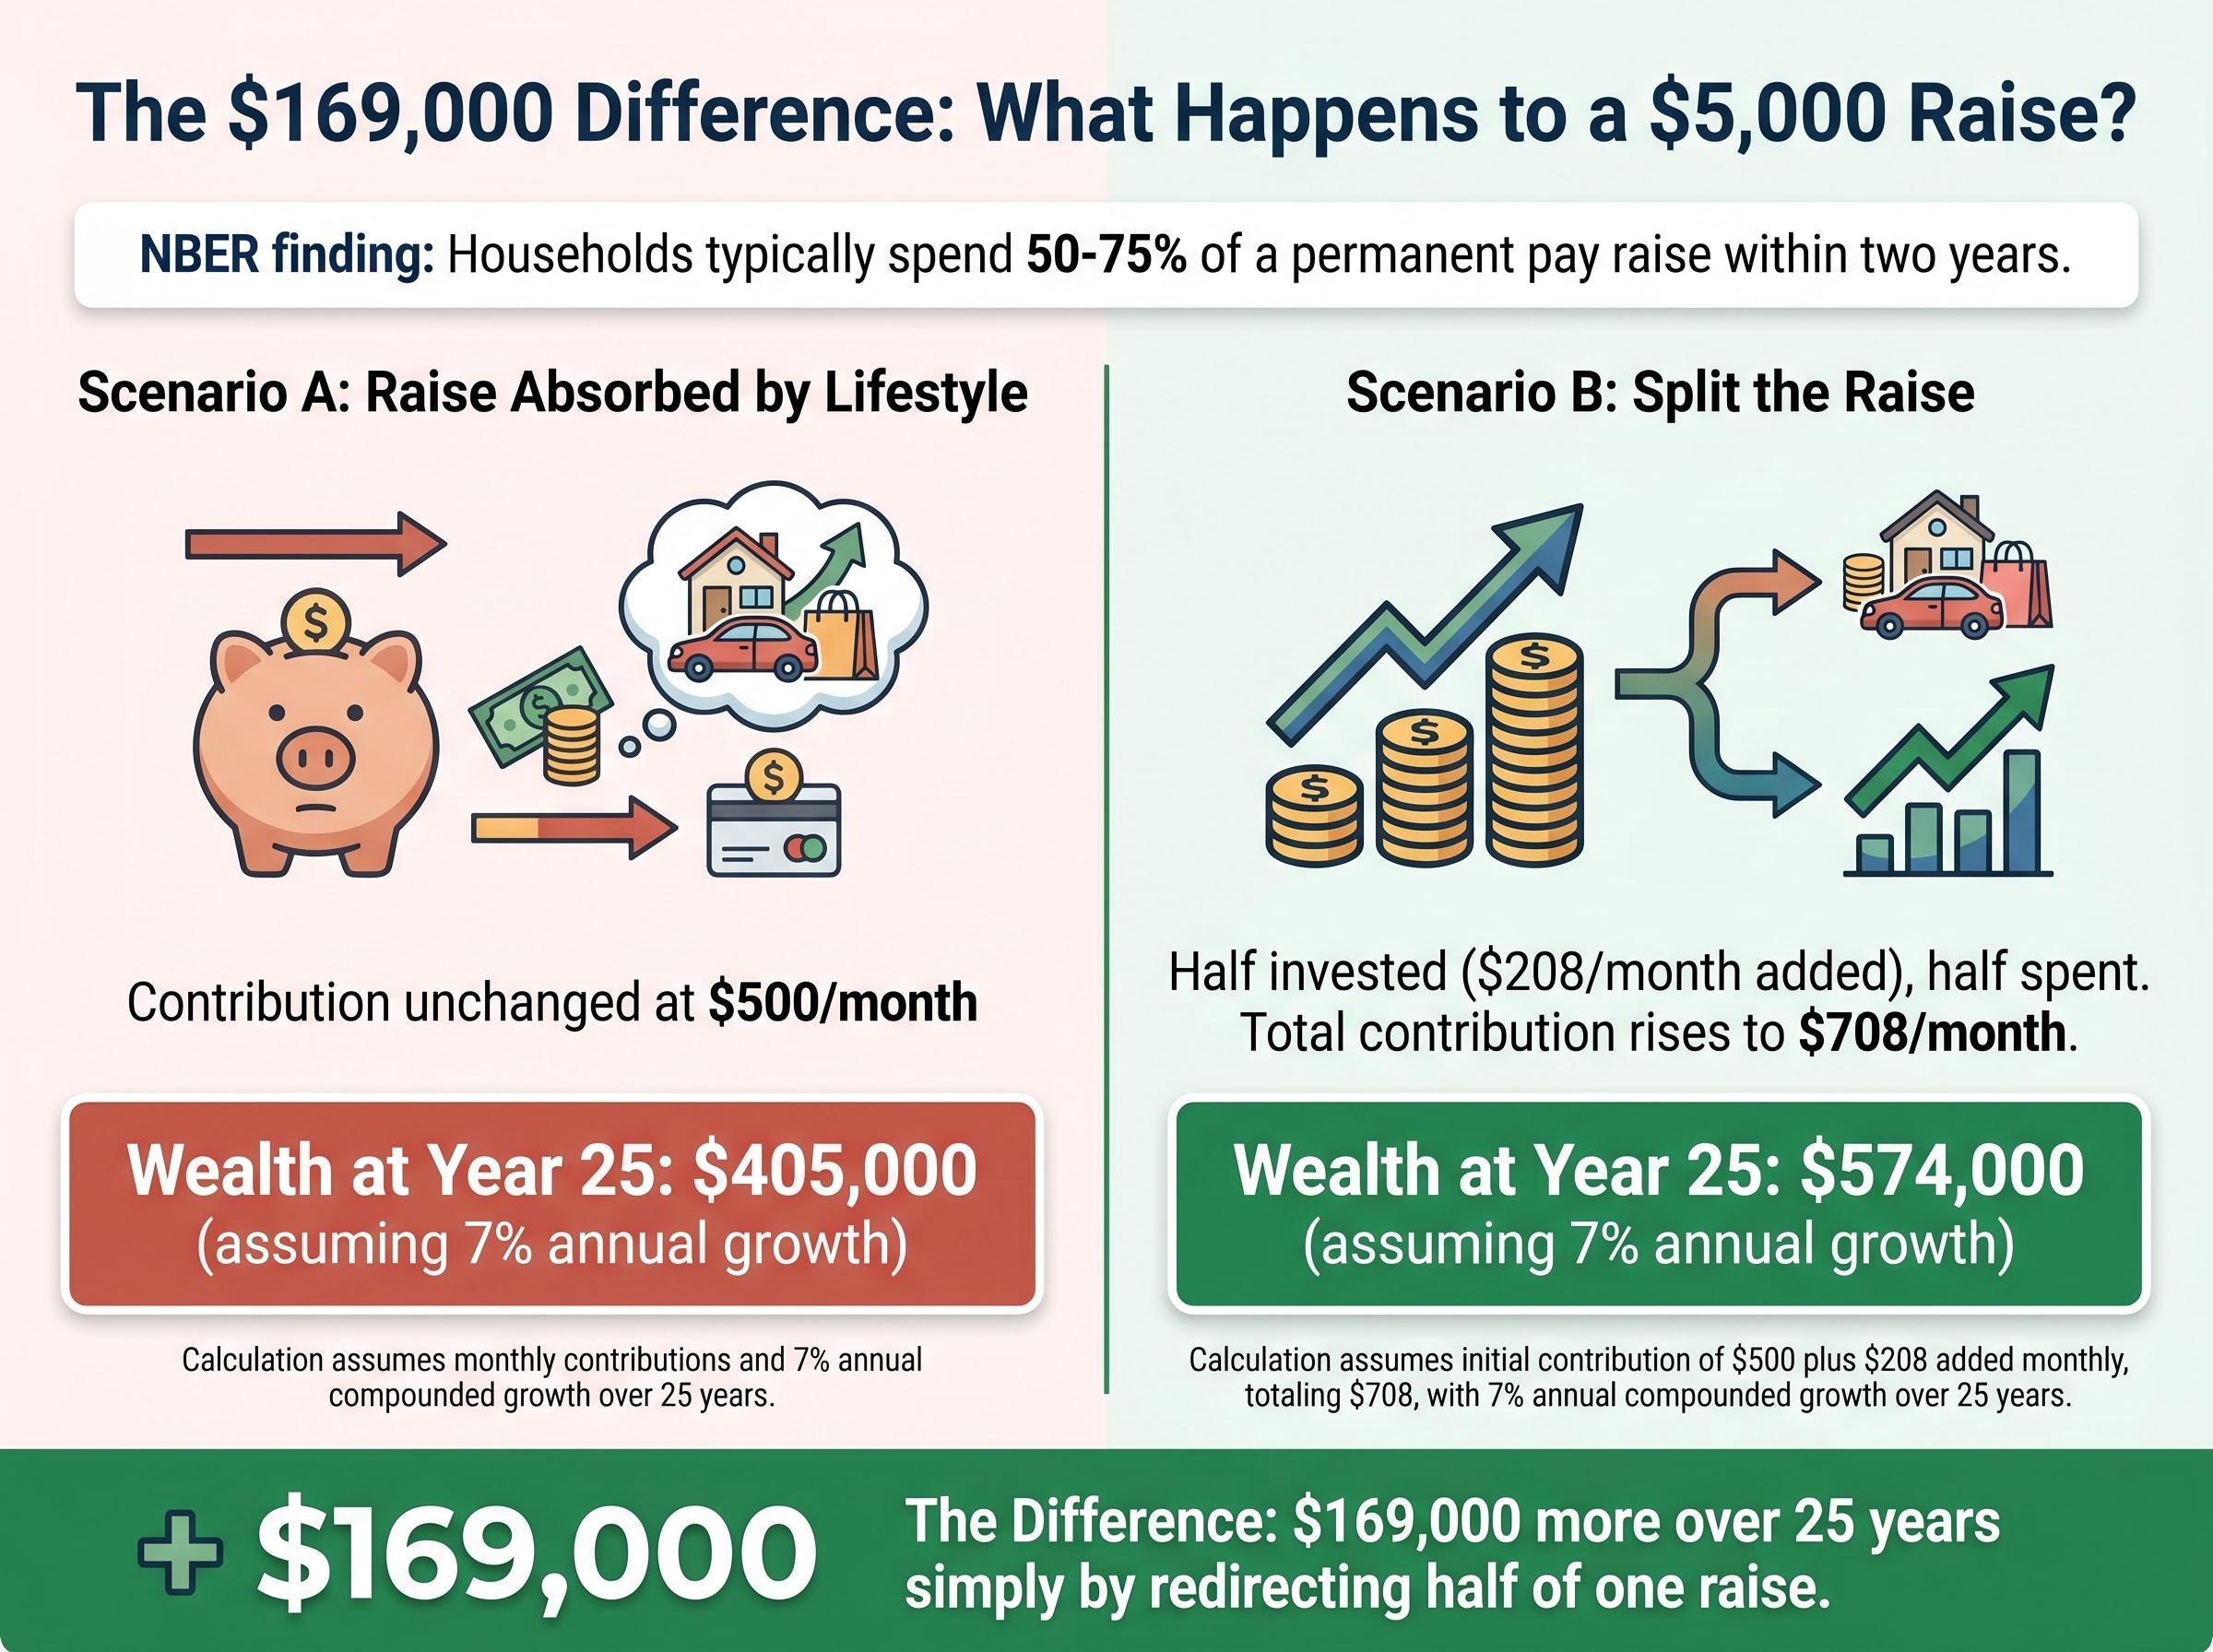
Research from the National Bureau of Economic Research found that when U.S. households receive a permanent pay increase, they increase spending by roughly 50-75% of the raise within two years, with only the remainder going to higher saving or debt reduction.
Research on spending habits and wealth gaps consistently shows that the divergence between two people on identical incomes is not driven by investment returns or market timing but by three normalised consumption patterns: housing costs, vehicle financing, and lifestyle inflation absorbing each successive income increase.
NBER finding: Households spend 50-75% of a permanent pay raise within two years, leaving only the remainder for saving or debt reduction. — Coibion, Gorodnichenko, and Weber, February 2024
The JPMorgan Chase Institute confirmed the pattern at scale: among middle-income households who experienced income growth between 2017 and 2023, median non-housing consumption rose almost one-for-one with income, leaving liquid savings rates essentially flat.
Social comparison accelerates the problem. The FINRA Investor Education Foundation reported that 42% of Gen Z and 38% of millennials said social media influences their investment decisions, and 27% felt pressure to spend more or invest in trending assets after seeing others’ posts. The American Psychological Association found that 40% of U.S. adults under 35 said social media makes them feel behind financially, a perception the APA linked to higher use of buy-now-pay-later products and credit cards.
The structural fix is straightforward: automate a savings-rate increase alongside every pay raise, so the investor never adjusts to the full post-raise take-home pay.
| Scenario | What Typically Happens | Wealth Outcome at Year 25 (7% annual growth) |
|---|---|---|
| $5,000 raise absorbed by lifestyle; contribution unchanged at $500/month | Spending rises to match new income; investment stays flat | Approximately $405,000 |
| $5,000 raise split: half invested ($208/month added), half spent | Contribution rises to $708/month; lifestyle improves modestly | Approximately $574,000 |
The difference, roughly $169,000 over 25 years, comes entirely from redirecting half of one raise. The maths compounds. The lifestyle adjustment does not.
The structural mistakes that silently cost more than bad market timing
The psychological traps get the attention. The structural errors do the damage.
Vanguard finding: Approximately 32% of 401(k) plan participants contribute less than the amount needed to receive their full employer match, forfeiting a guaranteed, immediate return on their savings. — Vanguard, How America Saves 2024
T. Rowe Price reported a similar figure at 29% across its recordkeeping base. The employer match is free money with a 100% guaranteed return on the contributed amount. No equity index can promise that.
The second structural mistake is investing while carrying revolving credit card debt. The average APR on credit card accounts assessed interest was 22.8% in Q4 2024, according to the Federal Reserve’s G.19 release (February 2025). Vanguard’s 10-year U.S. equity return projection sits at 4.3-6.3% nominal. Paying down a 22.8% APR balance delivers a guaranteed return equivalent to the card’s rate, a return no diversified equity portfolio can reliably match.
The Federal Reserve G.19 Consumer Credit release tracks revolving credit balances and the interest rates assessed on credit card accounts, providing the authoritative data behind the 22.8% average APR figure that makes carrying a balance while investing a mathematically losing proposition.
Total U.S. credit card balances reached $1.13 trillion in Q4 2023 and remained above $1.1 trillion through Q1 2024, with 8.9% of credit card borrowers transitioning into serious delinquency. The Federal Reserve reported that 18% of non-retired adults not saving for retirement cited too much debt as their primary reason.
| Strategy | Guaranteed Return | Effective Cost or Gain | Net 5-Year Outcome |
|---|---|---|---|
| Pay off credit card debt first | 22.8% (APR eliminated) | Guaranteed savings equal to interest avoided | Debt-free; full contributions begin clean |
| Invest first, skip debt paydown | 5.5% expected equity return | Net loss of approximately 17.3% annually on debt carried | Portfolio grows slowly while debt compounds faster |
| Capture employer match, then pay debt | 100% match + 22.8% debt paydown | Guaranteed match captured; remaining cash attacks highest-cost debt | Match secured; debt eliminated; full investing begins |
The third structural gap involves Health Savings Accounts. Only 20% of HSA accounts had any portion invested in mutual funds or other securities, according to Devenir Research (April 2025). Most balances sat in cash, forfeiting the account’s triple tax advantage entirely.
What the tax-advantaged account participation gap actually costs you
Tax-advantaged accounts, specifically Roth IRAs, traditional 401(k) plans, and HSAs, each shelter investment growth from taxation in distinct ways. Understanding the differences is not optional for a long-term index investor; it is the difference between keeping compounding gains and surrendering a portion to annual tax drag.
A Roth IRA accepts after-tax contributions, meaning money that has already been taxed. The benefit arrives at the other end: all growth and withdrawals in retirement are tax-free. A traditional 401(k) works in reverse: contributions reduce taxable income today, but withdrawals in retirement are taxed as ordinary income. An HSA (Health Savings Account) offers the rarest structure of all: contributions are tax-deductible, growth is tax-free, and withdrawals for qualified medical expenses are also tax-free.
IRS Publication 969 on HSA rules defines the eligibility requirements, contribution limits, and qualified expense categories that determine how the triple tax advantage operates in practice, including the conditions under which non-medical withdrawals after age 65 are treated as ordinary income rather than penalised.
FINRA National Financial Capability Study 2024: Fewer than 25% of U.S. adults could correctly answer a question about the HSA’s triple tax advantage. Only 38% correctly identified the basic tax treatment of Roth IRAs.
The participation numbers reflect the knowledge gap. Approximately 29.6 million U.S. households owned a Roth IRA as of tax year 2022, representing about 23% of all U.S. households, according to the Investment Company Institute (November 2024). Among those owners, only 37% made a contribution in the most recent tax year.
HSA adoption tells a similar story. By the end of 2024, 37 million HSA accounts existed, holding $123 billion in assets. Yet only about 20% had any portion invested. Vanguard’s research found that choice overload in plans with many investment options is associated with lower equity allocations and higher rates of non-participation.
| Account Type | Tax Benefit | 2025 Contribution Limit | Best Used For |
|---|---|---|---|
| Roth IRA | Tax-free growth and withdrawals in retirement | $7,000 (under 50); $8,000 (50+) | Investors expecting higher tax rates in retirement |
| Traditional IRA | Tax-deductible contributions; taxed on withdrawal | $7,000 (under 50); $8,000 (50+) | Investors seeking current-year tax reduction |
| 401(k) (employee contribution) | Pre-tax contributions reduce taxable income; taxed on withdrawal | $23,500 (under 50); $31,000 (50+) | Maximising employer match and higher contribution ceiling |
| HSA | Triple tax advantage: deductible contributions, tax-free growth, tax-free medical withdrawals | $4,300 (individual); $8,550 (family) | Long-term medical expense investment; retirement supplement |
The maths of index investing only fully realises when the gains compound inside these sheltered structures over decades. Contributing to a taxable brokerage account while eligible tax-advantaged space sits unused is a structural inefficiency that no fund selection can offset.
The behavioural and structural checklist for investors who want to actually finish
Everything covered above collapses into a prioritised sequence. The order matters; each step creates the foundation for the next.
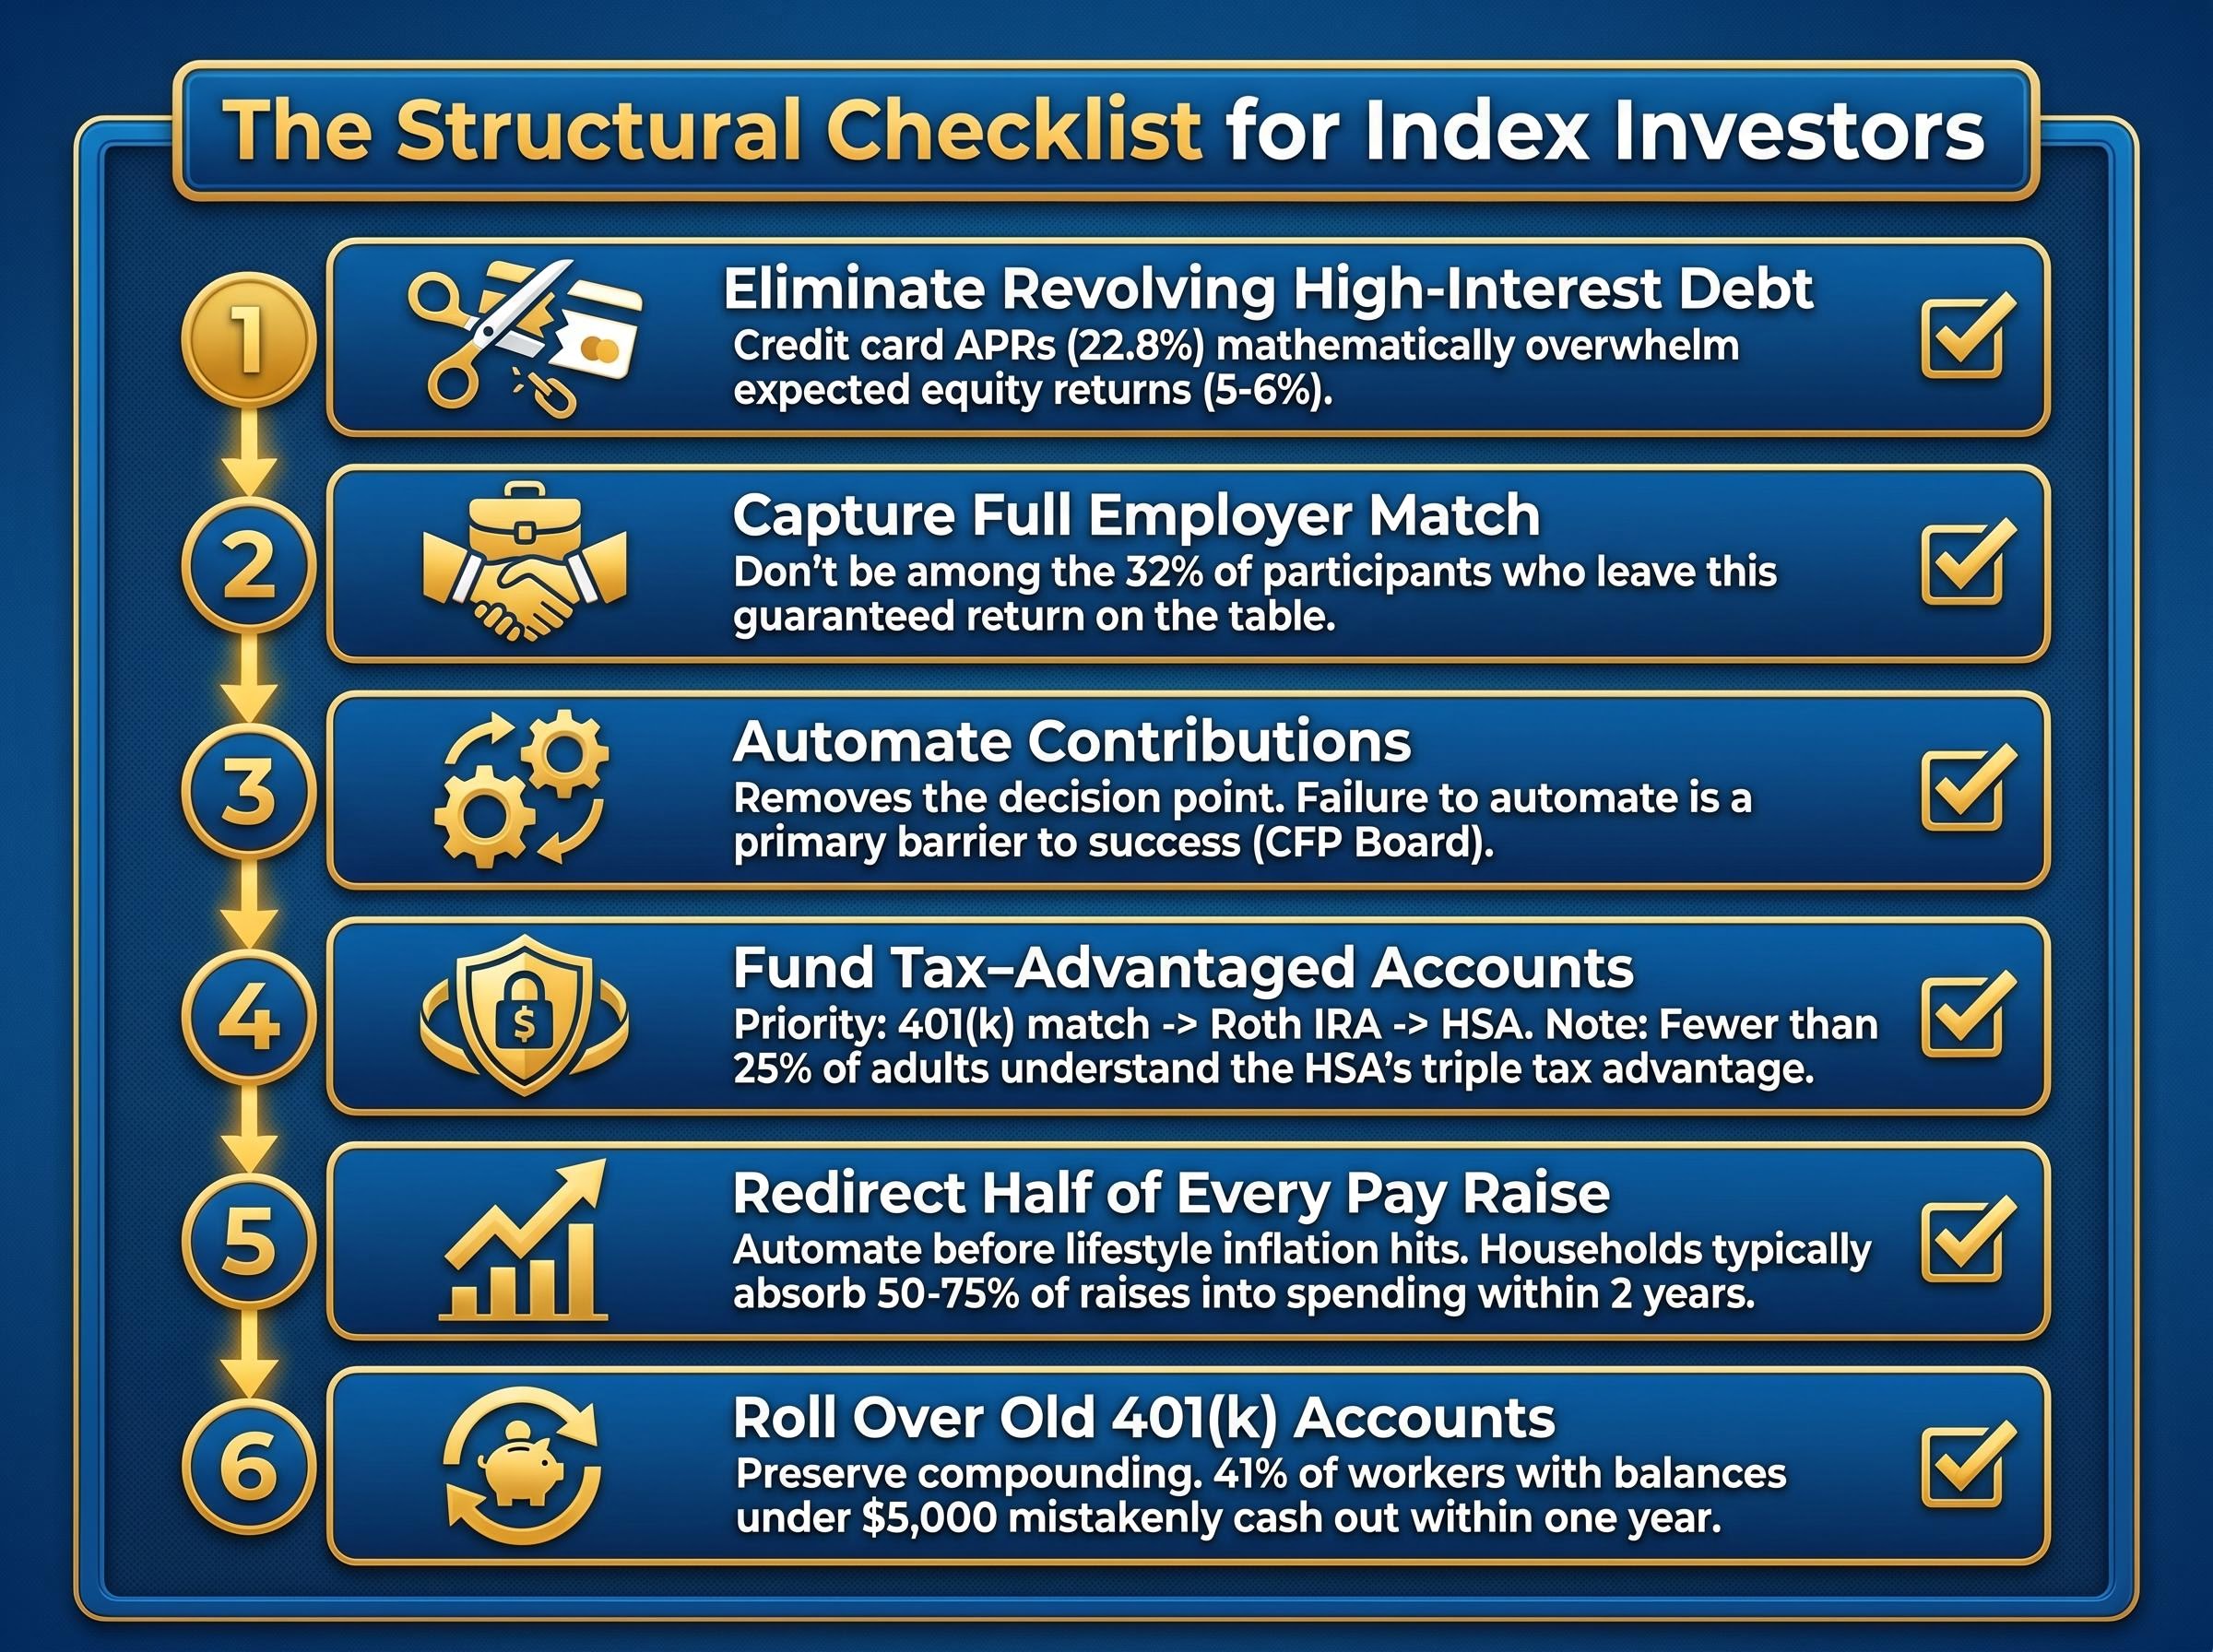
- Eliminate revolving high-interest debt. Credit card APRs of 22.8% mathematically overwhelm expected equity returns of 5-6%. Pay these down before investing beyond any employer match.
- Contribute enough to capture the full employer match. Roughly 32% of plan participants leave this guaranteed return on the table. The match is the highest-returning allocation available.
- Automate contributions through payroll deduction or scheduled transfers. Automation removes the decision point where panic-selling and procrastination occur. The CFP Board identified failure to automate as a primary barrier to long-term investing success.
- Open and fund tax-advantaged accounts in priority order: 401(k) to match, then Roth IRA, then HSA (if eligible). Each account type shelters compounding from taxation over decades. Fewer than 25% of adults understand the HSA’s triple tax advantage; understanding it is the first step to using it.
- Redirect at least half of every pay raise to increased contributions before adjusting lifestyle spending. Research shows households absorb 50-75% of raises into spending within two years. Automating the increase before the new take-home feels normal prevents lifestyle inflation from erasing income growth.
- Roll over old 401(k) accounts when changing jobs. Among workers with balances under $5,000, approximately 41% cash out within one year, according to EBRI (October 2024). Rolling over preserves compounding and avoids early withdrawal penalties.
Behavioural commitments that protect the structural plan
The structural steps above solve the architecture problem. These behavioural commitments protect it over time.
Set a quarterly portfolio review schedule, not a daily one. Checking balances during volatility is the most reliably documented trigger for panic-selling. Fidelity’s research confirmed that younger investors were most likely to reduce equity exposure during stress, often locking in losses.
Write down a pre-commitment: a specific, signed note to oneself stating the conditions under which selling is and is not permitted. Behavioural research consistently shows that pre-commitment reduces impulsive financial decisions.
Treat retirement accounts as non-negotiable. The Transamerica Center for Retirement Studies reported that 37% of workers had taken some form of early access to retirement savings in 2023. Fidelity reported average 401(k) balances ranging from $11,600 for workers aged 20-29 to $182,100 for those aged 60-69; those figures reflect the difference between investors who stayed the course and those who did not.
The maths has done its part. Now the execution is yours.
Index fund investing is not a knowledge problem. It is a behavioural and structural execution problem, and both dimensions are solvable.
The checklist items above are not equally easy. Eliminating credit card debt requires months of focused repayment. Resisting lifestyle inflation requires a structural intervention, not willpower. Writing a pre-commitment not to sell during a drawdown requires confronting the possibility of a drawdown before it arrives. None of these steps demand financial sophistication. All of them demand intention.
Investors who automate, capture their match, stay out of revolving debt, and resist lifestyle inflation for 15-25 years are not relying on luck or market timing. They are relying on the arithmetic that already settled the question of whether this strategy works. The only remaining question is whether the investor’s behaviour and financial structure allow the arithmetic to finish what it started.
Investors who complete the structural checklist and want to assess whether their current trajectory is on track can use wealth accumulation benchmarks derived from Federal Reserve Survey of Consumer Finances data to determine whether their actual net worth keeps pace with their income level and age, a gap that Stanley’s research shows is far wider than most high earners expect.
This article is for informational purposes only and should not be considered financial advice. Investors should conduct their own research and consult with financial professionals before making investment decisions. Past performance does not guarantee future results. Financial projections referenced in this article are subject to market conditions and various risk factors.