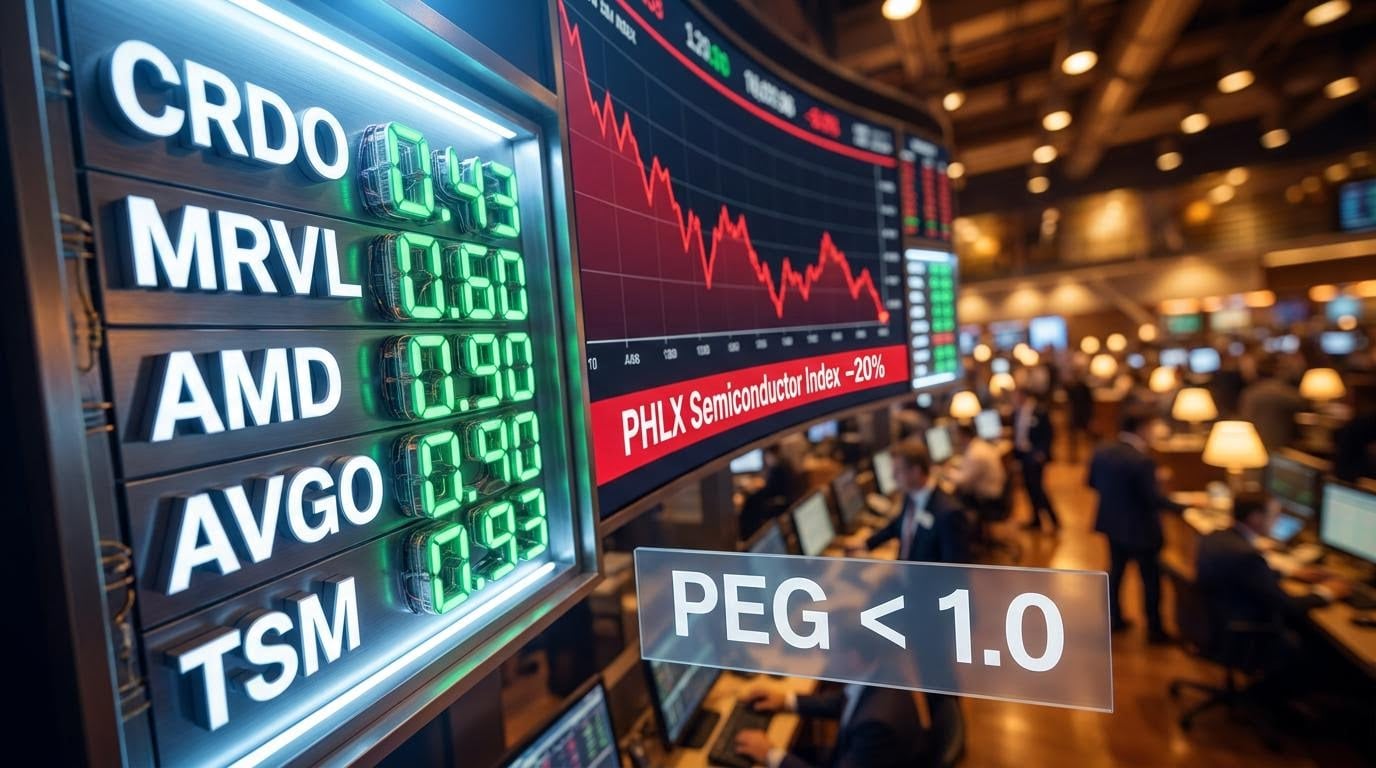
The Philadelphia Semiconductor Index has shed more than 20% from its recent peak, meeting the technical definition of a bear market. For investors running a PEG-ratio screen right now, five names in the AI infrastructure stack are showing readings below 1.0 while carrying analyst consensus in the Buy range, a combination that does not appear often in a sector with this growth profile.
The selloff has been driven by sentiment and macro concerns, not by a deterioration in the earnings outlooks of the companies that build the physical foundation of AI. Scaling up AI models means scaling up GPU counts, and every additional GPU brings with it growing demand for networking, specialised silicon, advanced fabrication capacity, and high-speed connectivity. That demand curve has not reversed. What has changed is the price the market is willing to pay, and that gap between price and growth trajectory is what the PEG ratio captures.
Here is a structured look at five companies across the AI supply chain, each assessed on its specific role, its valuation relative to its growth rate, and what analysts currently project for upside. The framework applies beyond this list.
What a PEG ratio below 1.0 actually tells you (and what it does not)
A PEG ratio divides a company’s price-to-earnings (P/E) ratio by its earnings growth rate. A reading of 1.0 means the market is pricing the stock exactly in line with its growth. Below 1.0 suggests the market may be underpricing the growth trajectory. Above it suggests you are paying a premium.
The PEG ratio is one of several stock valuation metrics that correct for specific failure modes in the standard P/E ratio; P/FCF, EV/EBITDA, and price-to-book each expose a different dimension of value that a single earnings multiple cannot capture.
That sounds straightforward. The complication is that different data providers use different growth-rate inputs, and they can produce materially different readings for the same stock on the same day.
Credo Technology illustrates this directly. Its PEG ranges from 0.43 (StockAnalysis) to 0.93 (MarketBeat) depending on the provider. The specific number matters less than the direction: when every methodology produces a reading below 1.0, the signal is robust. That consistency is what you should look for in your own screens.
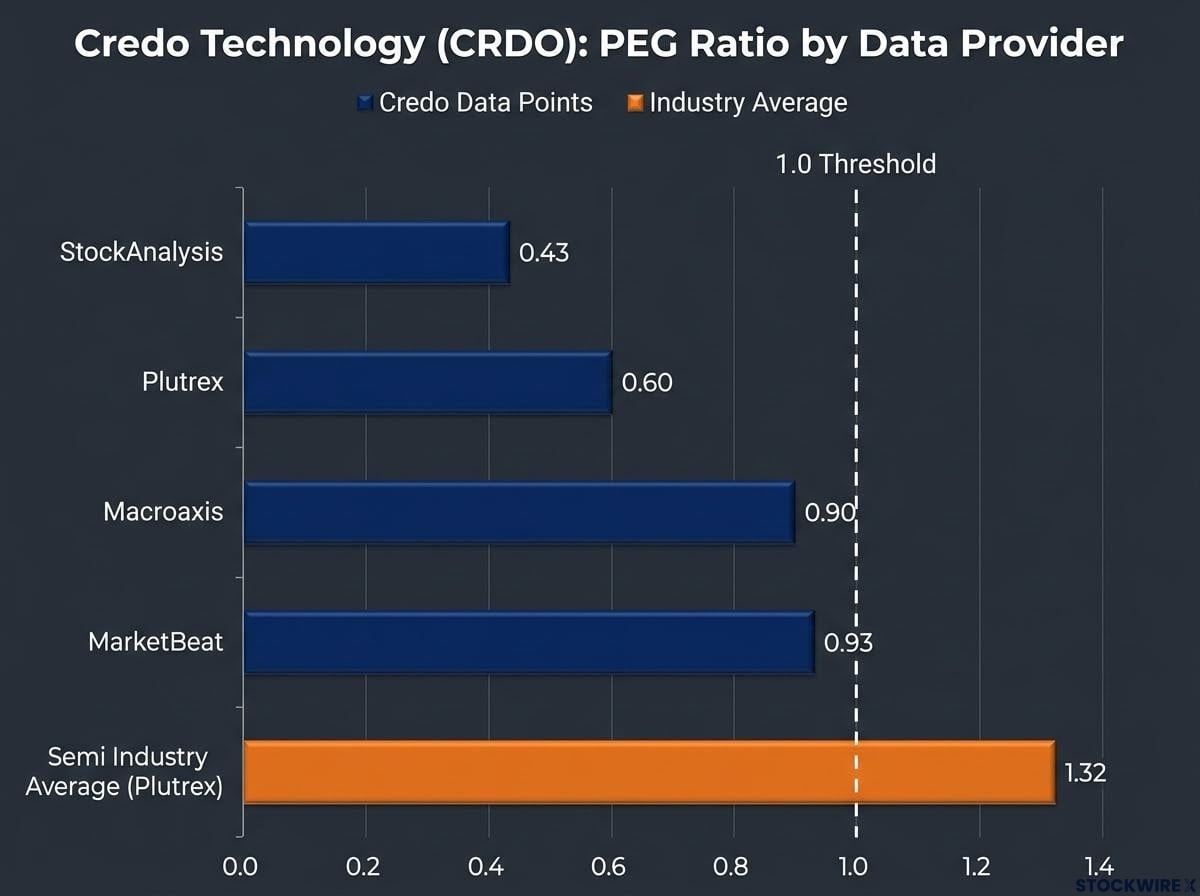
For context, the semiconductor industry average PEG sits at approximately 1.32 according to Plutrex. Every company on this list screens below that threshold across multiple sources.
PEG below 1.0: what it suggests:
- Earnings growth rate exceeds the valuation multiple
- The market may be underpricing the company’s forward trajectory
- Worth investigating further as a potential entry point
PEG below 1.0: what it does not confirm:
- That the stock is a buy on its own
- That the growth estimates feeding the ratio are accurate
- That sentiment, macro risk, or sector rotation will not push the price lower first
When big ASX news breaks, our subscribers know first
Credo Technology (CRDO): the pure-play AI networking pick
AI data centres run on GPU clusters that must transfer enormous quantities of data between thousands of processors at all times. When that data movement cannot keep pace with compute demand, the entire cluster slows down, and Credo Technology provides the high-speed connectivity infrastructure built to address exactly that constraint.
The PEG case here is the most robustly documented of the five. Across all major data providers, Credo’s PEG sits below 1.0, making it the only name on this list where the sub-1.0 reading is confirmed regardless of methodology.
| Data Provider | PEG Ratio | Forward P/E (where available) | Source Notes |
|---|---|---|---|
| StockAnalysis | 0.43 | ~49.5x | Lowest PEG reading across providers |
| Plutrex | 0.60 | N/A | ~55% discount to semiconductor industry average PEG |
| Macroaxis | 0.90 | N/A | Highest reading still below 1.0 threshold |
| MarketBeat | 0.93 | N/A | Uses different growth-estimate methodology |
The forward P/E sits in the 42x to 50x range, which is not cheap in isolation. But relative to EPS growth projected in the high double-digit to low triple-digit range over the next one to two fiscal years, the PEG compression is the story. The company’s profitability profile is strong, with margins running above 30% at the operating line.
The consensus 12-month price target from analysts sits at roughly $282 per share, pointing to more than 30% potential appreciation from where shares trade today. Consensus sits in the Buy range.
Credo’s focused position means its revenue is directly tied to GPU cluster scaling, giving you a relatively clean proxy for hyperscaler AI build-out intensity with no revenue diversification diluting that exposure.
Marvell Technology (MRVL): optical connectivity and custom silicon in the scaling bottleneck
Marvell Technology occupies a hybrid position on the AI stack that neither Credo nor Broadcom replicates. Marvell’s product portfolio spans optical connectivity hardware, switching solutions, and custom ASICs (application-specific integrated circuits, chips designed for a single purpose rather than general computing), all of which become more critical as GPU cluster sizes move from thousands of processors toward hundreds of thousands. At that scale, the fabric connecting the chips is as important a constraint as the chips themselves.
Business role on the AI stack
Where Credo focuses on connectivity and Broadcom on custom silicon design partnerships, Marvell straddles both. That gives it two independent growth drivers that can sustain the earnings trajectory even if one segment slows.
Valuation and analyst positioning
Revenue expanded 42% over the trailing 12-month period. EPS growth is forecast at approximately 42% in the current year and more than 50% in the following year. Against a forward P/E of approximately 30x, that implies a PEG ratio well below 1.0.
The business is running at an operating margin of around 16%, with operating cash flow up approximately 22% over the prior year. The company’s market capitalisation stands at roughly $165 billion.
The consensus analyst price target of approximately $271 per share represents around 40% potential upside from where the shares currently trade, the second-highest implied upside in this list.
That 40% figure, combined with dual exposure to optical connectivity and custom ASICs, tells you analysts are pricing in both growth drivers delivering, not just one.
AMD: AI accelerators, CPUs, and a full rack play entering the market
AMD is not the company chasing Nvidia. It is a company with two distinct growth engines firing simultaneously: AI accelerators (GPUs) for AI workloads and CPUs for high-performance computing. A single position captures compute-layer breadth that no other name on this list provides.
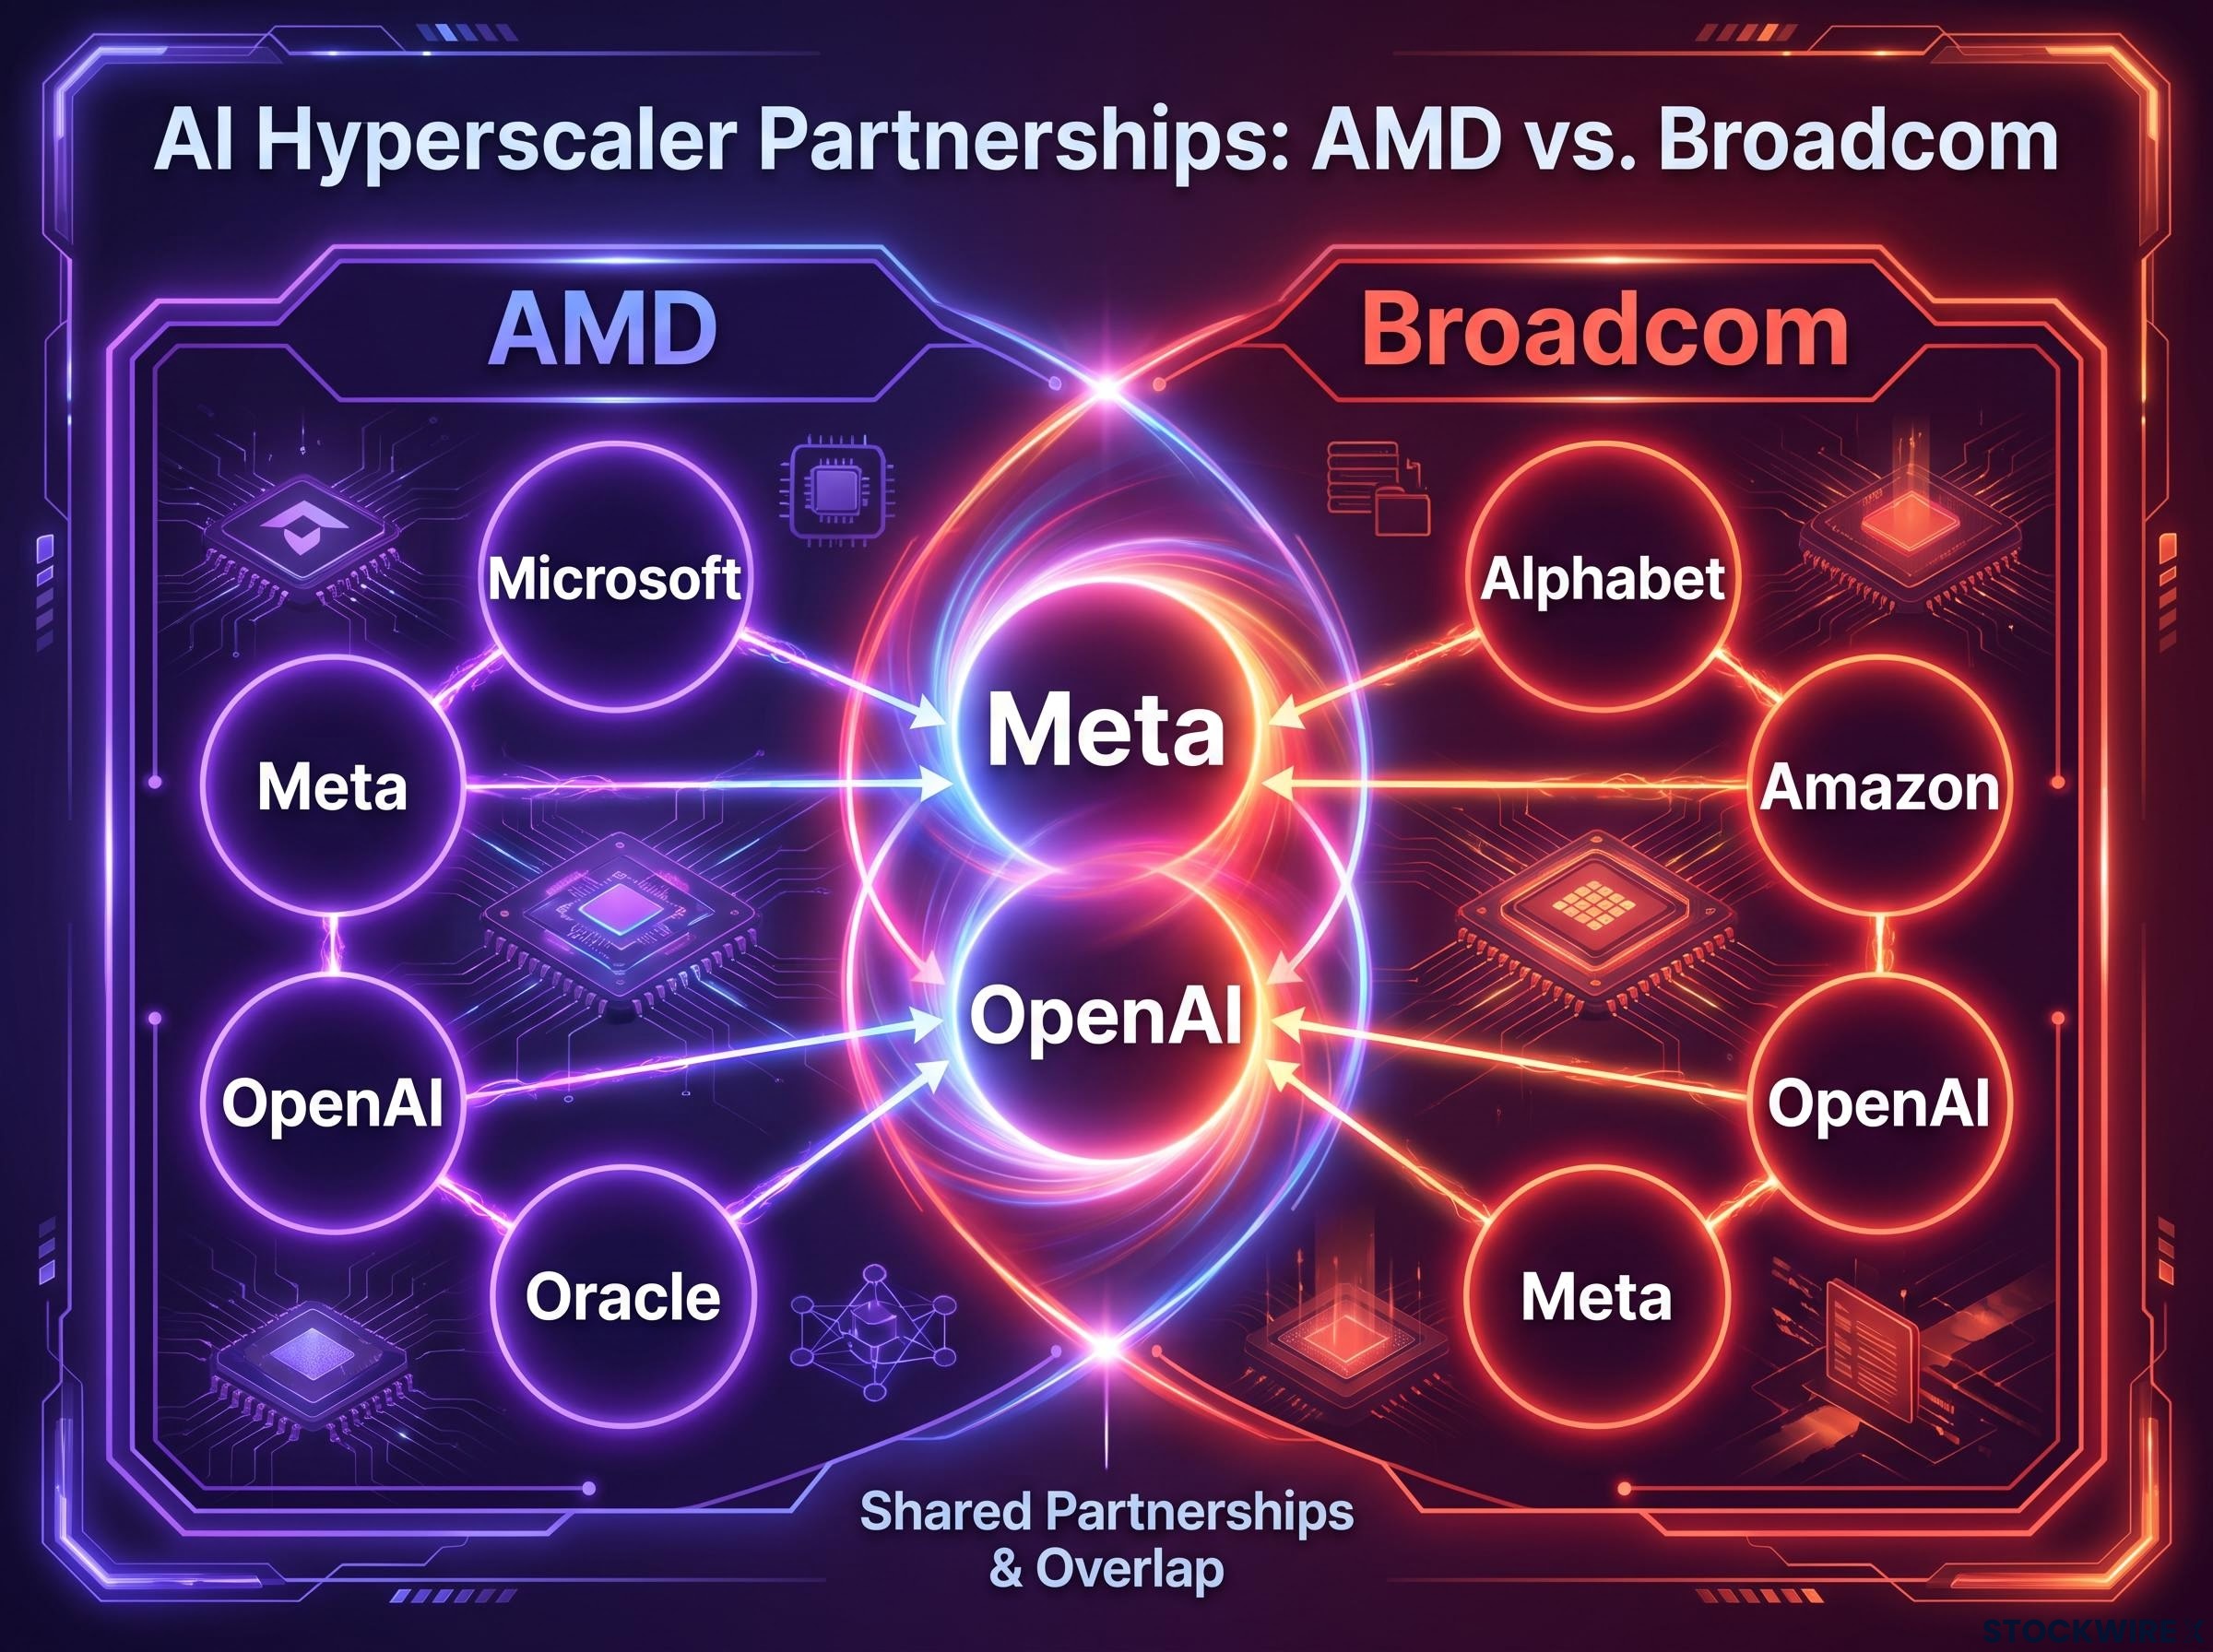
AMD introduced a complete AI rack system in 2026, a fully integrated competitive product that has already secured commitments from:
- Microsoft
- Meta
- OpenAI
- Oracle
Deliveries are scheduled to commence later in 2026. That customer list tells you this is no longer a product announcement risk; the commercial validation is already in place, and shipment timing is the variable to track.
Consensus EPS growth projections stand at roughly 75% for 2026 and approximately 81% for the year after, placing AMD among the fastest-growing names in this group.
Shares trade at a forward P/E of approximately 36.8x against those growth figures, implying a PEG ratio below 1.0. Analysts have set a consensus 12-month price target of around $545 per share, which translates to roughly 10% upside from current levels, the narrowest in this group, which suggests the market has already priced in more of AMD’s near-term trajectory than it has for the other four names.
Broadcom (AVGO): custom silicon for hyperscalers and the networking layer underneath
Rather than selling a single standardised chip to all comers, Broadcom partners with the world’s largest cloud operators to engineer silicon tailored to each client’s specific workload requirements. That model means the company’s revenue is spread across every major hyperscaler rather than concentrated on any one, and its named ASIC partnerships span:
- Alphabet
- Amazon
- OpenAI
- Meta
Beyond custom silicon, Broadcom supplies networking technology used to interconnect large GPU clusters. That dual exposure, custom silicon design plus high-speed networking, covers two of the fastest-growing segments within AI infrastructure from a single stock.
Earnings are projected to grow approximately 67% in the coming year. Against a forward P/E of approximately 19x, that produces the lowest PEG ratio on an absolute-P/E basis in this list. The gap between what the market is paying and what the growth trajectory implies is tighter here than anywhere else in the group.
Last year’s free cash flow came in 22% ahead of the prior period, and the company’s market capitalisation is currently in the range of approximately $1.76-$1.82 trillion as of mid-July 2026.
At a consensus analyst price target of roughly $515 per share, the implied upside from prevailing levels is approximately 35%. Consensus sits in the Buy range.
Because Broadcom’s custom ASIC revenue is contractually tied to hyperscaler AI build-out plans, its earnings visibility is structurally higher than companies selling into spot or open-market demand, making the growth forecast more credible than it would be for a cyclical chip vendor.
The same hyperscaler customers anchoring Broadcom’s ASIC revenue are simultaneously funding their own custom silicon programmes, a structural dynamic that raises the long-term competitive question of whether ASIC design partnerships strengthen or ultimately cannibalise the merchant silicon market.
Taiwan Semiconductor (TSM): the foundry underneath every AI chip on this list
The advanced chips that power AI workloads do not materialise from the designs of Nvidia, AMD, or Broadcom alone. Every one of those designs is handed to Taiwan Semiconductor Manufacturing Company to be physically produced. TSMC holds the leading-edge fabrication capacity that the entire AI chip industry depends upon, which means its revenue grows in step with the sector as a whole rather than with any individual chip architect’s fortunes.
The company’s most recently reported quarterly results showed profits rising by close to 80% year on year, a rate of expansion that implies consensus forecasts for future periods may be underestimating the trajectory.
Revenue grew 38% year-over-year in the most recent reporting period. Profit growth is projected at more than 56% for the current year and approximately 27% for the following year. Against a forward P/E of approximately 18.7x, the implied PEG ratio sits well below 1.0.
The quality behind those numbers matters. TSMC’s operating margin of approximately 56% and free cash flow margin of approximately 26% tell you this is not growth fuelled by margin compression or heavy reinvestment cycles. The company carries a market capitalisation of around $1.8 trillion, and the consensus analyst price target stands at approximately $517 per share, pointing to roughly 30% upside from current levels.
For investors who want AI infrastructure exposure without committing to a view on which chip vendor wins the GPU market, TSMC is the closest thing to an index play within this list. Its earnings outlook does not depend on any single chip architecture winning; it converts the entire sector’s demand into revenue.
Hyperscaler capex flows across multiple hardware categories simultaneously, meaning the $725 billion in 2026 infrastructure commitments does not land uniformly; foundries, memory producers, and networking vendors each capture different proportions depending on where the incremental compute bottleneck sits.
| Company / Ticker | Role in AI Stack | Forward P/E (approx.) | Projected EPS Growth (current year) | Analyst Price Target Upside |
|---|---|---|---|---|
| Credo (CRDO) | High-speed AI networking | ~42-50x | High double-digit to low triple-digit | ~30%+ |
| Marvell (MRVL) | Optical connectivity + custom ASICs | ~30x | ~42% | ~40% |
| AMD | AI accelerators + CPUs | ~36.8x | ~75% | ~10% |
| Broadcom (AVGO) | Custom ASICs + networking | ~19x | ~67% | ~35% |
| TSMC (TSM) | Leading-edge foundry | ~18.7x | ~56%+ | ~30% |
Positioning across the AI stack before the next earnings cycle
The five companies span three distinct layers of the AI infrastructure stack:
- Networking and connectivity: Credo and Marvell
- Custom silicon and accelerators: AMD and Broadcom
- Foundry manufacturing: TSMC
A portfolio containing all five holds positions at each layer without redundant exposure. That structure matters because each layer has different revenue drivers, different client concentration profiles, and different sensitivities to the pace of AI deployment.
The networking, silicon, and foundry tiers covered here represent three of seven AI supply chain layers, and which layer an investor owns determines their moat type, their bottleneck exposure, and how their position performs when the binding constraint in the sector shifts.
Analyst price targets across the five imply upside ranging from approximately 10% (AMD) to approximately 40% (Marvell) from prevailing levels, with the median target implying roughly 30% upside. That spread is itself a signal. Analysts are not pricing in uniform recovery; position sizing and entry sequencing across the stack matters more than treating them as an equivalent basket.
The semiconductor sector bear market is the structural context for the entry point thesis. The investment case rests on the gap between sustained earnings growth trajectories and sentiment-depressed price levels. That gap closes either through price recovery or through earnings revisions downward. Both should be monitored.
PEG ratios below 1.0 are a starting screen, not a sufficient investment case. All forward P/E, EPS growth, and analyst target figures in this article require verification from a live data provider before acting. Estimates shift with each earnings revision, and the next cycle is approaching.
This article is for informational purposes only and should not be considered financial advice. Investors should conduct their own research and consult with financial professionals before making investment decisions. Past performance does not guarantee future results. Financial projections are subject to market conditions and various risk factors.
—