
Why a Rising AUD Is Quietly Eroding Your International ETF Returns
12 hrs ago

Two people earning identical $95,000 salaries, living in the same city, can arrive at a $571,000 net worth gap after just ten years. Not because one earned more. Because of three spending decisions so normalised they barely register as choices. In the United States, the average new vehicle now costs nearly $49,000, mortgage payments for new buyers average close to $1,942 per month, and the personal savings rate sits at just 5.1%. Americans are earning more in absolute terms than prior generations in many cases, yet systematically converting that income into lasting wealth remains difficult. The explanation is rarely income. It is the set of recurring financial behaviours that look like success and function as its opposite. What follows quantifies the precise, long-term opportunity cost of three specific wealth-building strategies gone wrong: vehicle financing, oversized home ownership, and lifestyle inflation, with concrete dollar figures attached to each and a single framework for reversing the pattern.
High income and low net worth coexist far more often than most people expect. The gap between them has little to do with motivation or financial literacy in the abstract. It comes down to the direction money flows each month: toward compounding assets, or away from them into depreciating obligations.
Consider two profiles. Both earn approximately $95,000 pre-tax, yielding roughly $6,000 per month after taxes. Both live in the same city, started at the same point, and faced the same cost environment. The difference is entirely behavioural.
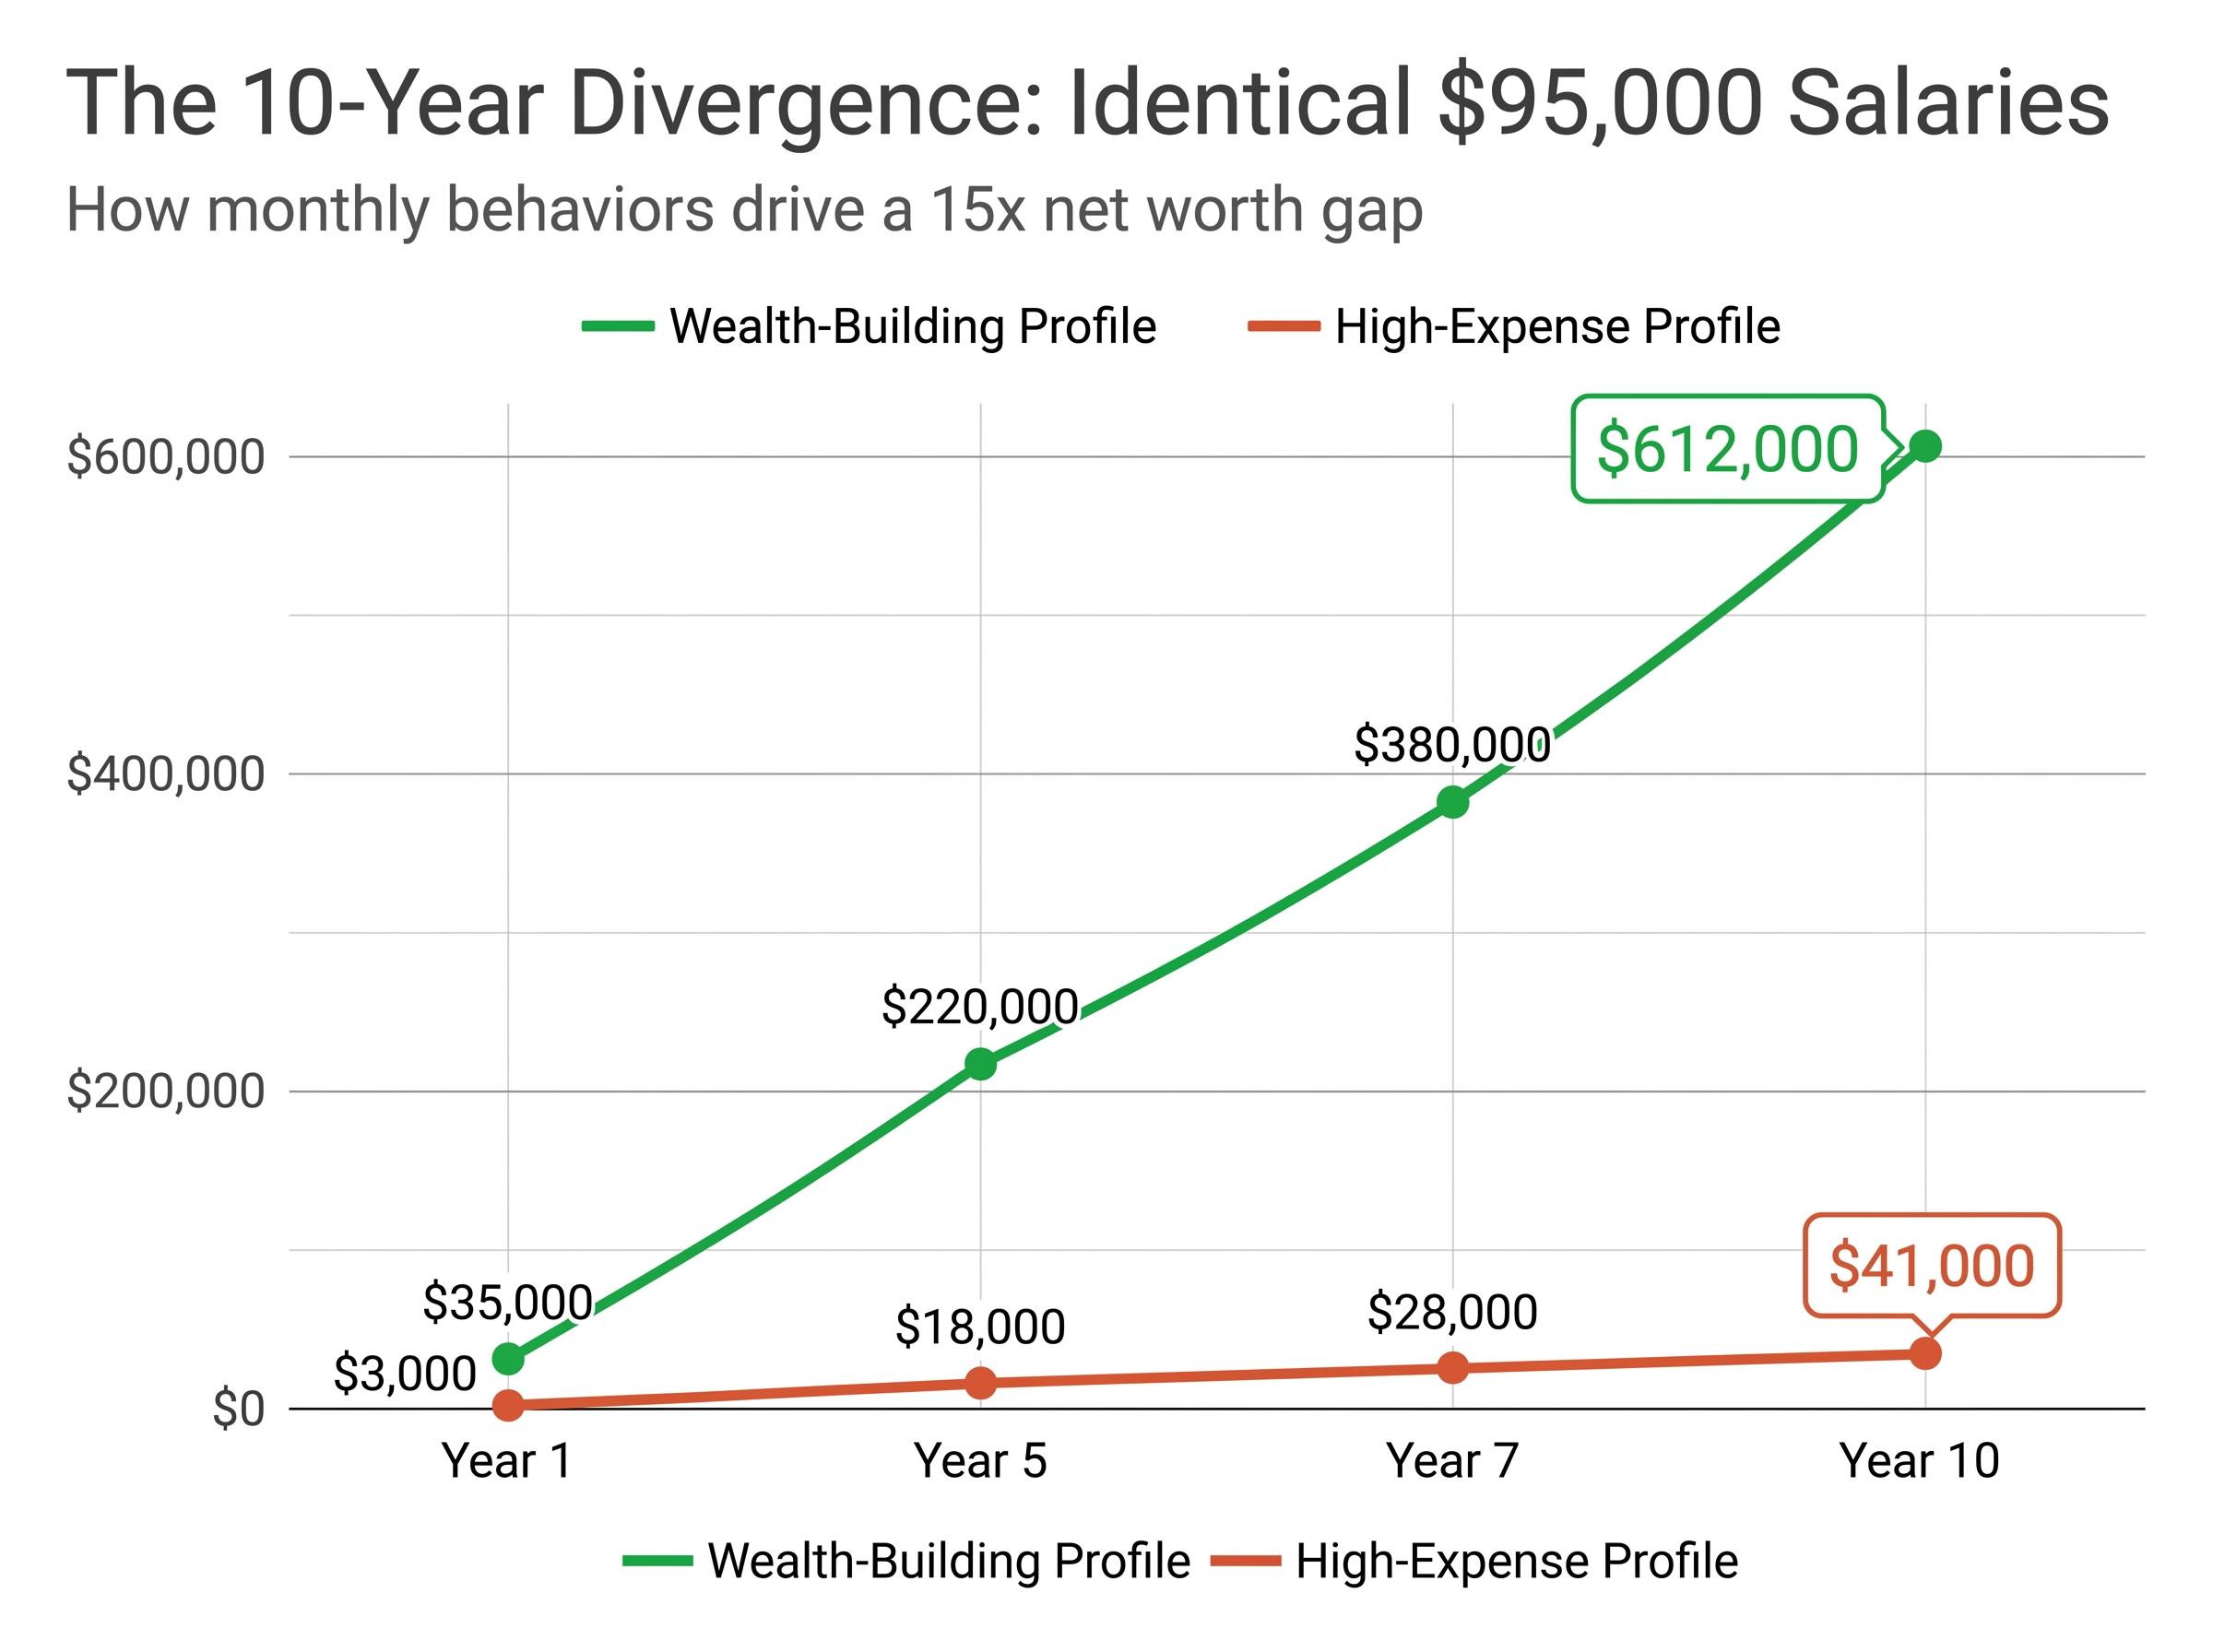
After ten years, the outcomes diverge dramatically.
The high-expense profile holds approximately $41,000 in net worth. The wealth-building profile holds approximately $612,000 in compounding assets. That is roughly a 15x gap from identical starting conditions.
The US personal savings rate in March 2025 stood at 5.1%, with the 2024 average at approximately 4.8%, well below historical norms. The implication is structural: most households are not failing to earn. They are failing to retain. The three behaviours producing that failure are specific, quantifiable, and examined in sequence below.
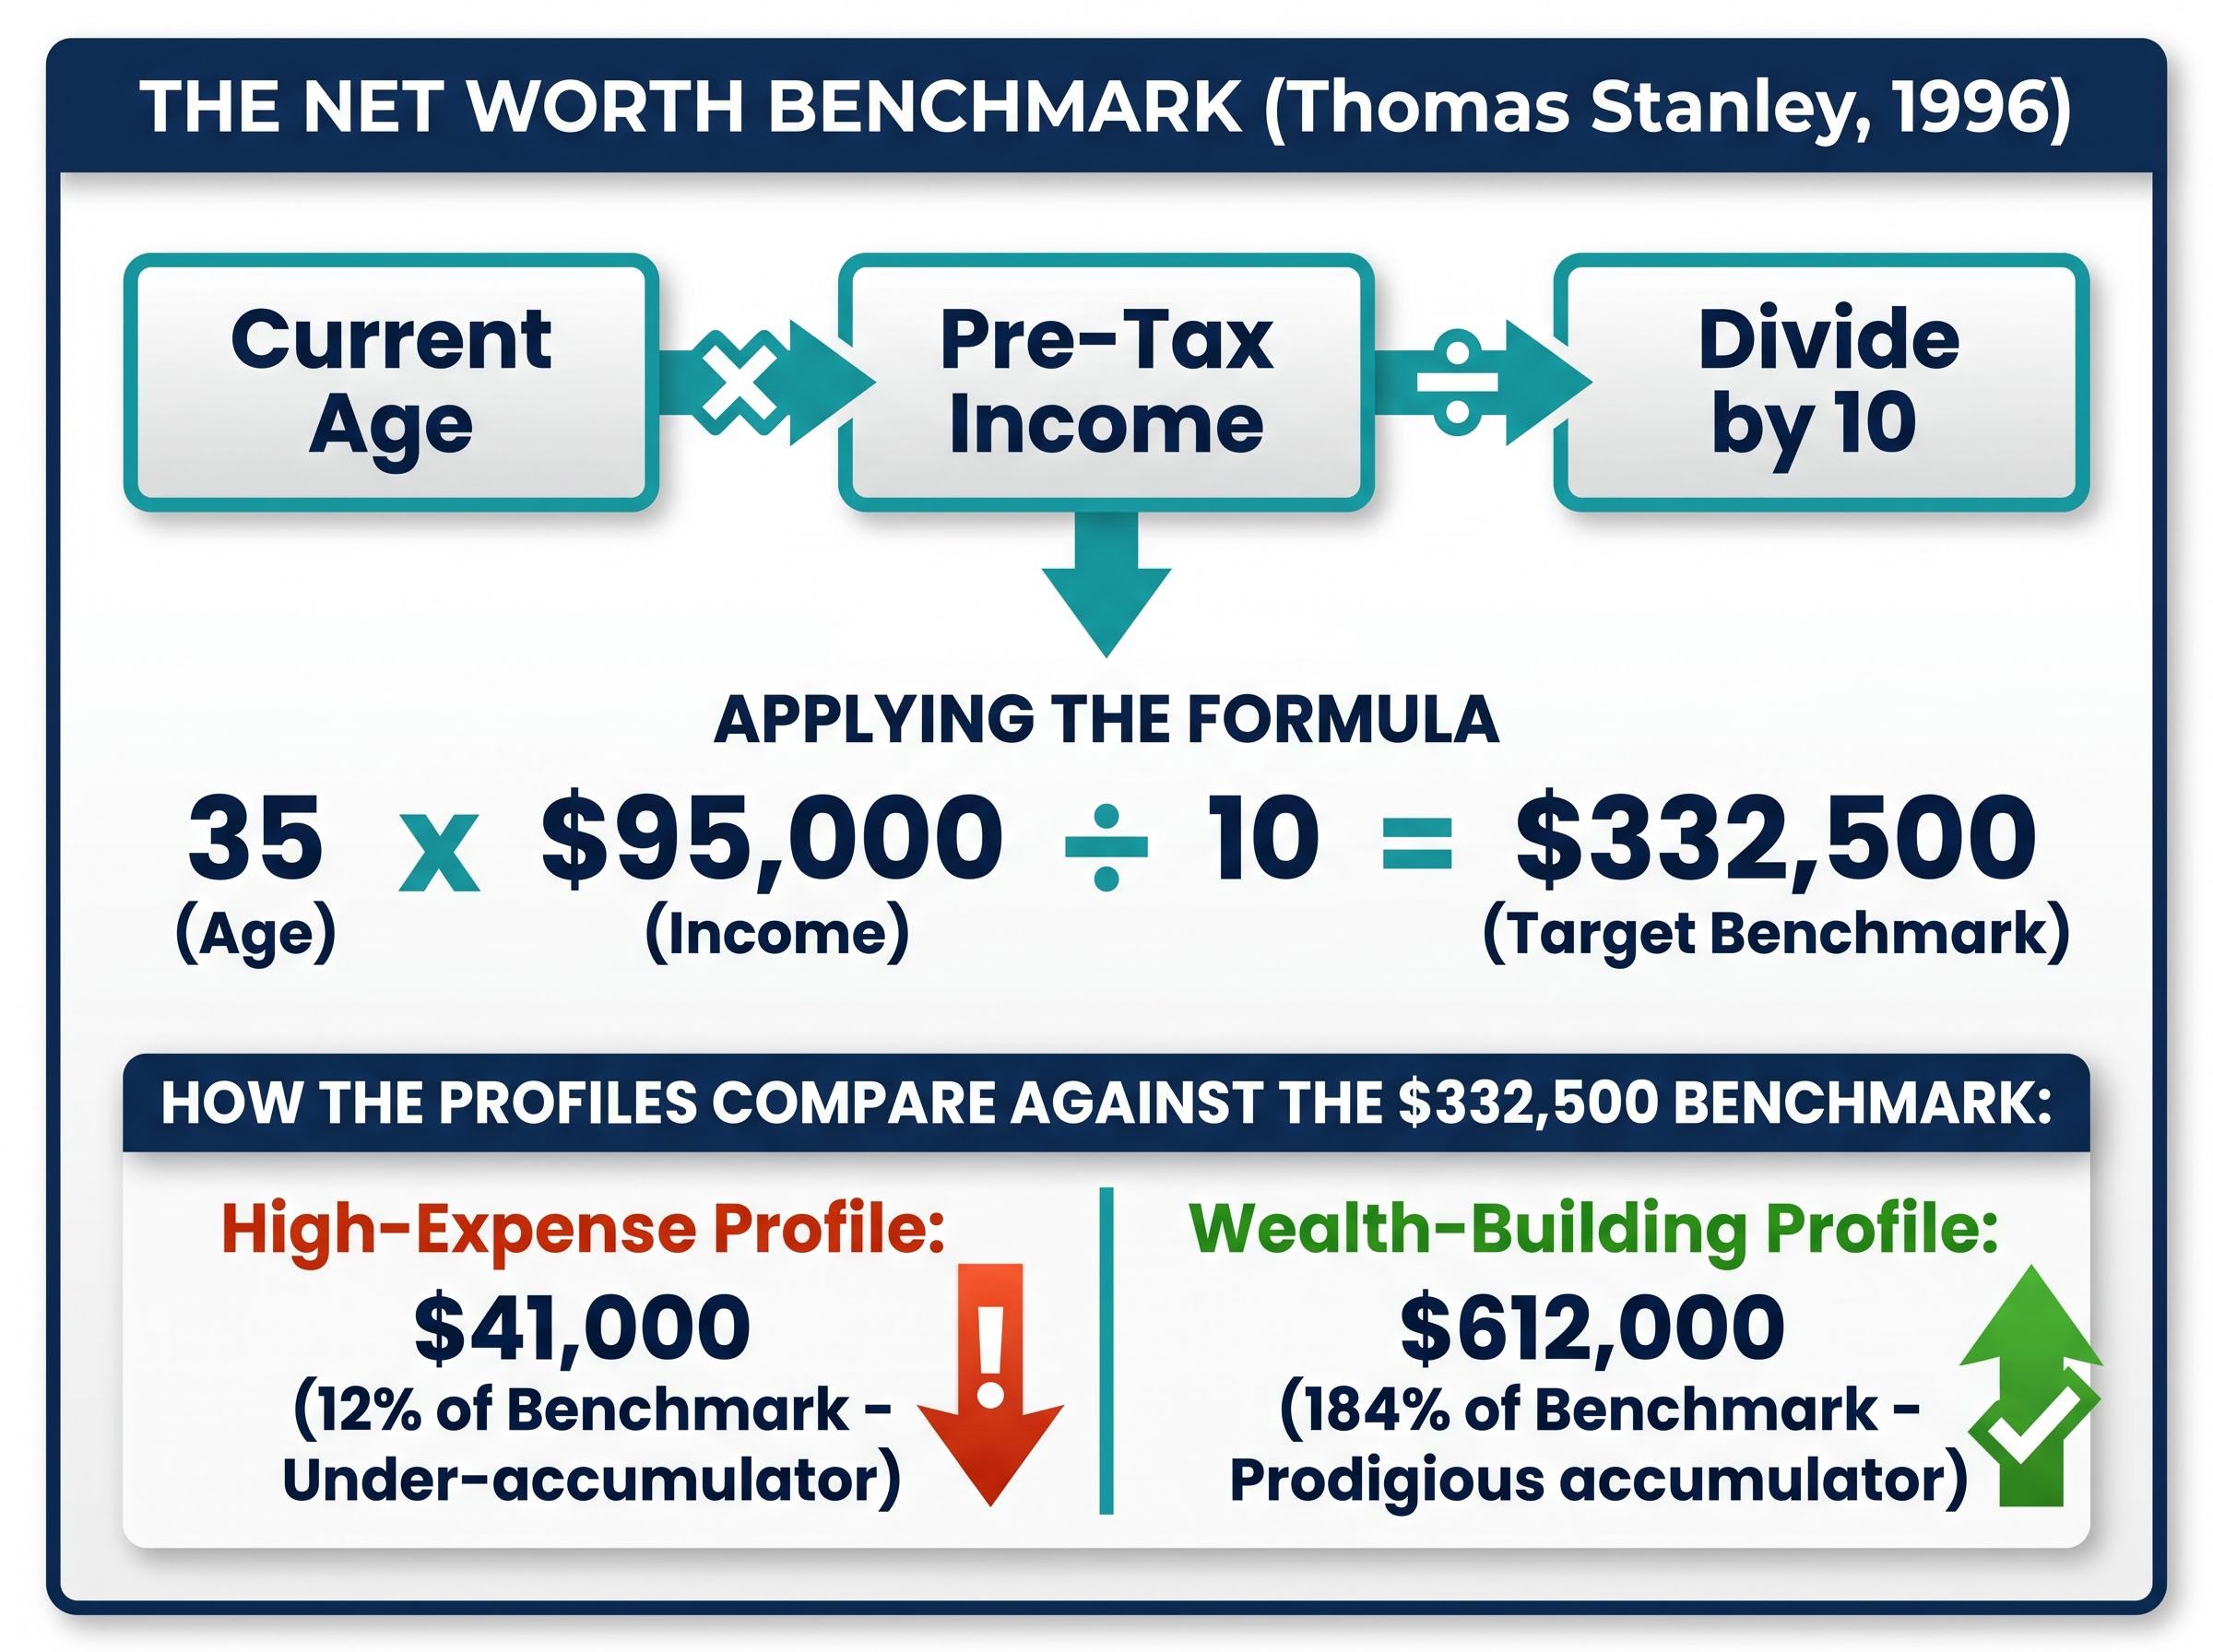
In 1996, researcher Thomas Stanley introduced a net worth benchmark in The Millionaire Next Door that remains one of the most practical diagnostic tools in personal finance. It converts an abstract sense of financial progress into a single number anyone can calculate in under a minute.
The formula works as follows:
The output is the net worth benchmark for someone at your income and age. Those significantly above it are accumulating wealth at an above-average rate. Those below 50% of the benchmark are accumulating the appearance of wealth, not wealth itself.
For a 35-year-old earning $95,000, the calculation produces a benchmark of $332,500. Applied to the two profiles:
The high-expense profile’s net worth of approximately $41,000 represents roughly 12% of the benchmark. By Stanley’s classification, this is a pronounced under-accumulator of wealth, someone whose financial position is dramatically weaker than their income would suggest.
The wealth-building profile’s $612,000 represents approximately 184% of the same benchmark, placing them firmly in the prodigious accumulator category. Same salary. Same city. Same decade. The only variable was where the monthly cash flow was directed.
Before continuing, the calculation is worth running with personal figures. Age, multiplied by pre-tax income, divided by ten. The result either confirms what the bank balance already suggests, or it surfaces a gap that the following three sections explain.
Homeownership can build wealth. Oversized homeownership frequently destroys it. The distinction matters because the financial drag of excess square footage is not concentrated in the mortgage payment alone; it compounds across every category of housing cost for decades.
The average new mortgage payment in 2025 sits at approximately $1,942 per month, with the 30-year fixed rate at approximately 6.37%. Median new home size in 2024 was approximately 2,150 square feet. For buyers who stretch beyond what their income and household size require, the excess costs accumulate across multiple categories:
An oversized home carrying $1,200 per month in excess costs relative to a right-sized alternative accumulates approximately $432,000 in additional expenses over 30 years. Factor in the foregone investment growth on that capital, and the estimated opportunity cost exceeds $1 million.
More than 25 million US households are considered seriously cost-burdened, spending 30% or more of income on housing. Research from the Harvard Joint Center for Housing Studies and the Federal Reserve documents the relationship between housing cost burden and diminished wealth accumulation.
The high-expense profile in this article’s illustration expanded from roughly 1,800 to approximately 3,200 square feet, funding a renovation through a mortgage refinance that increased total debt beyond the original purchase amount. The wealth-building profile chose differently.
Capital committed to a larger down payment is capital removed from compounding investment accounts. An additional $60,000 directed toward a bigger home purchase, if invested instead at historical market rates of approximately 7-10% annualised, could be estimated to reach $325,000 to $525,000 over 25 years.
The wealth-building profile deployed surplus into brokerage and Roth IRA accounts rather than home equity. Over a multi-decade horizon, that choice is where the compounding divergence originates.
A monthly car payment feels ordinary. Nearly every working adult has one. It arrives, it debits, the month continues. Stretch the time horizon, however, and the ordinariness dissolves.
Leased and financed vehicles share a structural flaw: recurring payments directed toward an asset that loses value with each passing month. Leases add a second layer; at the end of each cycle, the lessee holds no equity at all. The vehicle is returned, a new lease begins, and the payment continues indefinitely.
Average new car lease payments ran approximately $613-$659 per month in 2024-2025. Approximately 25% of new vehicles were leased in Q2 2024, and average auto loan interest rates sat at approximately 7.8%. Roughly 42% of households with auto loans spend more than 10% of income on vehicle payments.
A $650 per month lease payment sustained over a 40-year working career totals approximately $312,000 in cumulative nominal payments, for a sequence of assets worth nothing at the end of each cycle.
That same $650 per month directed into an S&P 500 index fund is estimated to grow to between $2 million and $3 million over a comparable retirement horizon, based on historical nominal returns of 9-10% annualised. Current institutional 10-year forecasts are more conservative, clustering around 6.5%, but even at the lower assumption the compounding value dwarfs the cumulative lease cost.
| Monthly Payment | 40-Year Nominal Cost | Est. Investment Value at 7% | Est. Investment Value at 10% |
|---|---|---|---|
| $400 (modest vehicle) | $192,000 | ~$1.05 million | ~$2.1 million |
| $650 (average lease) | $312,000 | ~$1.7 million | ~$3.4 million |
The vehicle decision is not a one-time purchase. It is one of the highest-stakes recurring financial choices a household makes, repeated every three to five years for an entire career.
A raise arrives. Within weeks, spending adjusts upward. A nicer apartment. A better car. Restaurants that were occasional become routine. Each upgrade feels earned, because it is. The problem is not the reward. The problem is that each upgrade converts a temporary income gain into a permanent monthly obligation.
Lifestyle inflation operates when each income increase is matched by a corresponding increase in recurring spending, leaving the savings rate unchanged regardless of earnings growth. The US personal savings rate averaged approximately 4.8% in 2024, a figure that holds remarkably steady across income brackets. High earners, households above $150,000 per year, frequently save less than 10% of income due to status-driven spending patterns.
The mechanism follows a predictable sequence:
A salary increase that generates new recurring expenses is a higher-cost version of the prior financial situation, not genuine financial progress.
The high-expense profile in this article’s illustration tracked precisely this pattern. Vacation spending escalated from approximately $2,000 to $9,000 annually. Home size grew from 1,800 to 3,200 square feet. Vehicle cost rose from approximately $35,000 to $75,000. At no point did a single decision feel reckless. Each was individually justifiable. Collectively, they consumed every dollar of income growth for a decade.
Financial planners widely observe clients automatically scaling spending when income rises, with little or no corresponding increase in savings. Professional athletes provide perhaps the most visible illustration that income level alone cannot prevent the same mechanism from producing bankruptcy, even at the highest earning tiers.
The shift from diagnosis to action requires three steps, taken in sequence rather than selected from a menu.
The wealth-building profile maintained a defined ceiling: a one-bedroom apartment, a paid-off reliable vehicle, and approximately $700 per month in discretionary spending. The monthly surplus of $2,700 was directed toward investments, $1,800 to a brokerage account and $583 to a Roth IRA.
The IRS 2024 401(k) contribution limit stands at $23,000 (with a $7,500 catch-up for those 50 or older). Roth IRA contributions provide tax-free compounding over time. The widely cited CFP-consensus benchmark for long-term wealth building is saving 15-20% of gross income.
At year ten, $612,000 in assets is estimated to approximately double every subsequent decade without additional contributions, based on historical compounding rates. The practical outcome is not frugality. It is financial optionality: the ability to quit a job, take time off, relocate, or take entrepreneurial risk.
| Checkpoint | High-Expense Profile Net Worth | Wealth-Building Profile Net Worth |
|---|---|---|
| Year 1 | ~$3,000 | ~$35,000 |
| Year 5 | ~$18,000 | ~$220,000 |
| Year 7 | ~$28,000 | ~$380,000 |
| Year 10 | ~$41,000 | ~$612,000 |
The three behaviours examined here are not unusual. They are not reckless. They are the default financial trajectory for a majority of American households, normalised through repetition and cultural reinforcement. The wealth-building path requires only one deliberate act: defining sufficiency before income rises.
The compounding projection serves as the clearest illustration. $650 per month redirected from a depreciating lease to an index fund represents a multi-million-dollar lifetime decision, made in a single afternoon. Even under more conservative assumptions (institutional 10-year S&P 500 forecasts currently cluster around 6.5% annualised), the directional argument holds. The gap between investing and consuming compounds in only one direction.
The prize is not deprivation. It is optionality. The ability to walk away from work that no longer fits, to absorb a financial shock without crisis, to fund a transition on personal terms. The written lifestyle ceiling is the mechanism that protects that optionality before the next raise, the next promotion, or the next “you deserve it” purchase erodes it.
The question is not whether the money is there. For most earners, it is. The question is whether “enough” gets defined before circumstances define it instead.
This article is for informational purposes only and should not be considered financial advice. Investors should conduct their own research and consult with financial professionals before making investment decisions. Past performance does not guarantee future results. Financial projections are subject to market conditions and various risk factors.
—
The most effective wealth building strategies involve containing three key expenses: housing costs, vehicle financing, and lifestyle inflation. Directing the resulting monthly surplus toward compounding assets like index funds and Roth IRA accounts is where long-term net worth divergence originates.
The Thomas Stanley net worth benchmark, introduced in The Millionaire Next Door, is calculated by multiplying your current age by your annual pre-tax income and dividing by ten. The result represents the net worth expected of a solid wealth accumulator at your income level and age.
A $650 per month lease payment sustained over a 40-year working career totals approximately $312,000 in cumulative nominal payments on assets worth nothing at the end of each cycle. That same $650 per month invested in an S&P 500 index fund is estimated to grow to between $2 million and $3 million over a comparable horizon based on historical returns.
Lifestyle inflation occurs when each income increase is matched by a corresponding rise in recurring spending, leaving the savings rate unchanged regardless of earnings growth. Because each raise converts a temporary income gain into a permanent monthly obligation, net monthly surplus remains flat and no additional wealth is built.
Financial planners recommend writing a specific lifestyle ceiling document before any income event, defining maximum acceptable costs for housing, transport, and discretionary spending and committing any income above those thresholds to investment accounts. Setting this ceiling in advance prevents automatic spending escalation from consuming new earnings.