Why the US-Iran Deal Won’t Cut Oil Prices Overnight
2 hrs ago
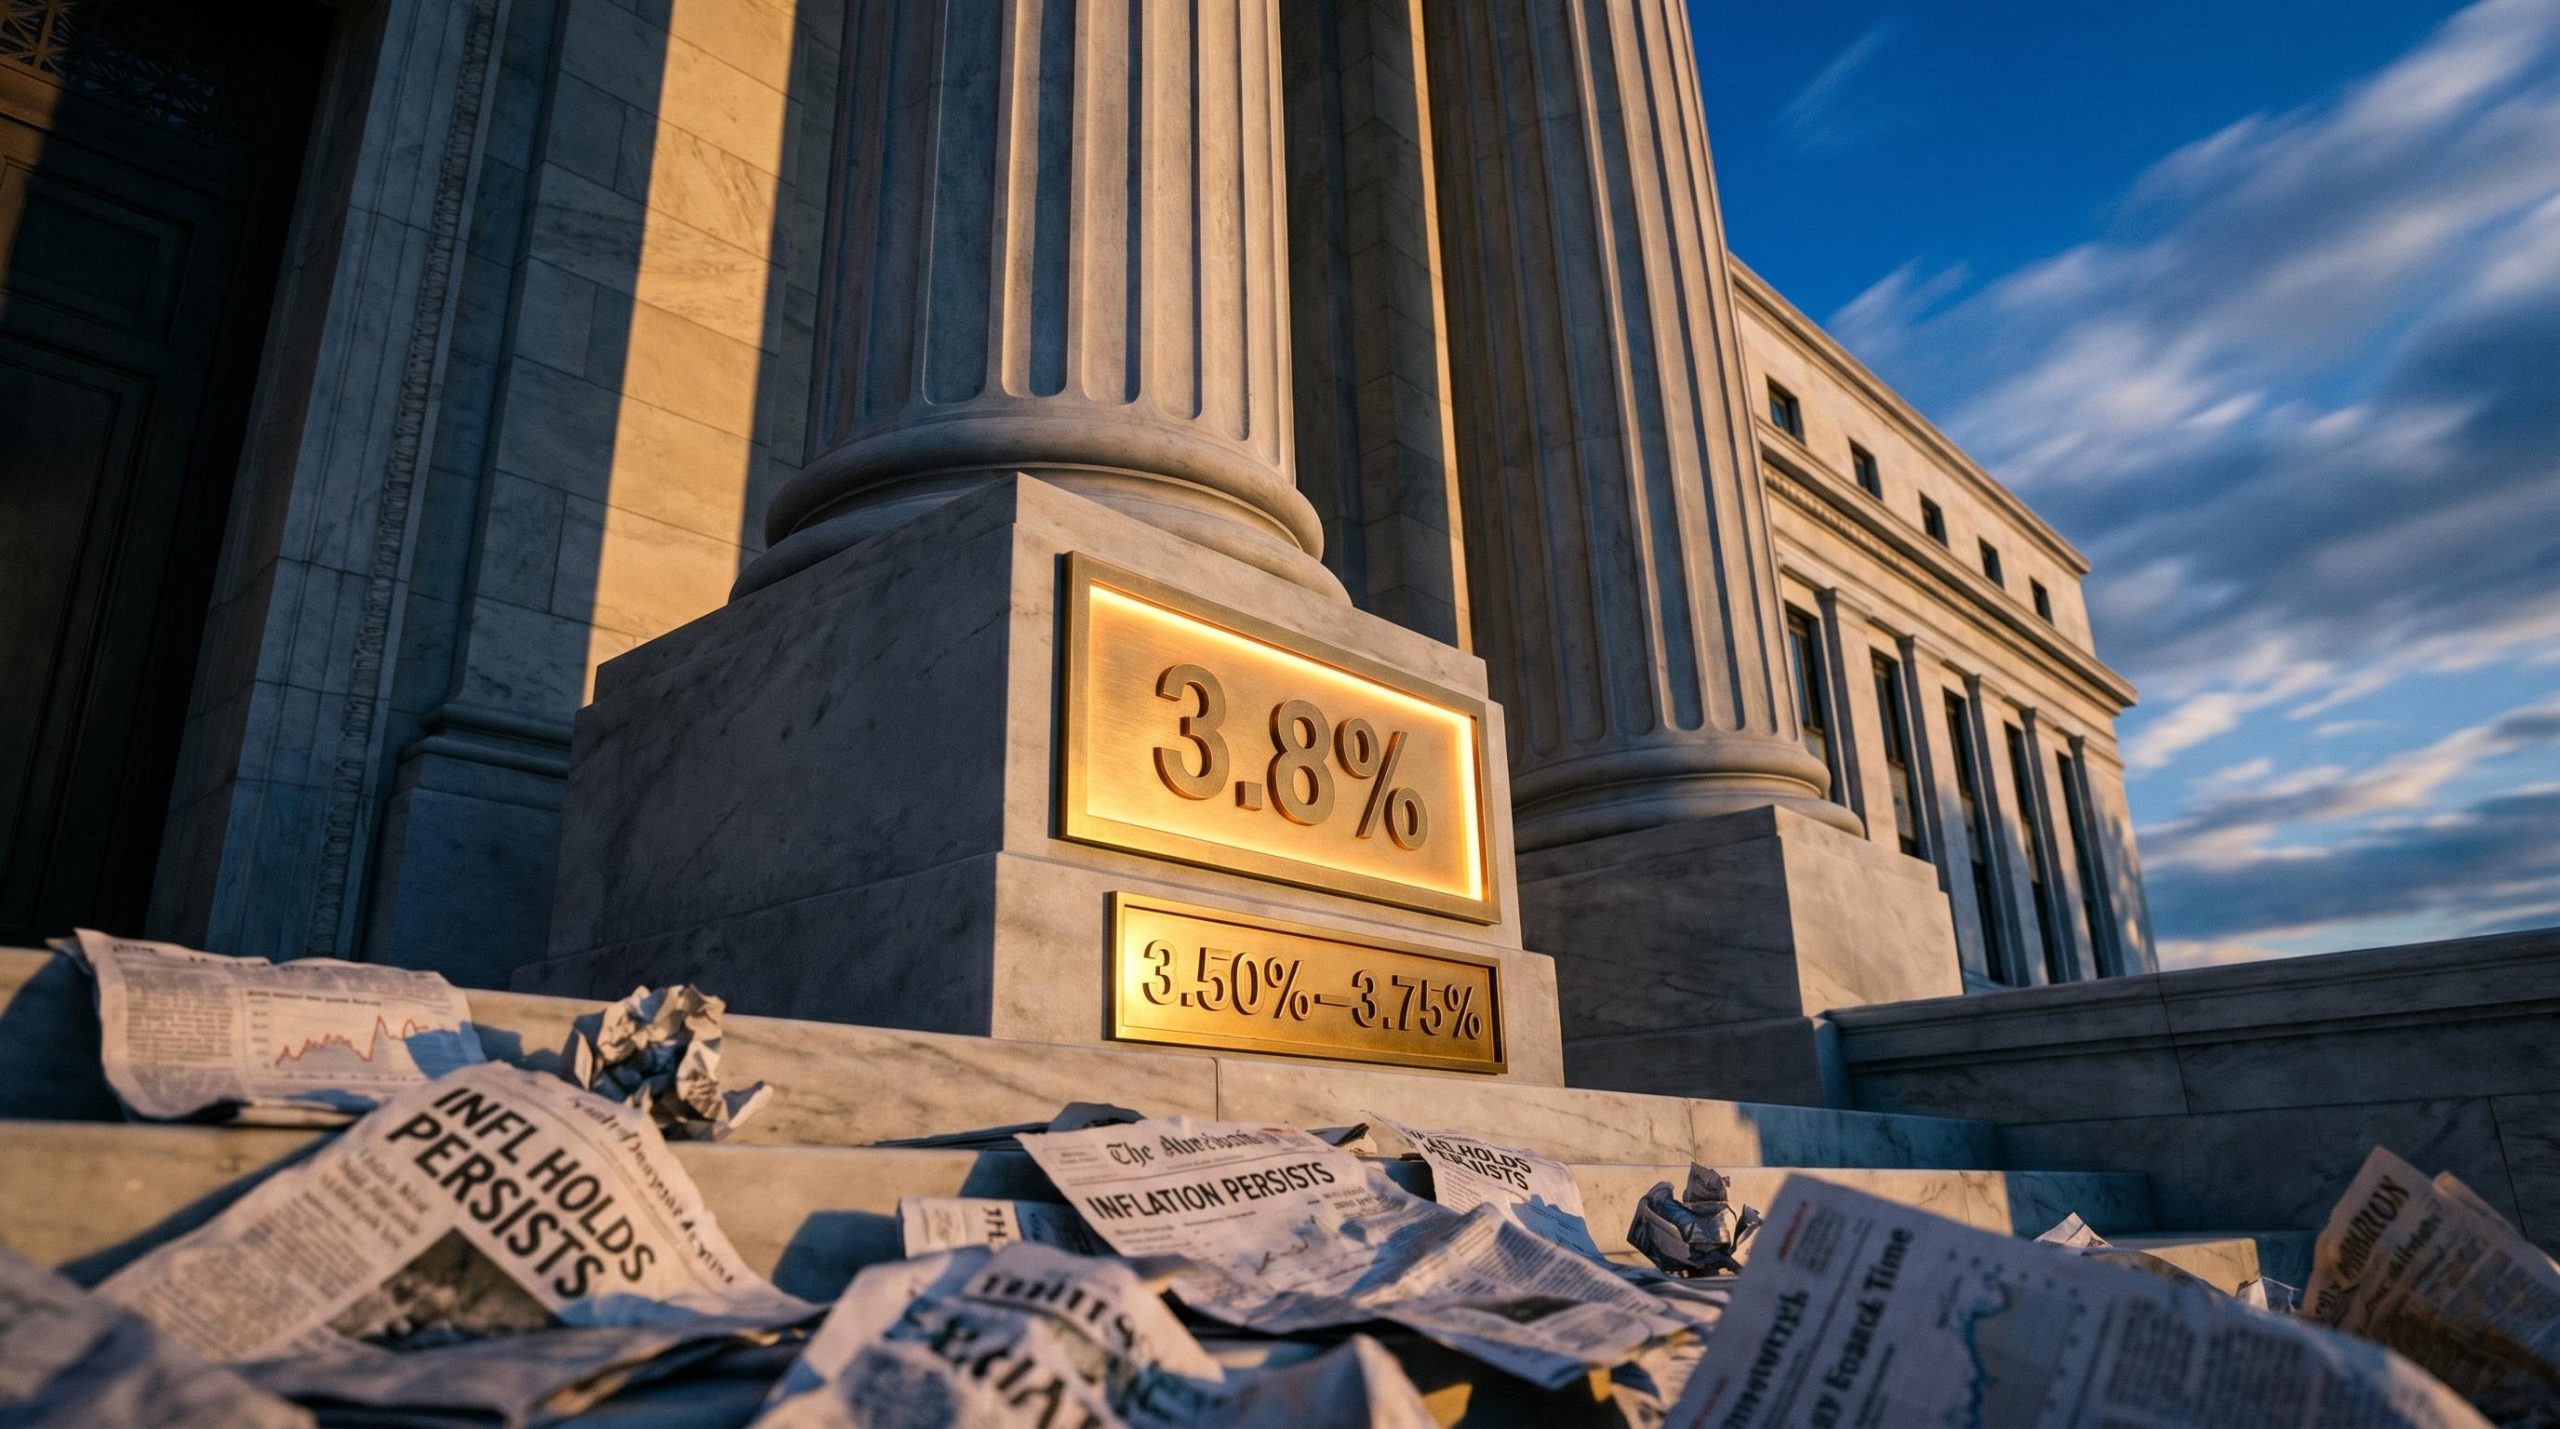
Global equities fell roughly 9% during Q1 2026 as the Iran conflict triggered the sharpest oil price shock in over a decade. By late April, the S&P 500 was trading above 7,200, printing fresh all-time highs with the Strait of Hormuz still partially blocked and a U.S. naval blockade entering its third week.
That sequence is not a contradiction. It is a pattern, one that has repeated across geopolitical crises for decades but continues to catch investors off guard. For those who moved to cash when the conflict escalated in March, the rally did not feel like vindication. It felt suspicious. This analysis uses the April 2026 recovery as a live case study in how markets actually price geopolitical risk, why the instinct to sell during conflict tends to be costly, and what the current data signals for the remainder of 2026. The goal is not reassurance. It is a durable framework for distinguishing between geopolitical events that are merely frightening and those that genuinely alter the economic trajectory driving equity prices.
The timeline tells the story more clearly than any narrative summary can.
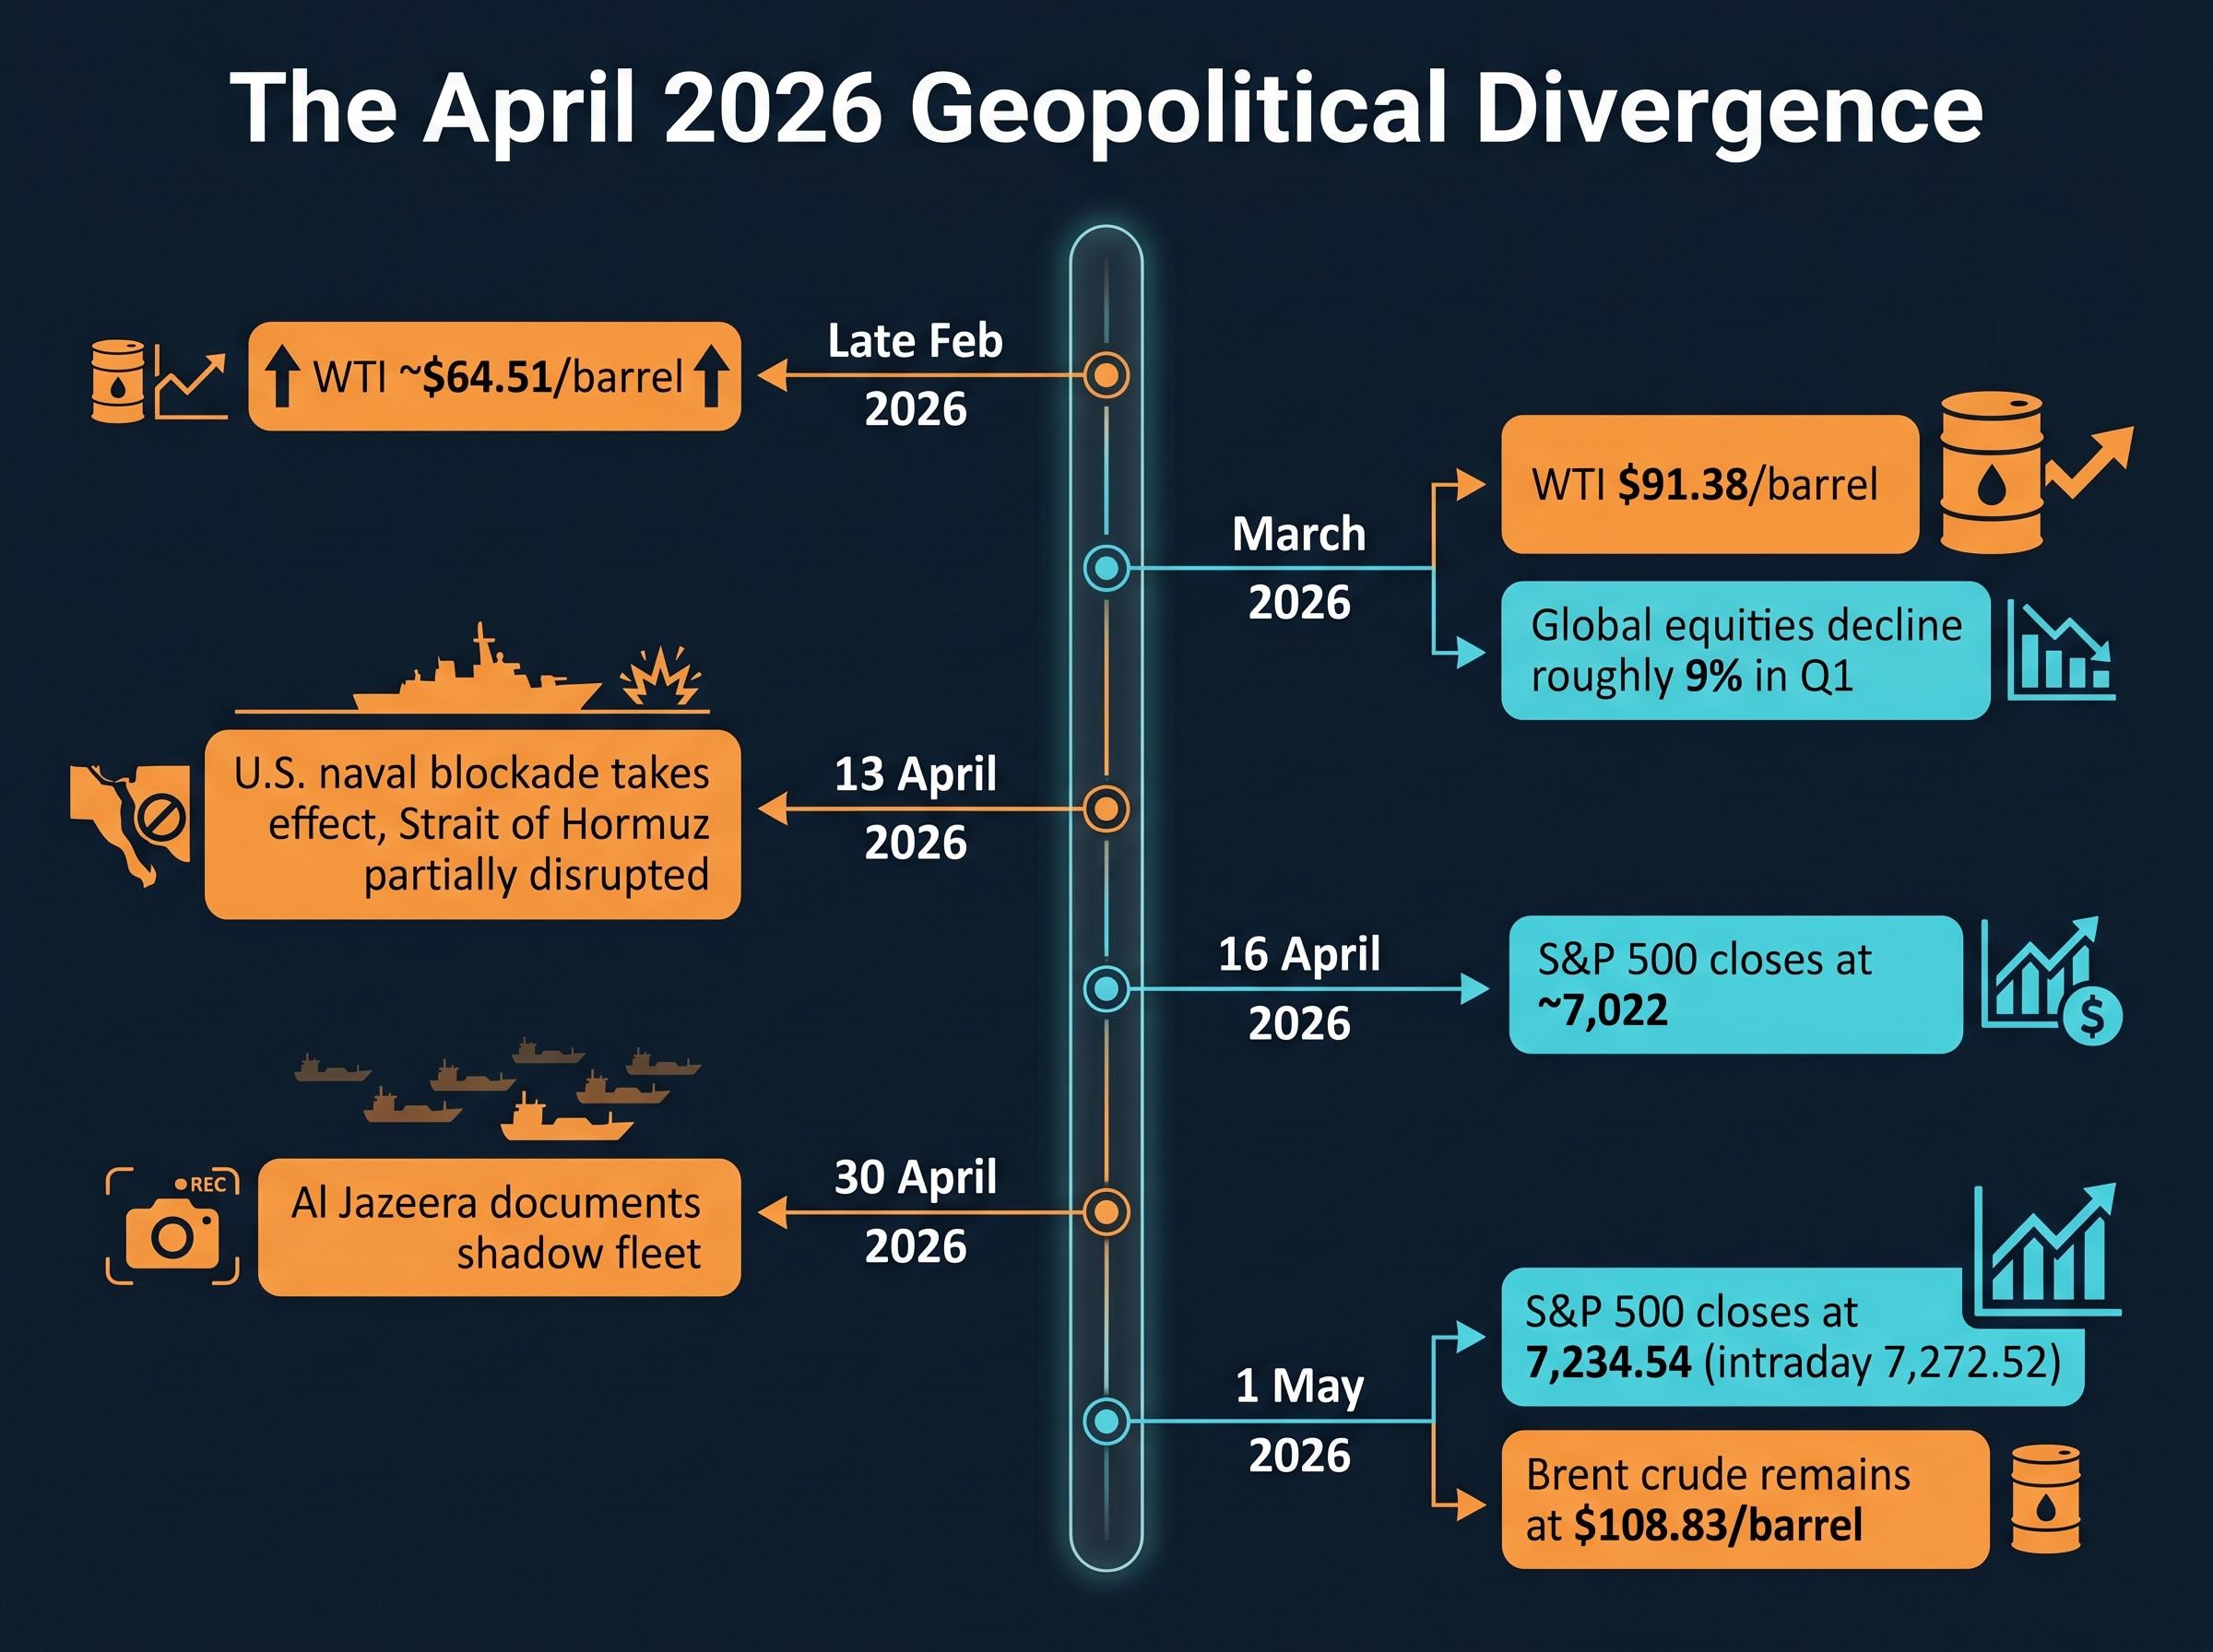
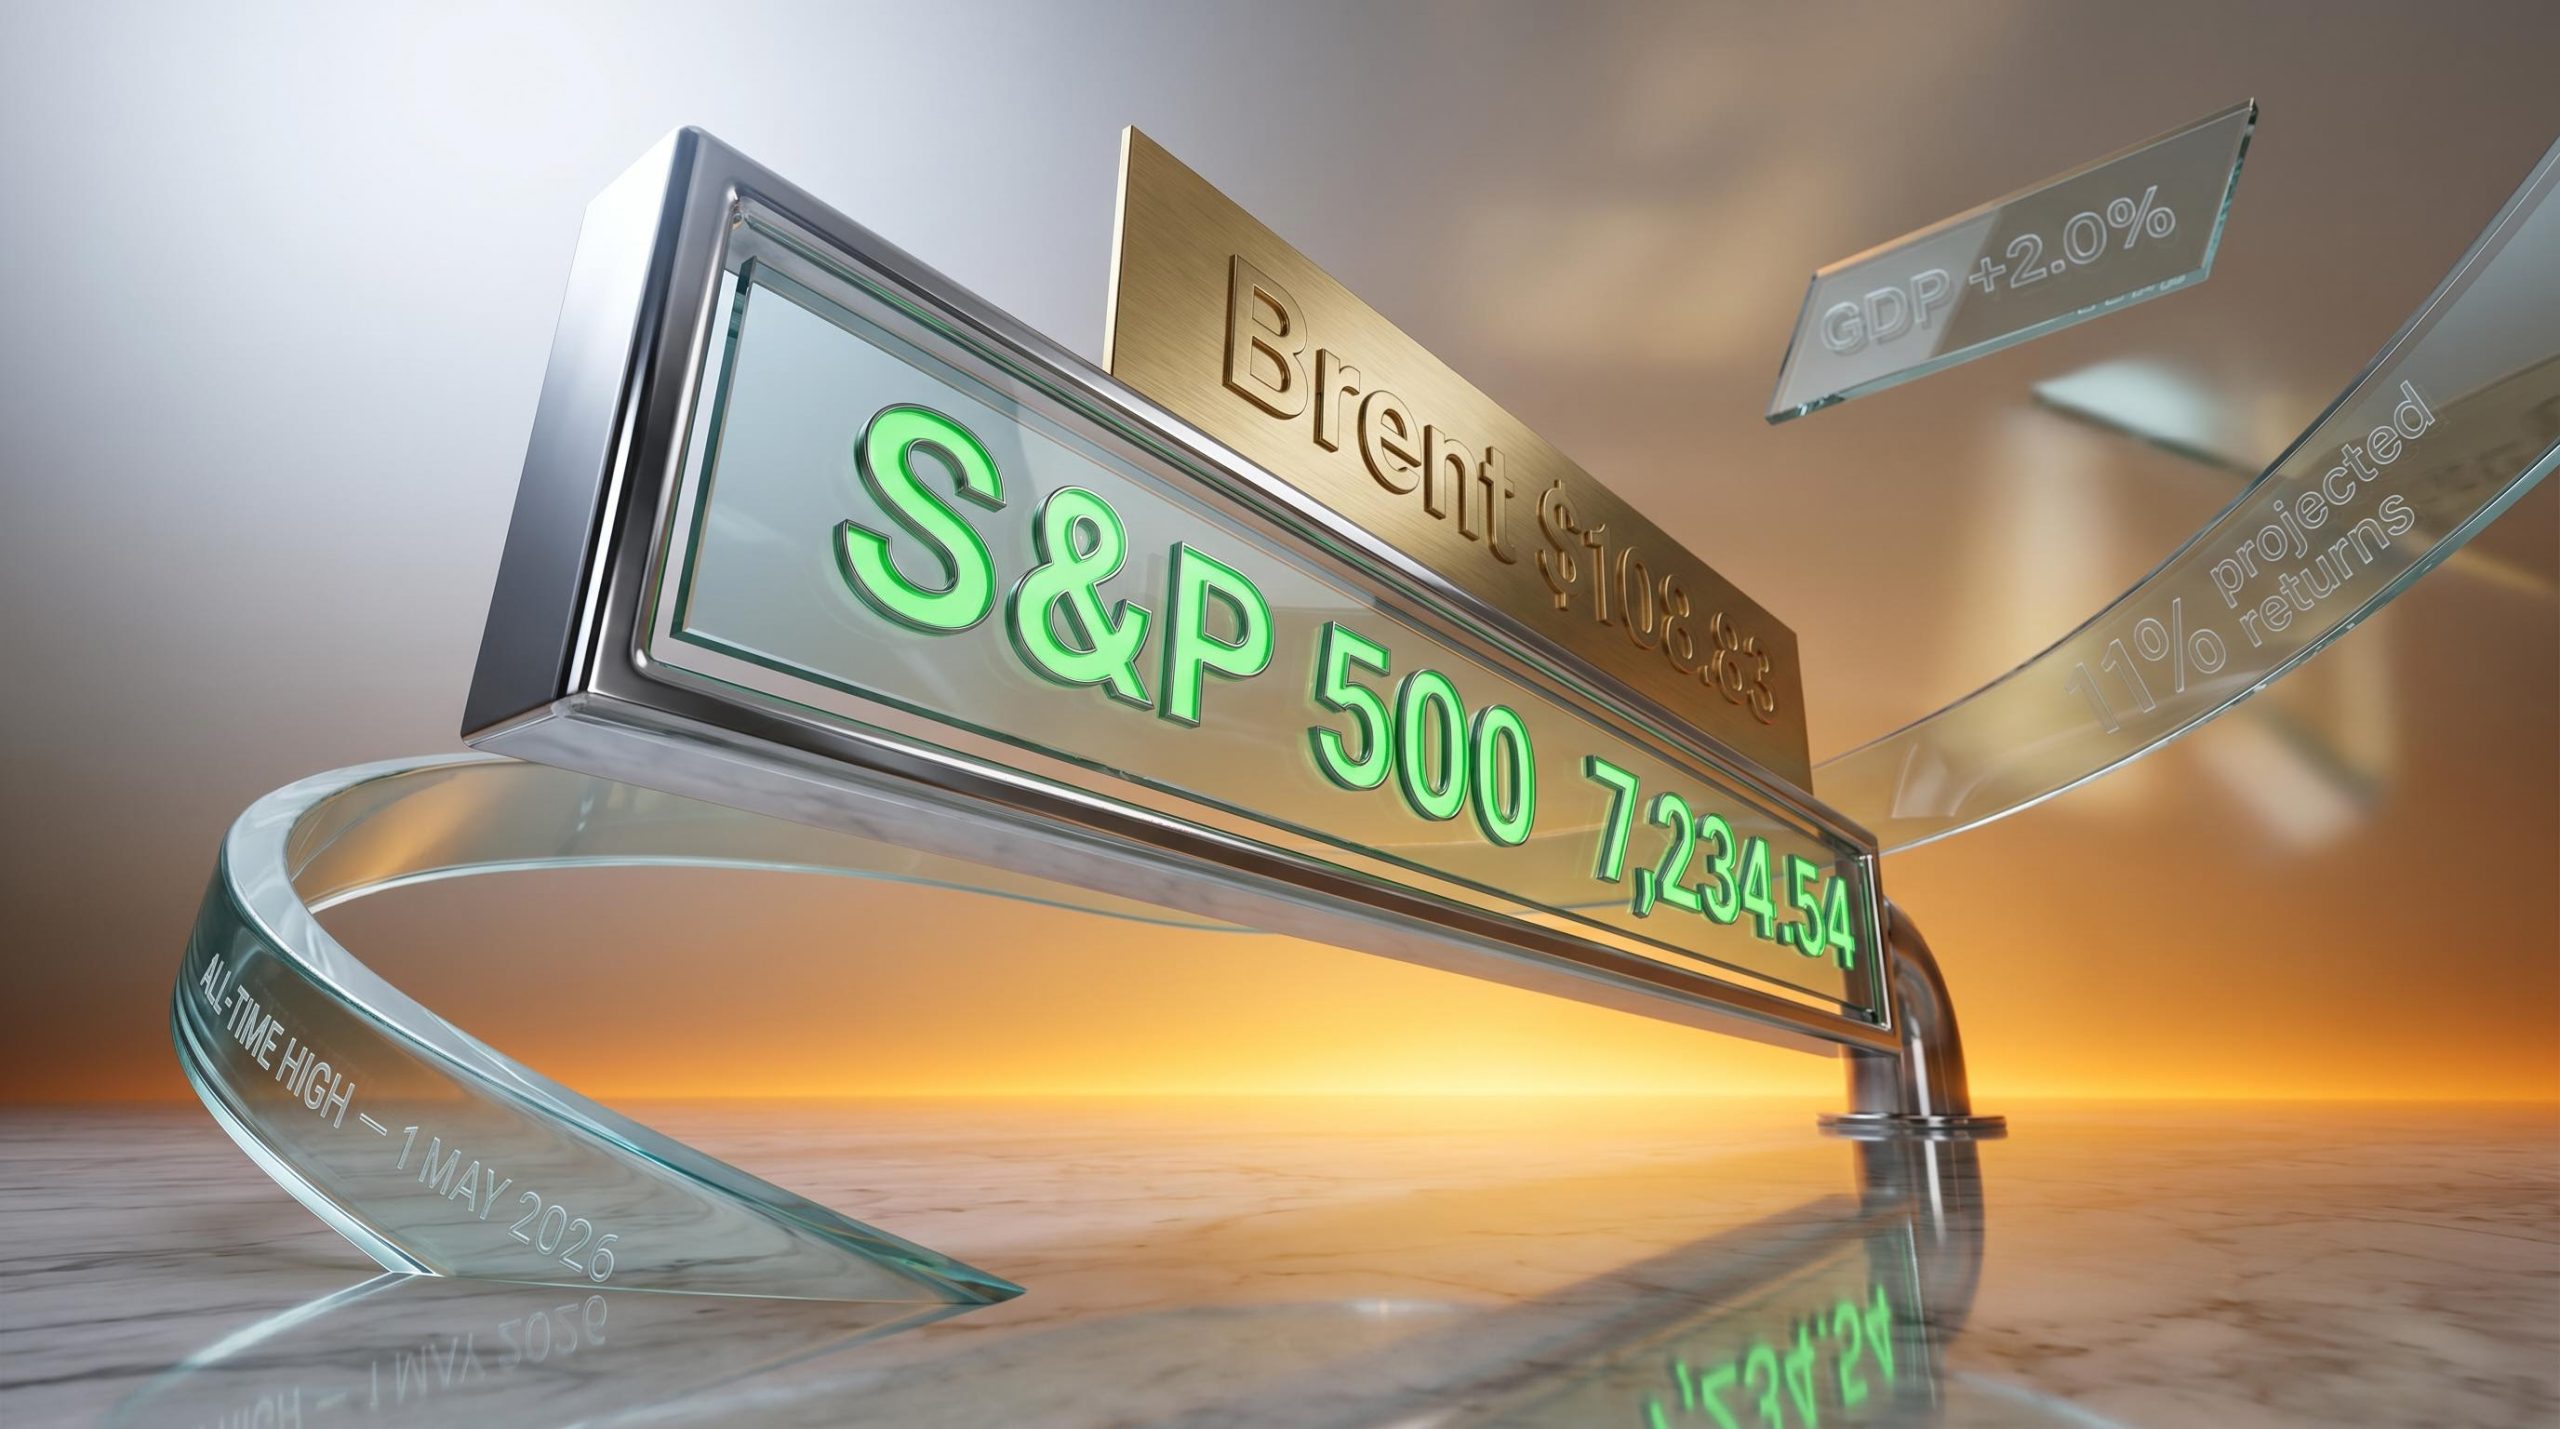
The S&P 500 closed above 7,200 and set a new all-time high while the Strait of Hormuz remained partially blocked, oil sat near $109/barrel, and Iran’s shadow fleet was still operating documented workaround routes.
That final point is worth sitting with. The market did not rally because the conflict resolved. It rallied while the conflict continued, while Iran circumvented the blockade through shadow fleet operations (documented by Al Jazeera on 30 April 2026), and while Brent crude remained more than 60% above its February level. If the underlying threat did not go away, what drove the market higher?
The emotional logic is straightforward: conflict is bad, oil is spiking, shipping lanes are blocked, therefore sell. It is a reasonable instinct. It is also, historically, an expensive one.
Markets are forward-looking discounting mechanisms. They do not wait for resolution; they price in weighted probabilities of multiple outcomes simultaneously. When the worst-case scenario (a full closure of the Strait of Hormuz, a sustained global supply crisis) fails to materialise in full, the probability assigned to that outcome shrinks, and equities reprice upward. The event does not need to end. The market simply needs to assess that the most extreme version of it has become less likely.
The Caspian Pipeline drone strike of late April 2026 reinforced the same mechanism at work in the Iran conflict: probability-adjusted earnings pricing causes markets to absorb localised supply disruptions far faster than headline coverage implies, with the S&P 500 closing near record levels at 7,135 even as 1.7 million barrels per day of Kazakh crude was knocked offline.
A 2024 study published in Finance Research Letters found that geopolitical risk suppresses corporate capital investment efficiency, with firms pulling back on spending during periods of elevated uncertainty. Equity prices, however, recover faster than the underlying investment activity. The implication is that share prices are not ignoring the conflict; they are pricing in a scenario where corporate earnings survive it, even if corporate investment behaviour remains cautious.
Goldman Sachs, in its January 2026 outlook, forecast 11% global equity returns over the following 12 months, driven by profit growth rather than valuation expansion. That forecast was issued after the conflict had already begun. The firm treated the Iran situation as a secondary variable, not a primary risk to the earnings cycle.
Three specific gaps explain why individual investors and markets react so differently to geopolitical events:
The insight from Fisher Investments reinforces this dynamic: pessimistic sentiment itself becomes a positive indicator, because when expectations are sufficiently low, even modest improvements in reality produce upside surprises.
The April 2026 rally belongs to a category, not an anomaly. The pattern has repeated with enough regularity that the surprise, on inspection, lies with the investor rather than the market.
In 2024, the S&P 500 delivered double-digit returns despite sustained headwinds that included recession fears, persistent inflation, U.S. election uncertainty, and multiple geopolitical tensions. J.P. Morgan’s review of that year documents the pattern explicitly: markets climbed a wall of worry because the underlying earnings cycle remained intact.
Sixty years of S&P 500 data on stock market during conflict behaviour show a consistent three-phase pattern in which Phase 3 recoveries begin before hostilities formally end, establishing a strong historical base rate for why record highs during active fighting are unremarkable rather than complacent.
Goldman Sachs frames the current environment as late-cycle optimism following the post-Covid recovery, with 9% price gains and 11% total returns projected into 2027. The firm sees no significant bear market absent a recession, even amid elevated valuations and active Middle East conflict.
Goldman Sachs projects 11% total equity returns into 2027, driven by profit growth. The Iran conflict was treated as a secondary variable in that forecast, not a primary risk.
DJE Kapital observed in April 2026 that negative sentiment and cautious positioning during March had created conditions for precisely the kind of sharp recovery that followed. When investors are already positioned defensively, the bar for positive surprise drops.
The fear that conflict in the Middle East will trigger a 1970s-style oil crisis remains one of the most persistent anchors in investor psychology. Yet as Fisher Investments has noted, modern economies are structurally less dependent on OPEC oil than they were during the 1973-1974 Arab embargo. The following episodes all generated sustained anxiety without derailing equity advances:
In each case, the market priced the disruption, absorbed it, and continued higher once the earnings trajectory held.
The UAE’s withdrawal from OPEC on 29 April 2026 arrived as a headline that looked alarming in isolation: a top-four producer exiting the cartel during the most significant oil supply disruption in years. In structural terms, the move told a different story, one that reduces rather than amplifies long-term supply concentration risk.
Post-UAE exit, OPEC’s share of global crude production falls to approximately 26%, down from 30%.
That decline matters. OPEC’s pricing power has been eroding for decades as non-cartel production has risen. The United States now accounts for approximately 22% of worldwide crude output, positioning it as the primary swing producer in a market where the cartel’s ability to dictate prices is materially weaker than during its 1970s-1980s peak.
EIA data on U.S. crude production dominance confirms the United States has surpassed every other country in recorded history for crude output, with the U.S., Russia, and Saudi Arabia together accounting for roughly 40% of global supply, a concentration that substantially limits any single cartel’s ability to dictate global prices.
| Oil supply source | Approximate global share (%) | Key change since 2026 conflict onset |
|---|---|---|
| OPEC (post-UAE exit) | 26% | UAE departure reduced cartel share by ~4 percentage points |
| United States | 22% | Positioned as primary swing producer; output rising in response to elevated prices |
| Non-OPEC combined | 74% | Alternative supply routes developing; non-Persian Gulf producers increasing output |
DJE Kapital noted that U.S. markets have been less impacted than Europe and Asia due to lower Middle East energy dependence, and flagged AI/tech and energy sectors as promising regardless of the conflict’s trajectory. The broader adaptive response, including non-Persian Gulf producers raising output, alternative shipping routes developing, and Iran’s own shadow fleet partially offsetting the blockade, demonstrates the structural flexibility that limits the economic transmission of even severe regional disruptions.
The record highs were not a triumph of sentiment over reality. They reflected actual economic data that the conflict narrative obscured.
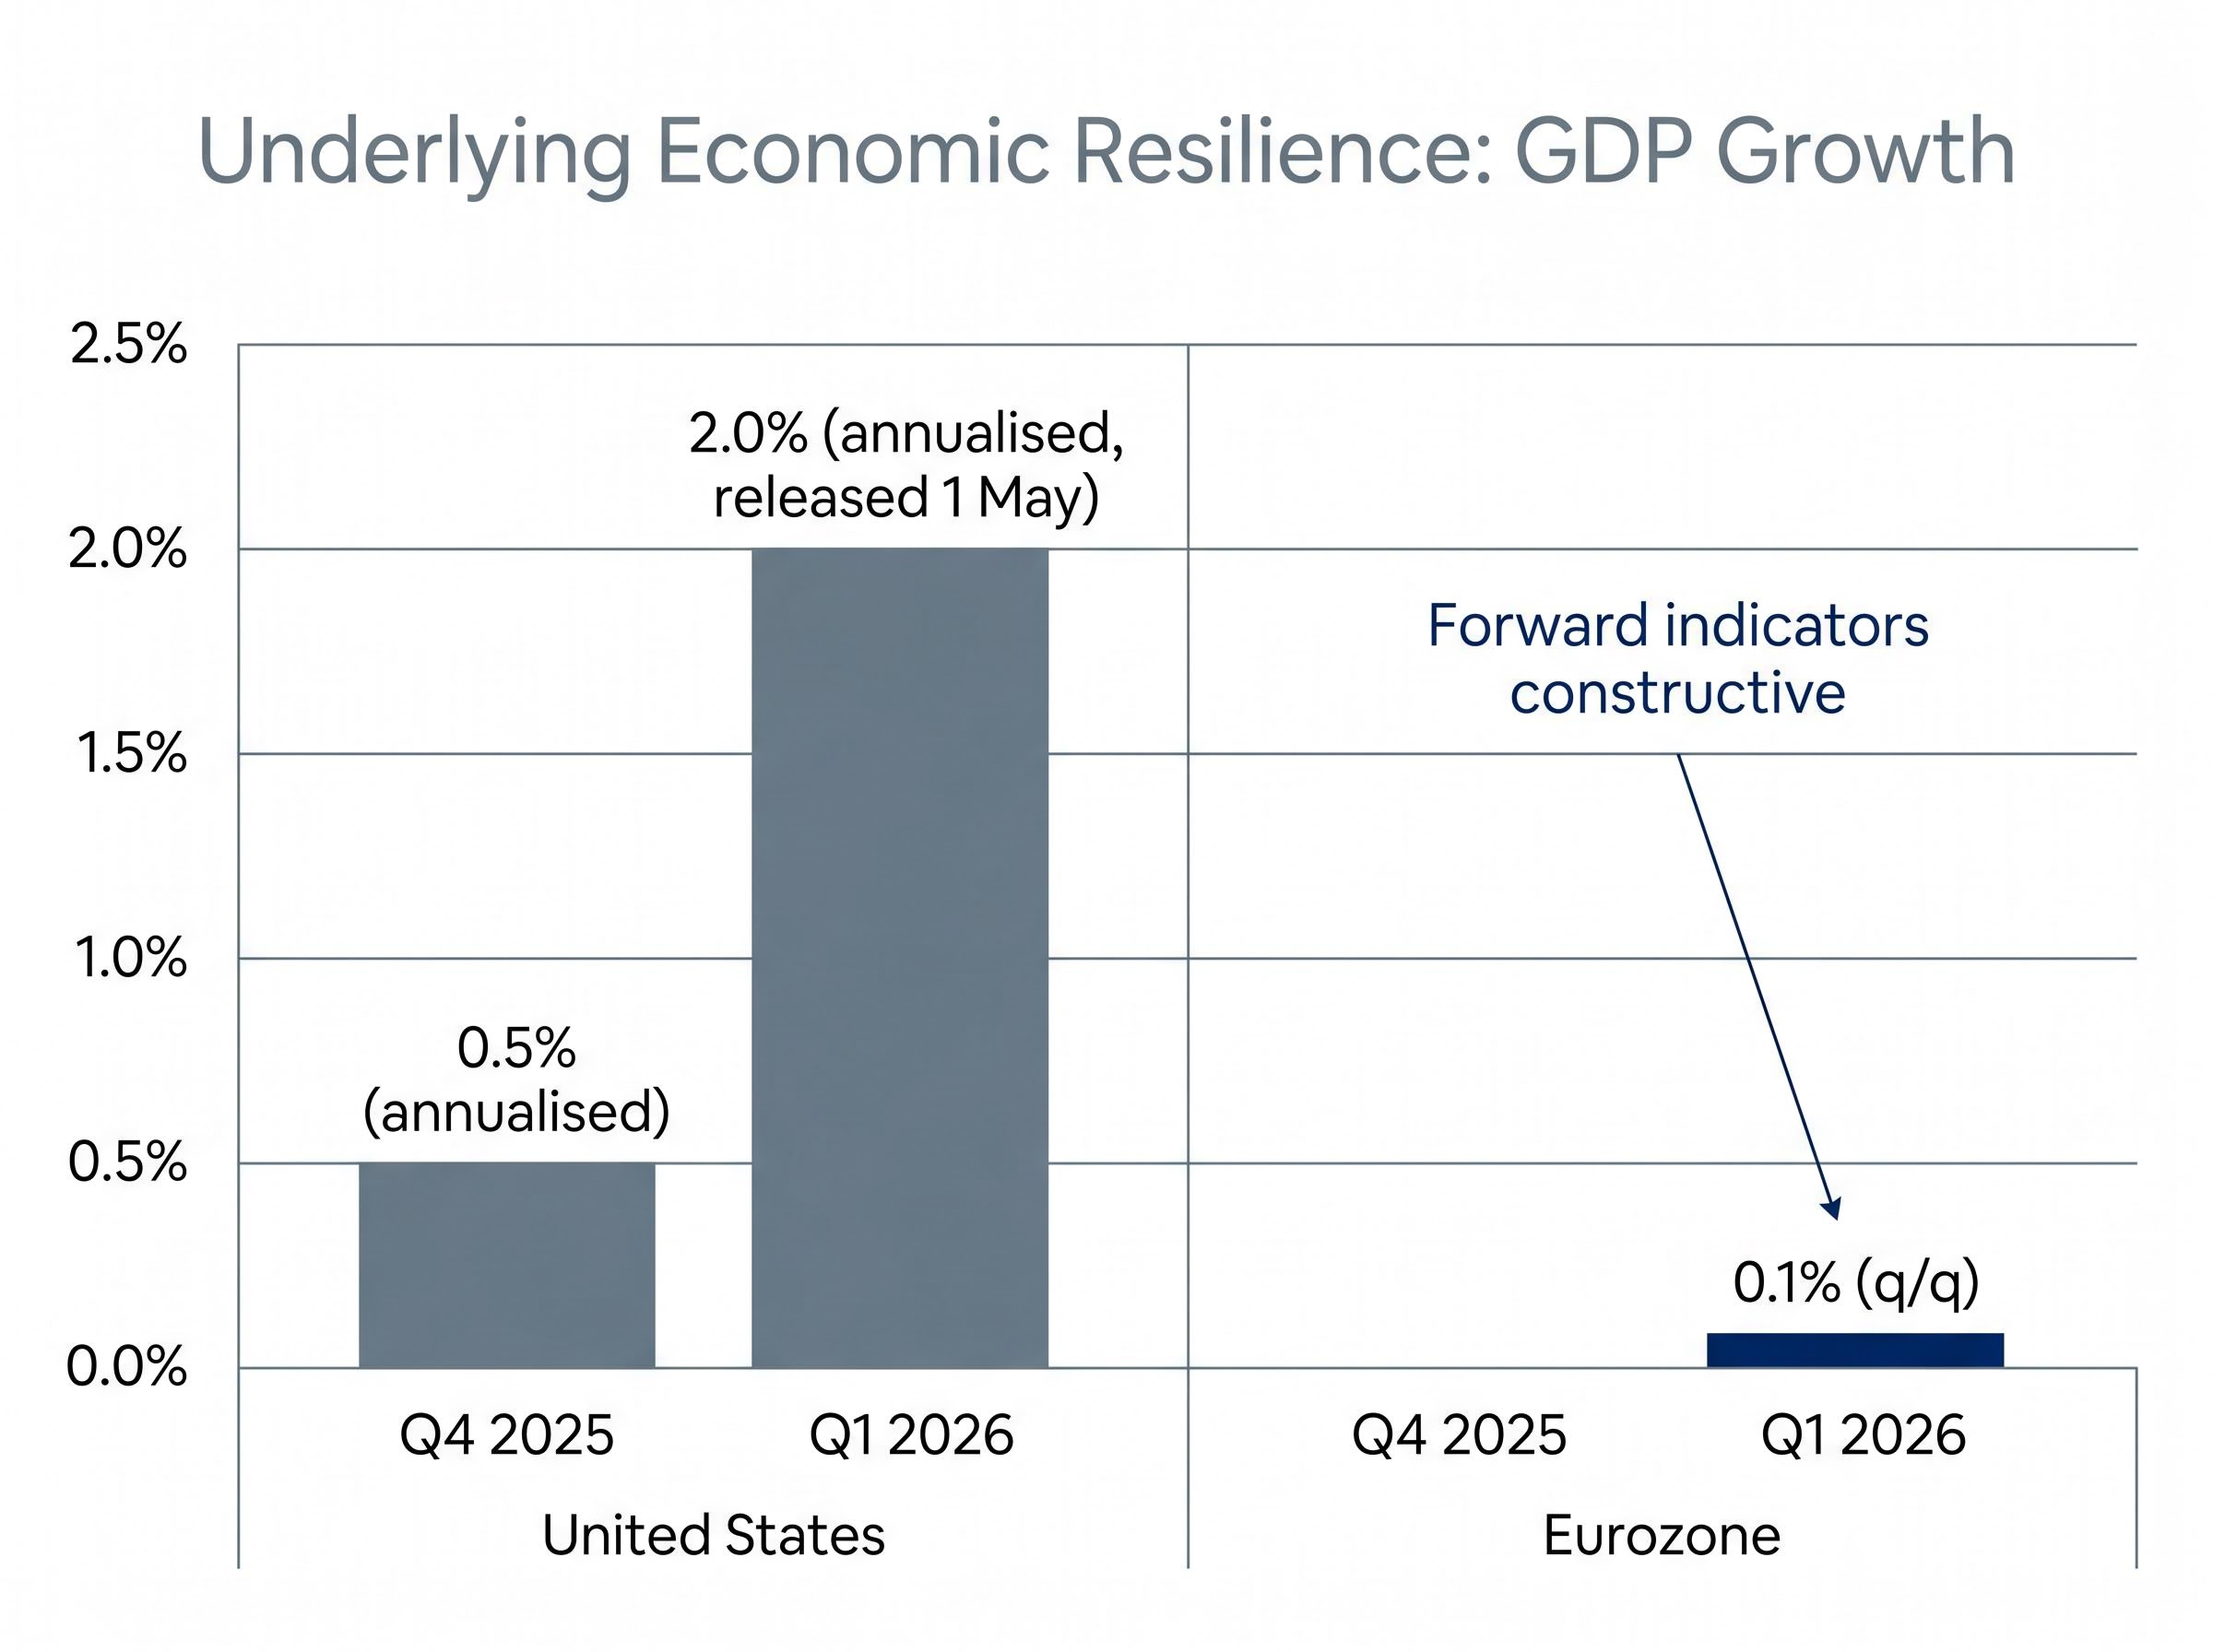
U.S. GDP grew at an annualised pace of 2.0% in Q1 2026, accelerating from 0.5% in Q4 2025, according to the initial estimate released on 1 May 2026. Business investment and consumer spending both contributed to the expansion, indicating that the economic recovery was broadening even as the Iran conflict dominated headlines. The Eurozone expanded by 0.1% quarter-over-quarter in Q1 2026, below analyst forecasts but consistent with forward-looking indicators (yield curve slope, lending growth) that suggest the regional picture is more constructive than sentiment implies.
| Region | Q4 2025 GDP growth | Q1 2026 GDP growth | Key driver |
|---|---|---|---|
| United States | 0.5% (annualised) | 2.0% (annualised) | Business investment and consumer spending |
| Eurozone | Modest positive | 0.1% (q/q) | Below forecast; forward indicators more constructive |
Equity markets reached record highs before these GDP figures were released, reinforcing the forward-looking discounting mechanism described earlier. Markets were not reacting to the data; they were anticipating it. Goldman Sachs attributed equity gains to profit growth rather than valuation expansion, and corporate earnings expectations improved from conflict-onset levels across the U.S., Europe, and globally:
T. Rowe Price’s 2026 outlook identified broadening equity leadership driven by AI adoption, fiscal stimulus, and reindustrialisation themes, factors that operate independently of the geopolitical cycle and provide structural earnings support.
The April 2026 recovery offers more than a retrospective. It provides a diagnostic framework that applies to future geopolitical episodes, regardless of the specific actors or geography involved.
The first step is recognising the asymmetric cost structure of excessive caution. The downside of being too defensive during a continuing bull market is real and permanent: compounding returns forgone during the recovery window cannot be recaptured. The fear that motivated the defensive positioning, meanwhile, typically diminishes faster than the investor expects. DJE Kapital identified short-term recovery opportunities precisely because negative sentiment and cautious positioning had created a gap between prices and fundamentals.
Four diagnostic questions can help distinguish between geopolitical events that warrant portfolio adjustment and those that primarily generate fear:
In the Iran conflict, all four questions pointed toward containment rather than contagion. S&P Global (January 2026) expected international stocks to rally in 2026 with emerging markets supported despite geopolitical volatility, a view that has held through the crisis.
Not every geopolitical event falls into the “noise” category. The signals that distinguish genuinely market-altering conflicts from contained disruptions include:
Persistent stock market warning signals, including gasoline at $4.25 per gallon matching a historically reliable threshold and recession probability estimates now ranging from 30% to 48.6%, represent the specific scenario variables the diagnostic framework above is designed to monitor, distinguishing between fear-driven noise and data points that have historically preceded sustained drawdowns.
Academic research supports this framework: geopolitical risk suppresses corporate investment efficiency, but equity price recovery is typically faster, with asymmetric effects between developed and emerging markets. The Iran conflict, as of May 2026, has triggered none of the four escalation signals above.
The S&P 500’s April 2026 record highs are not a puzzle requiring explanation. They are the predictable output of a market that correctly assessed the Iran conflict as regionally significant but globally limited in economic impact. U.S. GDP accelerated to 2.0% annualised growth. Corporate earnings expectations improved from their conflict-onset baseline. Institutional forecasters, including Goldman Sachs and S&P Global, maintained their projections for continued gains into 2027.
The April 2026 equity rally, at 10.42% for the S&P 500 and 15.29% for the Nasdaq, reflected 15.1% blended earnings growth beating pre-season consensus of 13.2%, with sector rotation on 30 April toward small caps and industrials suggesting the advance was broadening beyond its AI-driven origins into a more durable structural move.
The more durable lesson is not about this specific conflict. It is about the investor behaviour pattern the episode exposed: the tendency to weight vivid, frightening events above the quieter but more powerful signal of earnings and economic fundamentals. With the broadening of equity leadership across AI, fiscal stimulus, and reindustrialisation themes, the current environment continues to reward investors who can distinguish between news that is frightening and news that is economically transformative.
This article is for informational purposes only and should not be considered financial advice. Investors should conduct their own research and consult with financial professionals before making investment decisions. Past performance does not guarantee future results. Financial projections are subject to market conditions and various risk factors.
Geopolitical risk tends to trigger short-term equity selloffs as investors react to frightening headlines, but markets typically recover quickly once the worst-case scenario fails to materialise, because equity prices are driven by forward earnings expectations rather than current news events.
The S&P 500 climbed to record highs above 7,200 during the Iran conflict because U.S. GDP accelerated to 2.0% annualised growth in Q1 2026, corporate earnings expectations improved, and institutional forecasters including Goldman Sachs maintained projections for continued gains, meaning the conflict was priced as regionally significant but not globally economically transformative.
Historical data and the April 2026 rally both suggest that selling during geopolitical conflicts is typically costly, as markets reprice upward rapidly once the most extreme scenarios begin to fade, and investors who exit on fear often miss the sharpest portion of the recovery.
Key warning signals include sustained disruption to multiple global trade routes simultaneously, direct earnings guidance revisions across major index sectors, a forced central bank policy response, and a prolonged downward earnings revision cycle that broadens beyond the initial quarter rather than stabilising.
Brent crude rose above $108 per barrel during the conflict, yet the S&P 500 still reached all-time highs, partly because OPEC's share of global production had fallen to approximately 26% after the UAE's exit, the U.S. accounted for around 22% of global crude output as the primary swing producer, and alternative supply routes were developing to partially offset the disruption.