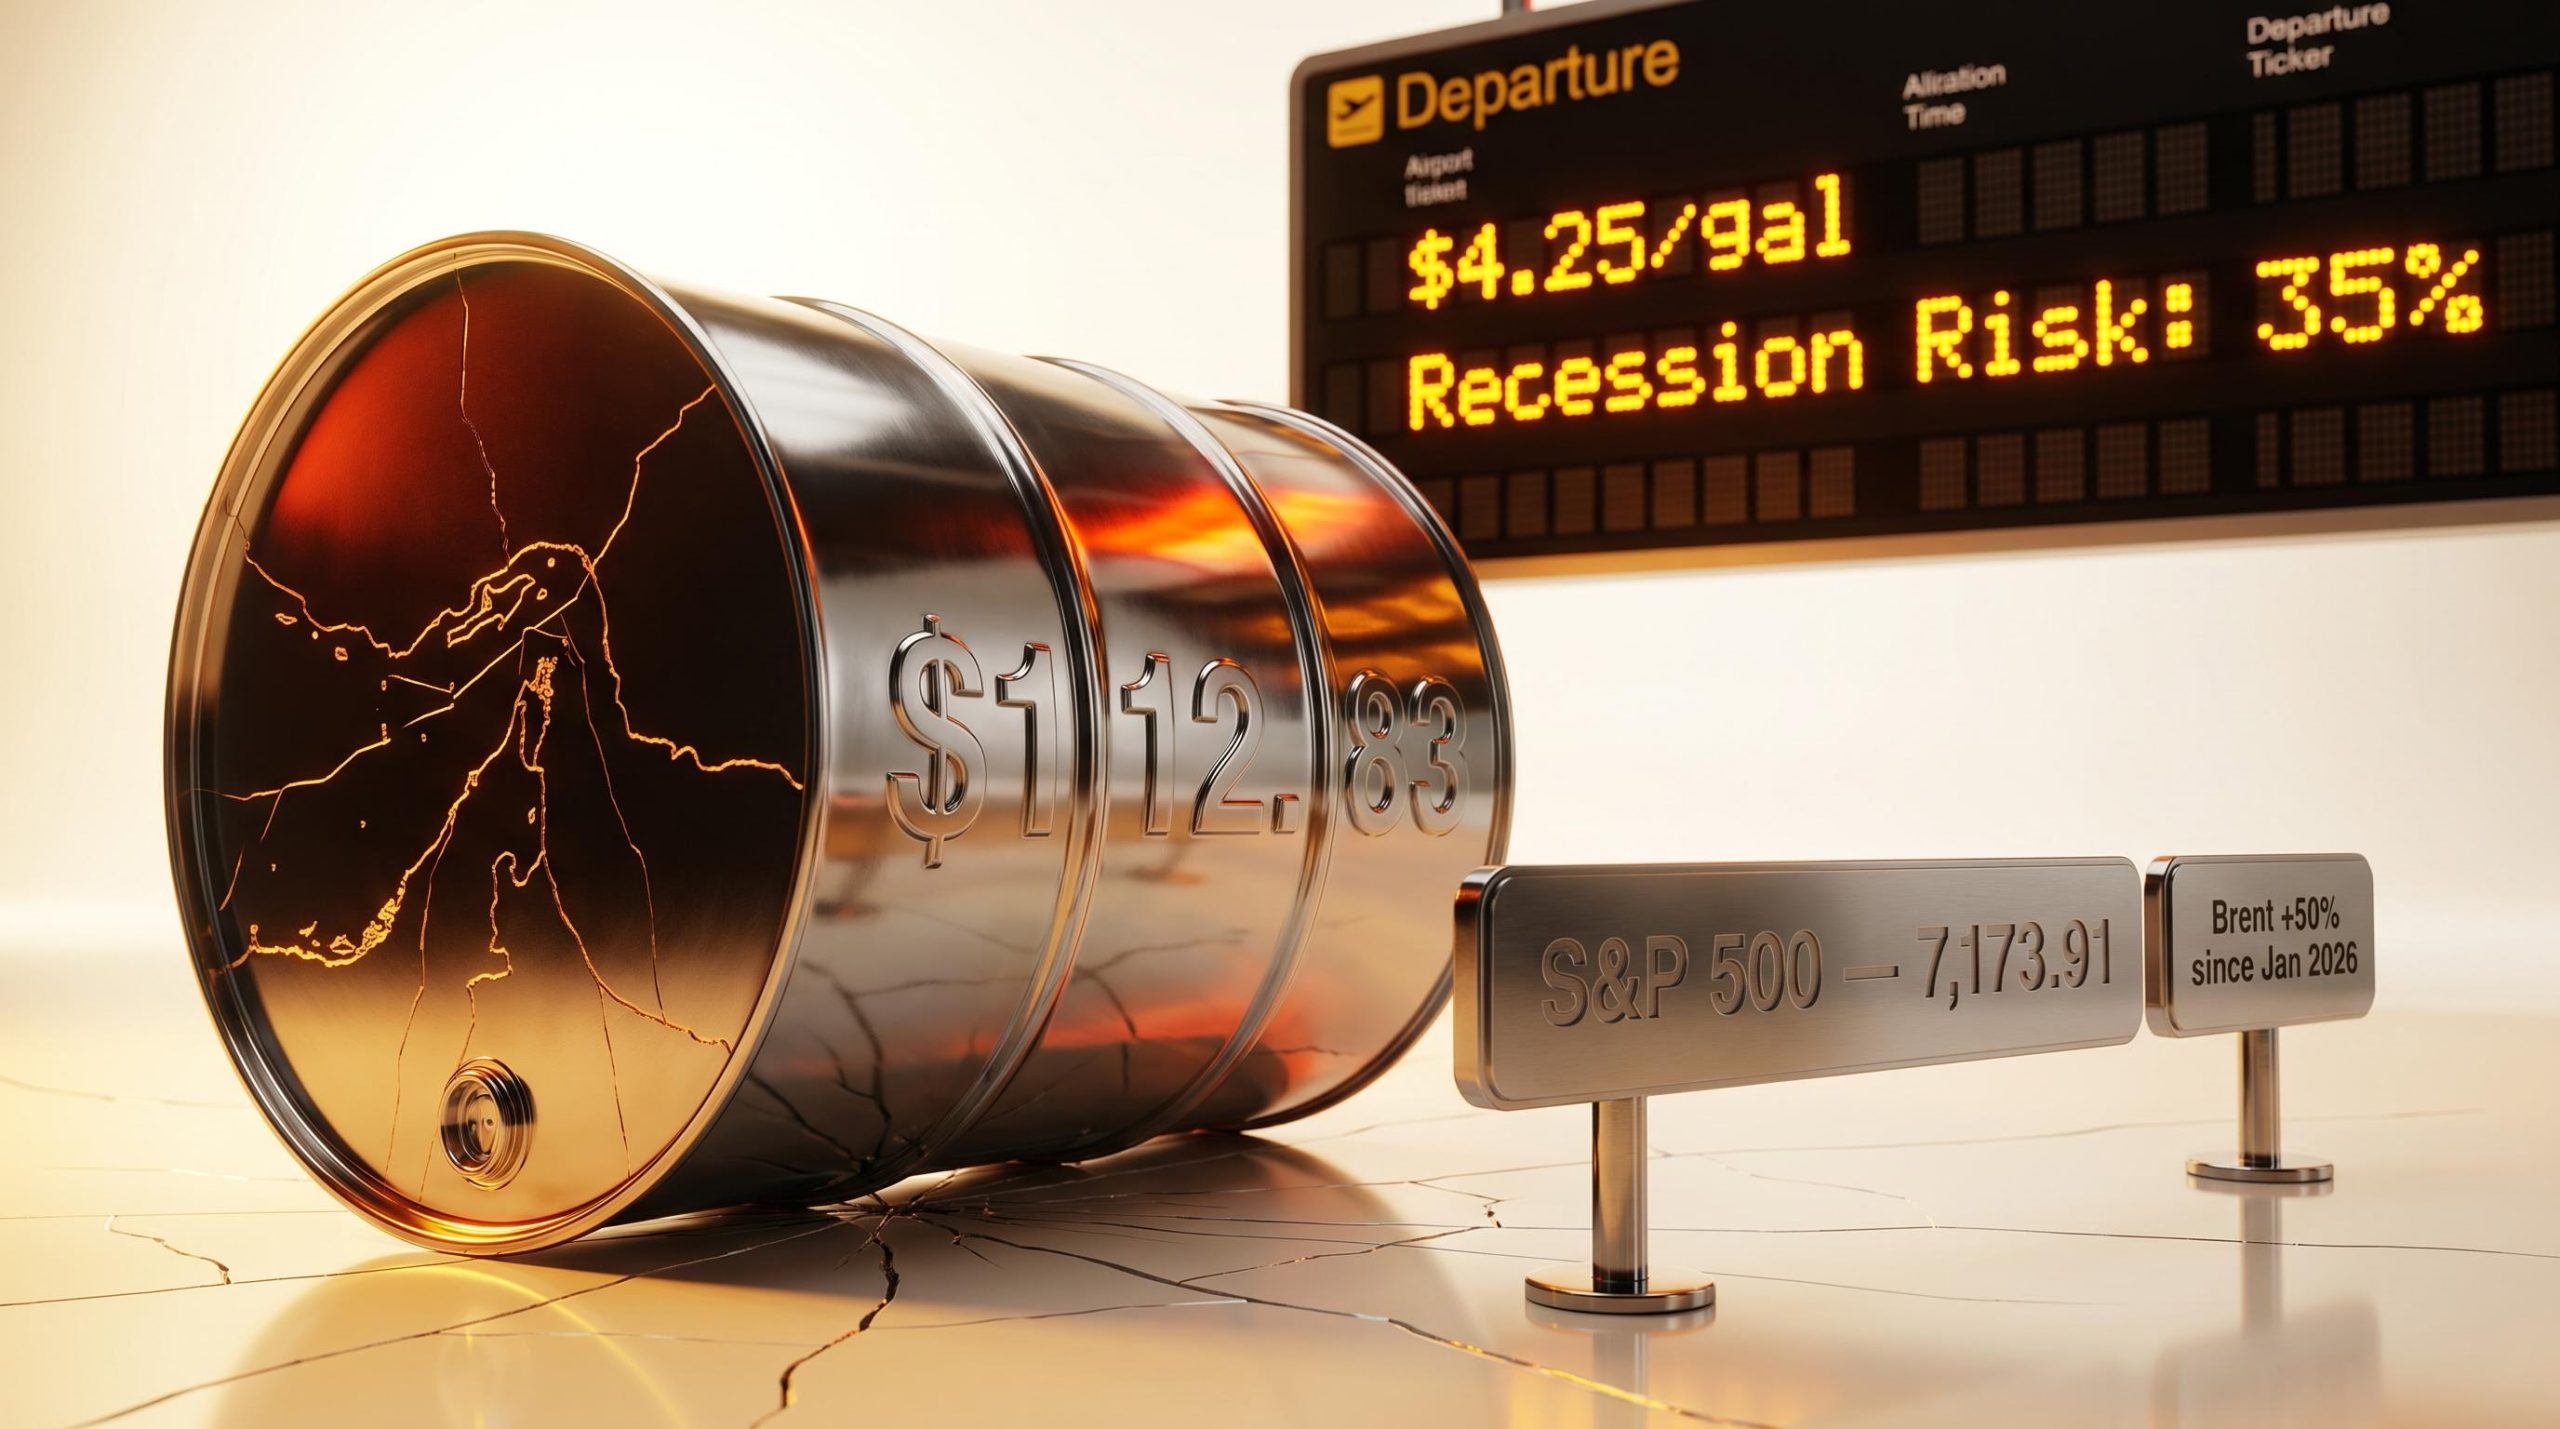
The S&P 500 closed at 7,173.91 on 27 April 2026, a fresh all-time high. The strait that carries roughly 20% of the world’s daily oil supply remains effectively shut.
Every condition that triggered the index’s 9% selloff in March is still in force: the Hormuz blockade, Brent crude above $100 per barrel, and a US-Iran diplomatic stalemate with no resolution timeline. The market has recovered; the crisis has not. What follows is an examination of what equity prices currently assume, why those assumptions may be dangerously optimistic, and what historical data and institutional projections indicate about where stocks could head from here.
The Strait of Hormuz is still closed, and markets are largely ignoring it
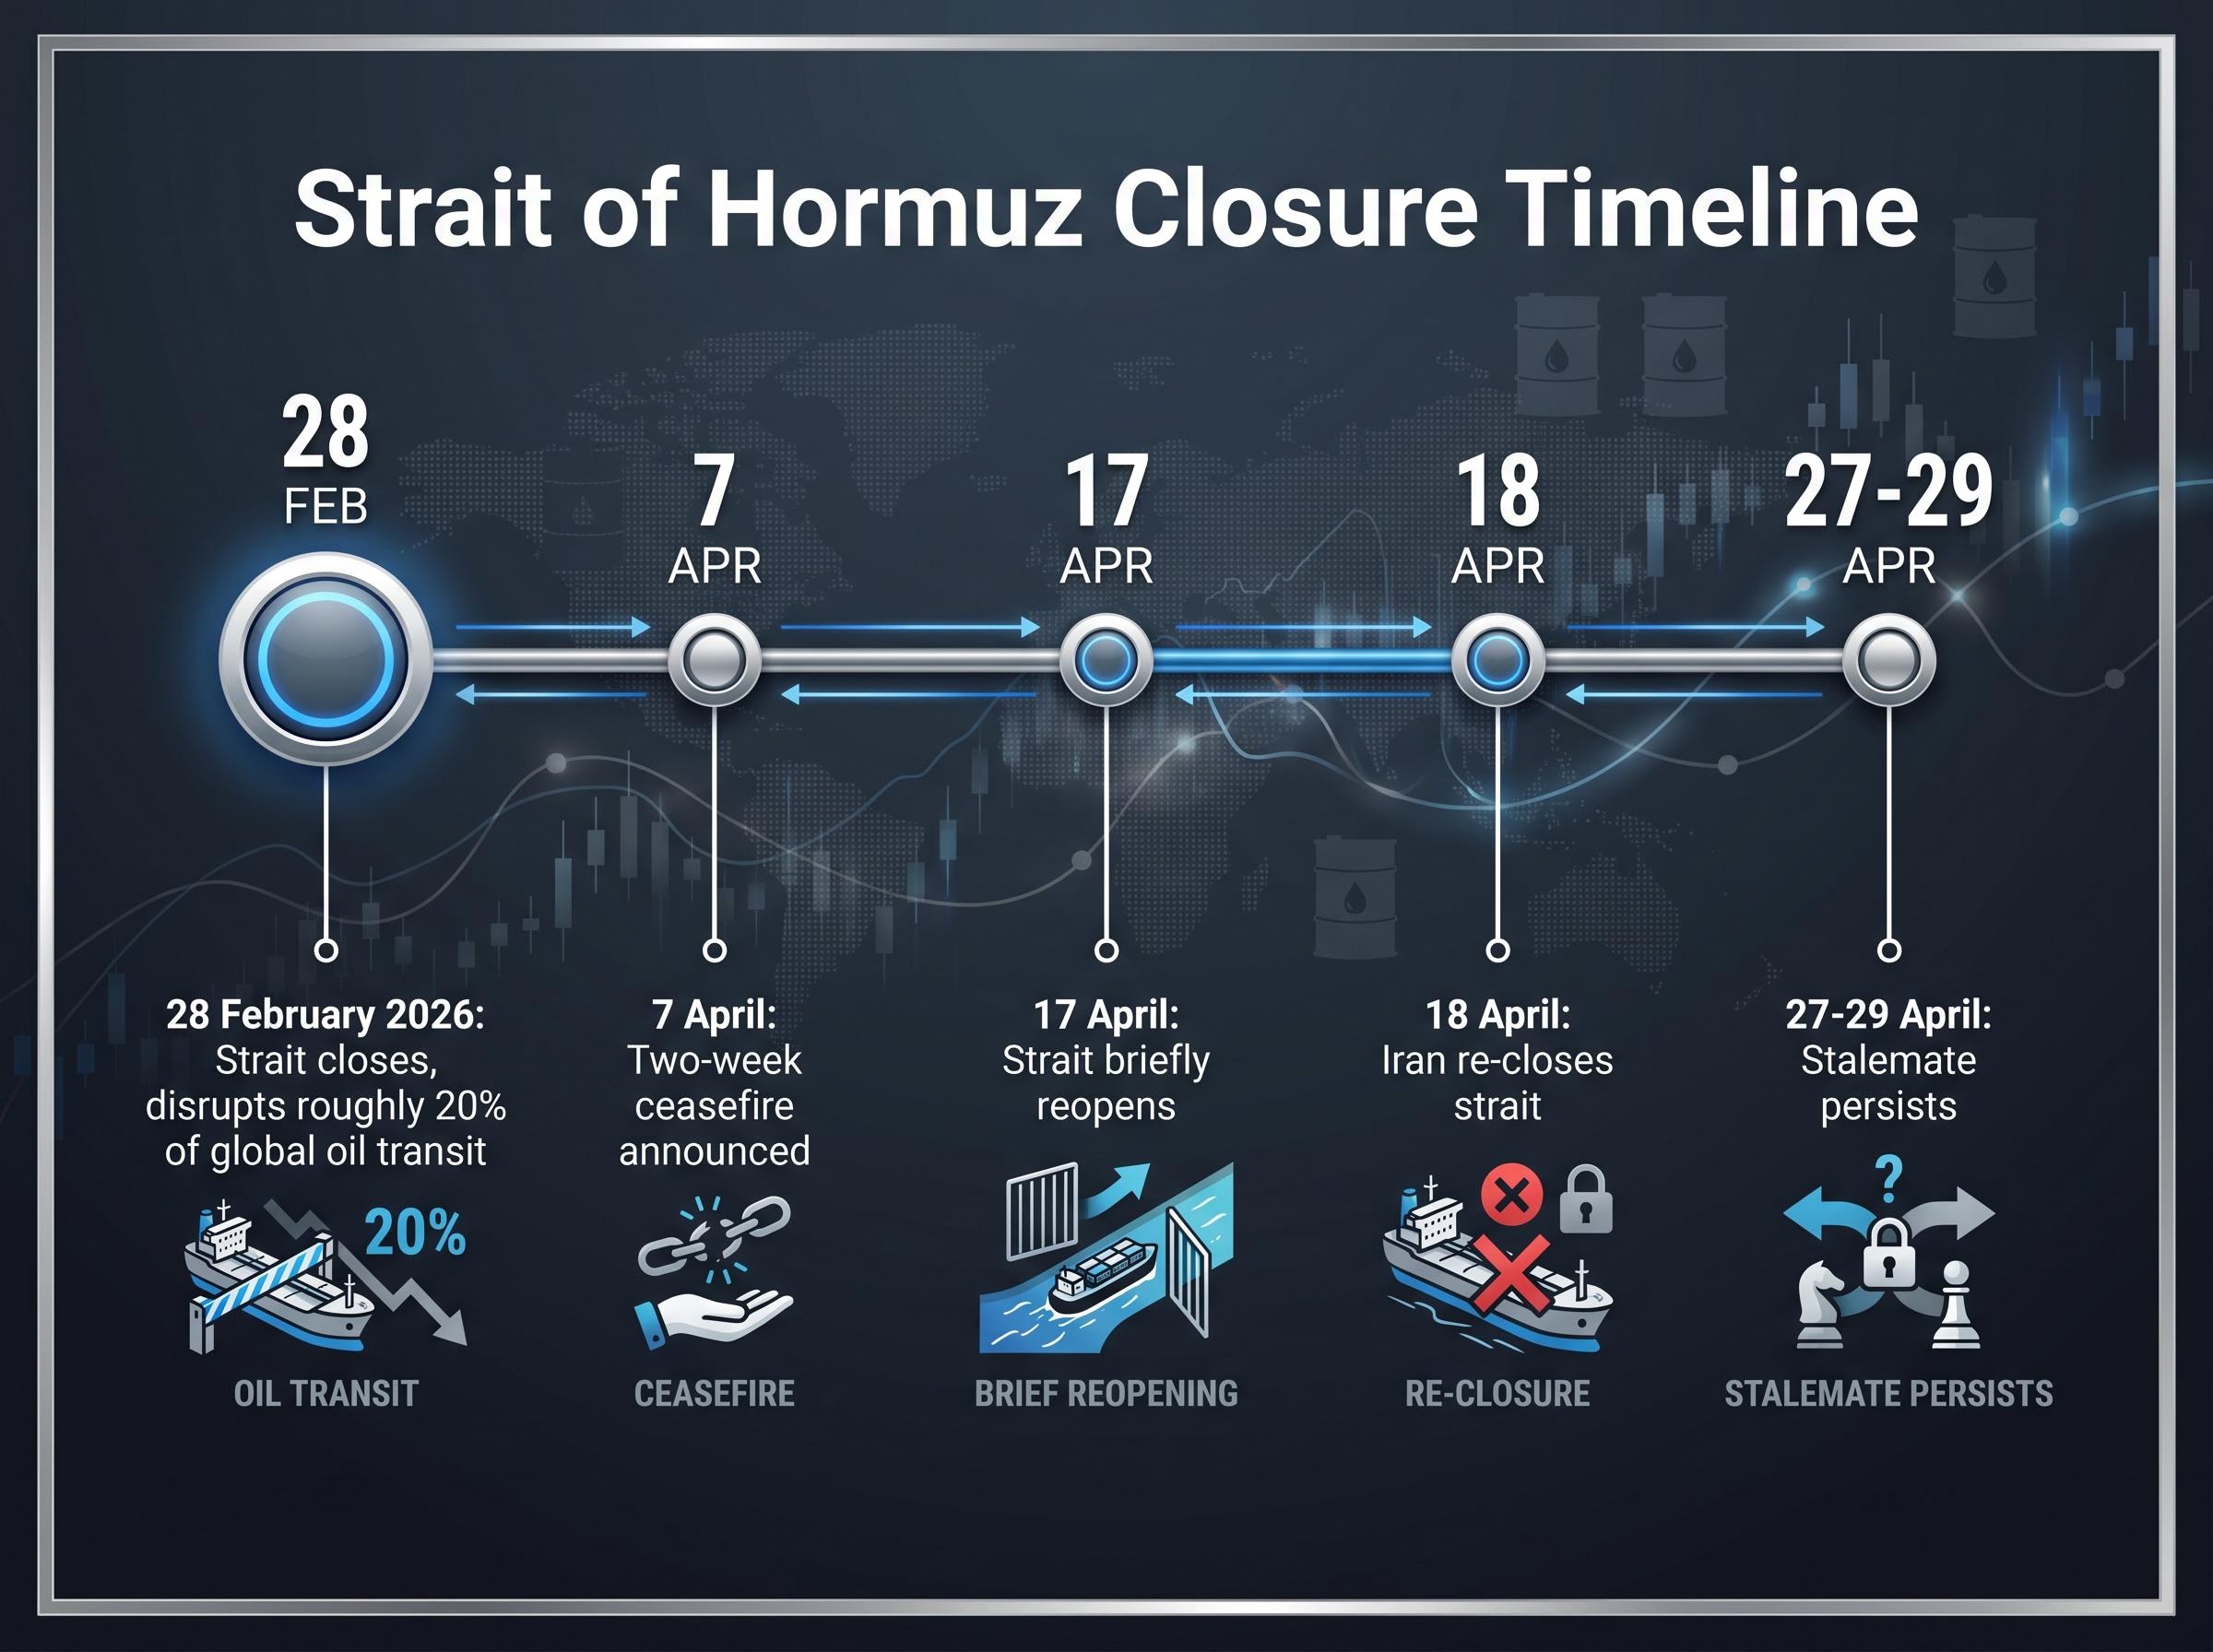
Iran blocked the Strait of Hormuz on 28 February 2026. Nearly two months later, the waterway remains shut, and the diplomatic record since then reads as a pattern of fragility rather than progress.
- 28 February 2026: Iran closes the Strait of Hormuz, disrupting roughly one-fifth of global oil transit.
- 7 April: A two-week ceasefire is announced, raising expectations of a temporary reopening.
- 17 April: The strait briefly reopens; tanker traffic begins to resume.
- 18 April: Iran re-closes the strait within 24 hours, citing the US refusal to lift its naval blockade.
- 27-29 April: Stalemate persists. Conditional ceasefire extension offers continue, but both-sided blockades remain in place.
The US naval blockade is the specific sticking point. Tehran has signalled acceptance of an interim agreement to reopen the strait, but only in exchange for the US lifting its port blockade. Washington has not complied, and no firm timeline exists for resolution.
Wall Street Journal reporting on the US naval blockade indicates the White House has directed aides to prepare for an extended standoff, a posture that makes any near-term diplomatic resolution structurally harder to achieve than current equity pricing implies.
Even in a best-case reopening scenario, Asian oil importers face approximately 30-day tanker delays before supply chains begin to normalise. The physical lag persists regardless of diplomatic signals.
The 17-18 April sequence is the data point retail investors have not fully absorbed. Diplomatic progress and actual shipping conditions diverged within a single trading day.
When big ASX news breaks, our subscribers know first
How a closed strait turned into a $112 oil price and what the worst case looks like
Brent crude started 2026 at approximately $65 per barrel. The Hormuz closure pushed it past $100. By 29 April, the benchmark sat at approximately $112.83, a price increase exceeding 50% since January.
The price cannot normalise quickly even if the strait reopens tomorrow. Production infrastructure damage, storage limitations, and the 30-day tanker delay for Asian importers mean output recovery requires time, not just open shipping lanes.
The World Bank’s Commodity Markets Outlook, published 28 April 2026, forecasts Brent averaging $86 per barrel for the full year, up from $69 in 2025, with an explicit caveat that sustained disruption poses upside risk well beyond that figure.
The World Bank Commodity Markets Outlook for April 2026 projects a full-year Brent average of $86 per barrel, a figure that assumes some degree of disruption resolution, yet current spot prices already trade more than $25 above that central forecast.
What Morgan Stanley’s price range means for the rest of 2026
Morgan Stanley analyst Martijn Rats has outlined two scenarios that frame the width of the uncertainty.
| Scenario | Brent Price Target | Condition Required |
|---|---|---|
| Start of 2026 baseline | ~$65/barrel | Pre-crisis pricing |
| Current level (29 April) | ~$112.83/barrel | Ongoing Hormuz closure |
| Morgan Stanley base case | $80-$90/barrel average | Swift diplomatic resolution and strait reopening |
| Morgan Stanley tail risk | $150-$180/barrel | Strait remains closed for several months |
Current prices already exceed the midpoint of Rats’ base case range. The market is not trading as though resolution is certain; it is trading above the level that resolution would deliver.
The spread between the best and worst case spans $100 per barrel. That gap represents the width of uncertainty investors are currently choosing to treat as resolved.
Why a $4.25 gasoline price is a historically reliable equity warning signal
The national average gasoline price reached $4.25 per gallon (all grades) for the week ending 27 April 2026, according to the US Energy Information Administration. Fuel costs are up approximately 45% since the start of the year, a level last seen in August 2022.
The transmission from pump prices to equity weakness runs through three channels:
- Direct consumer purchasing power reduction: Every dollar spent on fuel is a dollar not spent elsewhere. Household budgets absorb the increase immediately.
- Business cost pass-through: Companies facing higher transport and input costs pass those increases to consumers, compressing margins or raising retail prices, or both.
- Suppressed discretionary spending: As fuel and staple goods consume a larger share of income, spending on non-essential goods and services contracts, weakening the consumer activity that drives approximately 70% of US GDP.
The historical record sharpens the signal.
Since 1993, gasoline has exceeded $4.00 per gallon in only 44 weeks out of approximately 1,700, representing under 3% of the period. In the six months following those 44 weeks, the S&P 500 declined by an average of 11%.
This is not a theoretical risk model. It is a pattern derived from three decades of gasoline and equity price data, and the current reading sits squarely inside the threshold.
Investors wanting to stress-test the historical pattern against the current reading will find our deep-dive into thirty years of gasoline and equity data, which examines sector-level divergence between energy winners and consumer discretionary losers, and models the conditions under which the 11% average outcome extends toward the 41% worst-case scenario observed in sustained high-price episodes.
Understanding why the S&P 500 recovery itself has created a new risk
The S&P 500 recovered from its March selloff for two reasons analysts broadly agree on: investor confidence that diplomacy would eventually resolve the Iran conflict, and strong corporate earnings. Q1 2026 earnings grew 12.9-15.1% year-over-year, led by the technology sector. Bank executives cited healthy consumer balance sheets and strong deal pipelines.
Both factors are real. Neither addresses the underlying geopolitical stalemate.
What the all-time high is actually pricing in
At 7,173.91, the index embeds three simultaneous assumptions:
- Diplomatic resolution of the Hormuz crisis leads to a full strait reopening
- Oil prices normalise toward the $80-$90 base case range
- Earnings growth continues at or near the Q1 pace through the remainder of 2026
All three assumptions remain unverified as of 29 April 2026. The strait is closed. Oil is at $112. Earnings guidance has not yet been revised to reflect sustained energy cost inflation.
By returning to all-time highs, the index has rebuilt the distance it would need to fall if these assumptions prove wrong. The 200-day moving average sits at approximately 6,716-6,791, a level institutional traders and momentum-oriented investors watch as a signal of trend reversal. A break below it would likely trigger systematic selling.
The recovery has not eliminated the downside risk. It has reset the starting point for it.
What a recession would mean for equity investors, and how real that risk is now
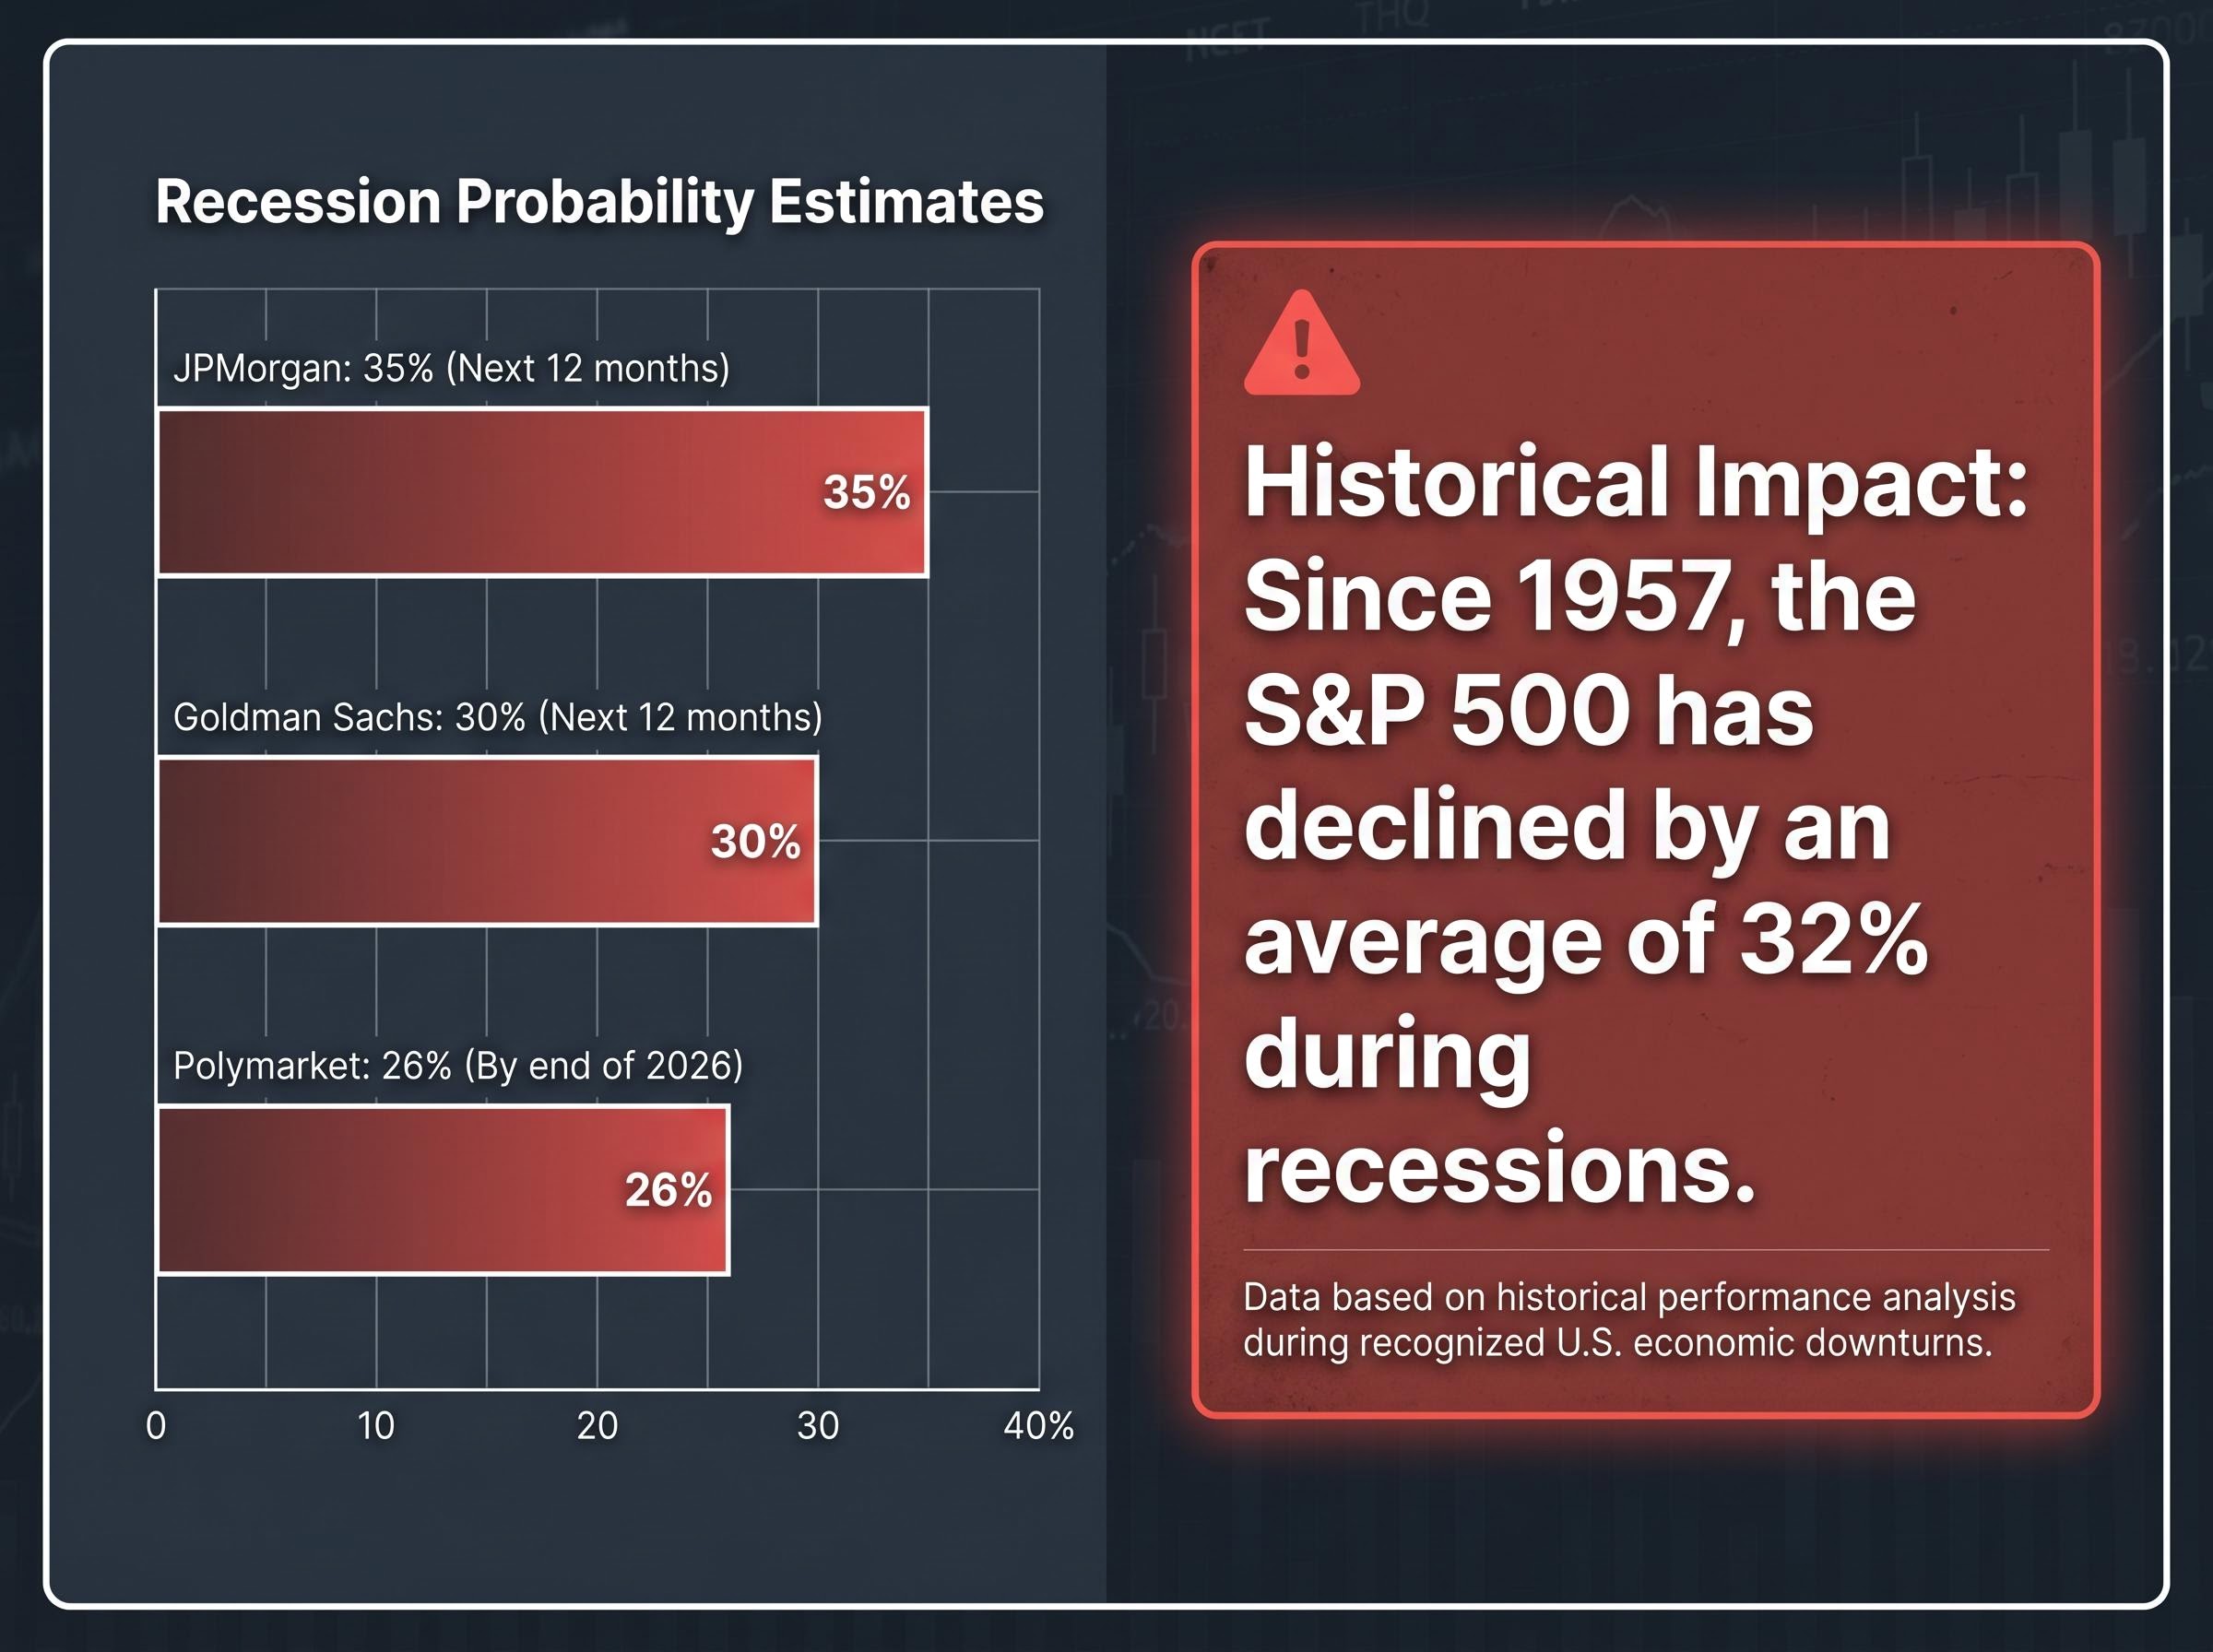
Since 1957, the S&P 500 has declined by an average of approximately 32% during recessions. That figure provides the historical anchor for what a recession-driven selloff would mean at current index levels.
Mark Zandi, Chief Economist at Moody’s, has described recession risk as already considerable and worsening. Even a swift de-escalation, Zandi noted, would leave lasting economic damage that prevents meaningful GDP or employment recovery for the remainder of 2026. Joblessness is expected to increase further.
The transmission channel is direct: sustained oil prices at or above current levels feed through business costs, contract consumer spending, and generate stagflationary pressure. Economists have drawn explicit parallels to the 1970s supply-shock dynamic.
The mechanics of oil price transmission into recession operate through four simultaneous channels: reduced consumer disposable income, rising business input costs, Federal Reserve rate pressure, and an investment and hiring pullback that compounds across quarters before GDP data confirms the damage.
| Institution | Recession Probability Estimate | Timeframe |
|---|---|---|
| Goldman Sachs | 30% | Next 12 months |
| JPMorgan | 35% | Next 12 months |
| Polymarket (crowd-sourced) | 26% | By end of 2026 |
A 30-35% institutional probability attached to an event that historically produces a 32% average equity decline is not a background risk. It is a portfolio-sizing consideration that warrants active attention.
The gap between what markets are pricing and what the data is saying
The bull case for US equities is coherent. Diplomacy eventually prevails. The strait reopens. Oil normalises. Strong earnings carry the index forward.
- Diplomatic resolution leads to sustained Hormuz reopening
- Oil prices retreat toward the Morgan Stanley base case of $80-$90
- Consumer spending and corporate earnings absorb the temporary shock
The bear case is equally specific.
- The stalemate persists or re-escalates; no reopening materialises
- Oil moves toward the $150-$180 tail-risk range
- Stagflationary pressure builds; recession probability rises above current estimates
The S&P 500 closed at 7,138.80 on 28 April. Brent traded at approximately $111.10-$112.83 in late April, already above the midpoint of Morgan Stanley’s best-case scenario. No firm diplomatic resolution timeline exists as of 29 April 2026.
The 17 April reopening and 18 April re-closure remain the single most illustrative data point for how quickly the gap between market pricing and geopolitical reality can close. The index is priced near the bull case. The evidence on the ground sits closer to the bear case. The cost of being wrong is asymmetric: the upside from here is incremental; the downside, if the embedded assumptions fail, is measured in the hundreds of index points.
This article is for informational purposes only and should not be considered financial advice. Investors should conduct their own research and consult with financial professionals before making investment decisions. Past performance does not guarantee future results. Financial projections are subject to market conditions and various risk factors.