Why the US-Iran Deal Won’t Cut Oil Prices Overnight
2 hrs ago

The S&P 500 and MSCI World index both reached all-time highs in April 2026 while a naval blockade was closing one of the world’s most critical energy chokepoints. To most observers, that looked like a contradiction. To market historians, it was entirely expected.
The 2026 Iran conflict and Strait of Hormuz closure triggered a sharp equity sell-off in March 2026, followed by a recovery that commentators widely labelled as complacent or detached from reality. That framing misunderstands a pattern that has recurred across every major regional conflict since 1959. What follows is a breakdown of the three-phase framework equity markets reliably follow during geopolitical stress events, the six decades of S&P 500 data that underpin it, and the single variable that has historically separated a fast recovery from a prolonged drawdown. The 2026 Hormuz crisis is a live test of that framework, and the data so far tells a more nuanced story than either the bulls or the bears acknowledge.
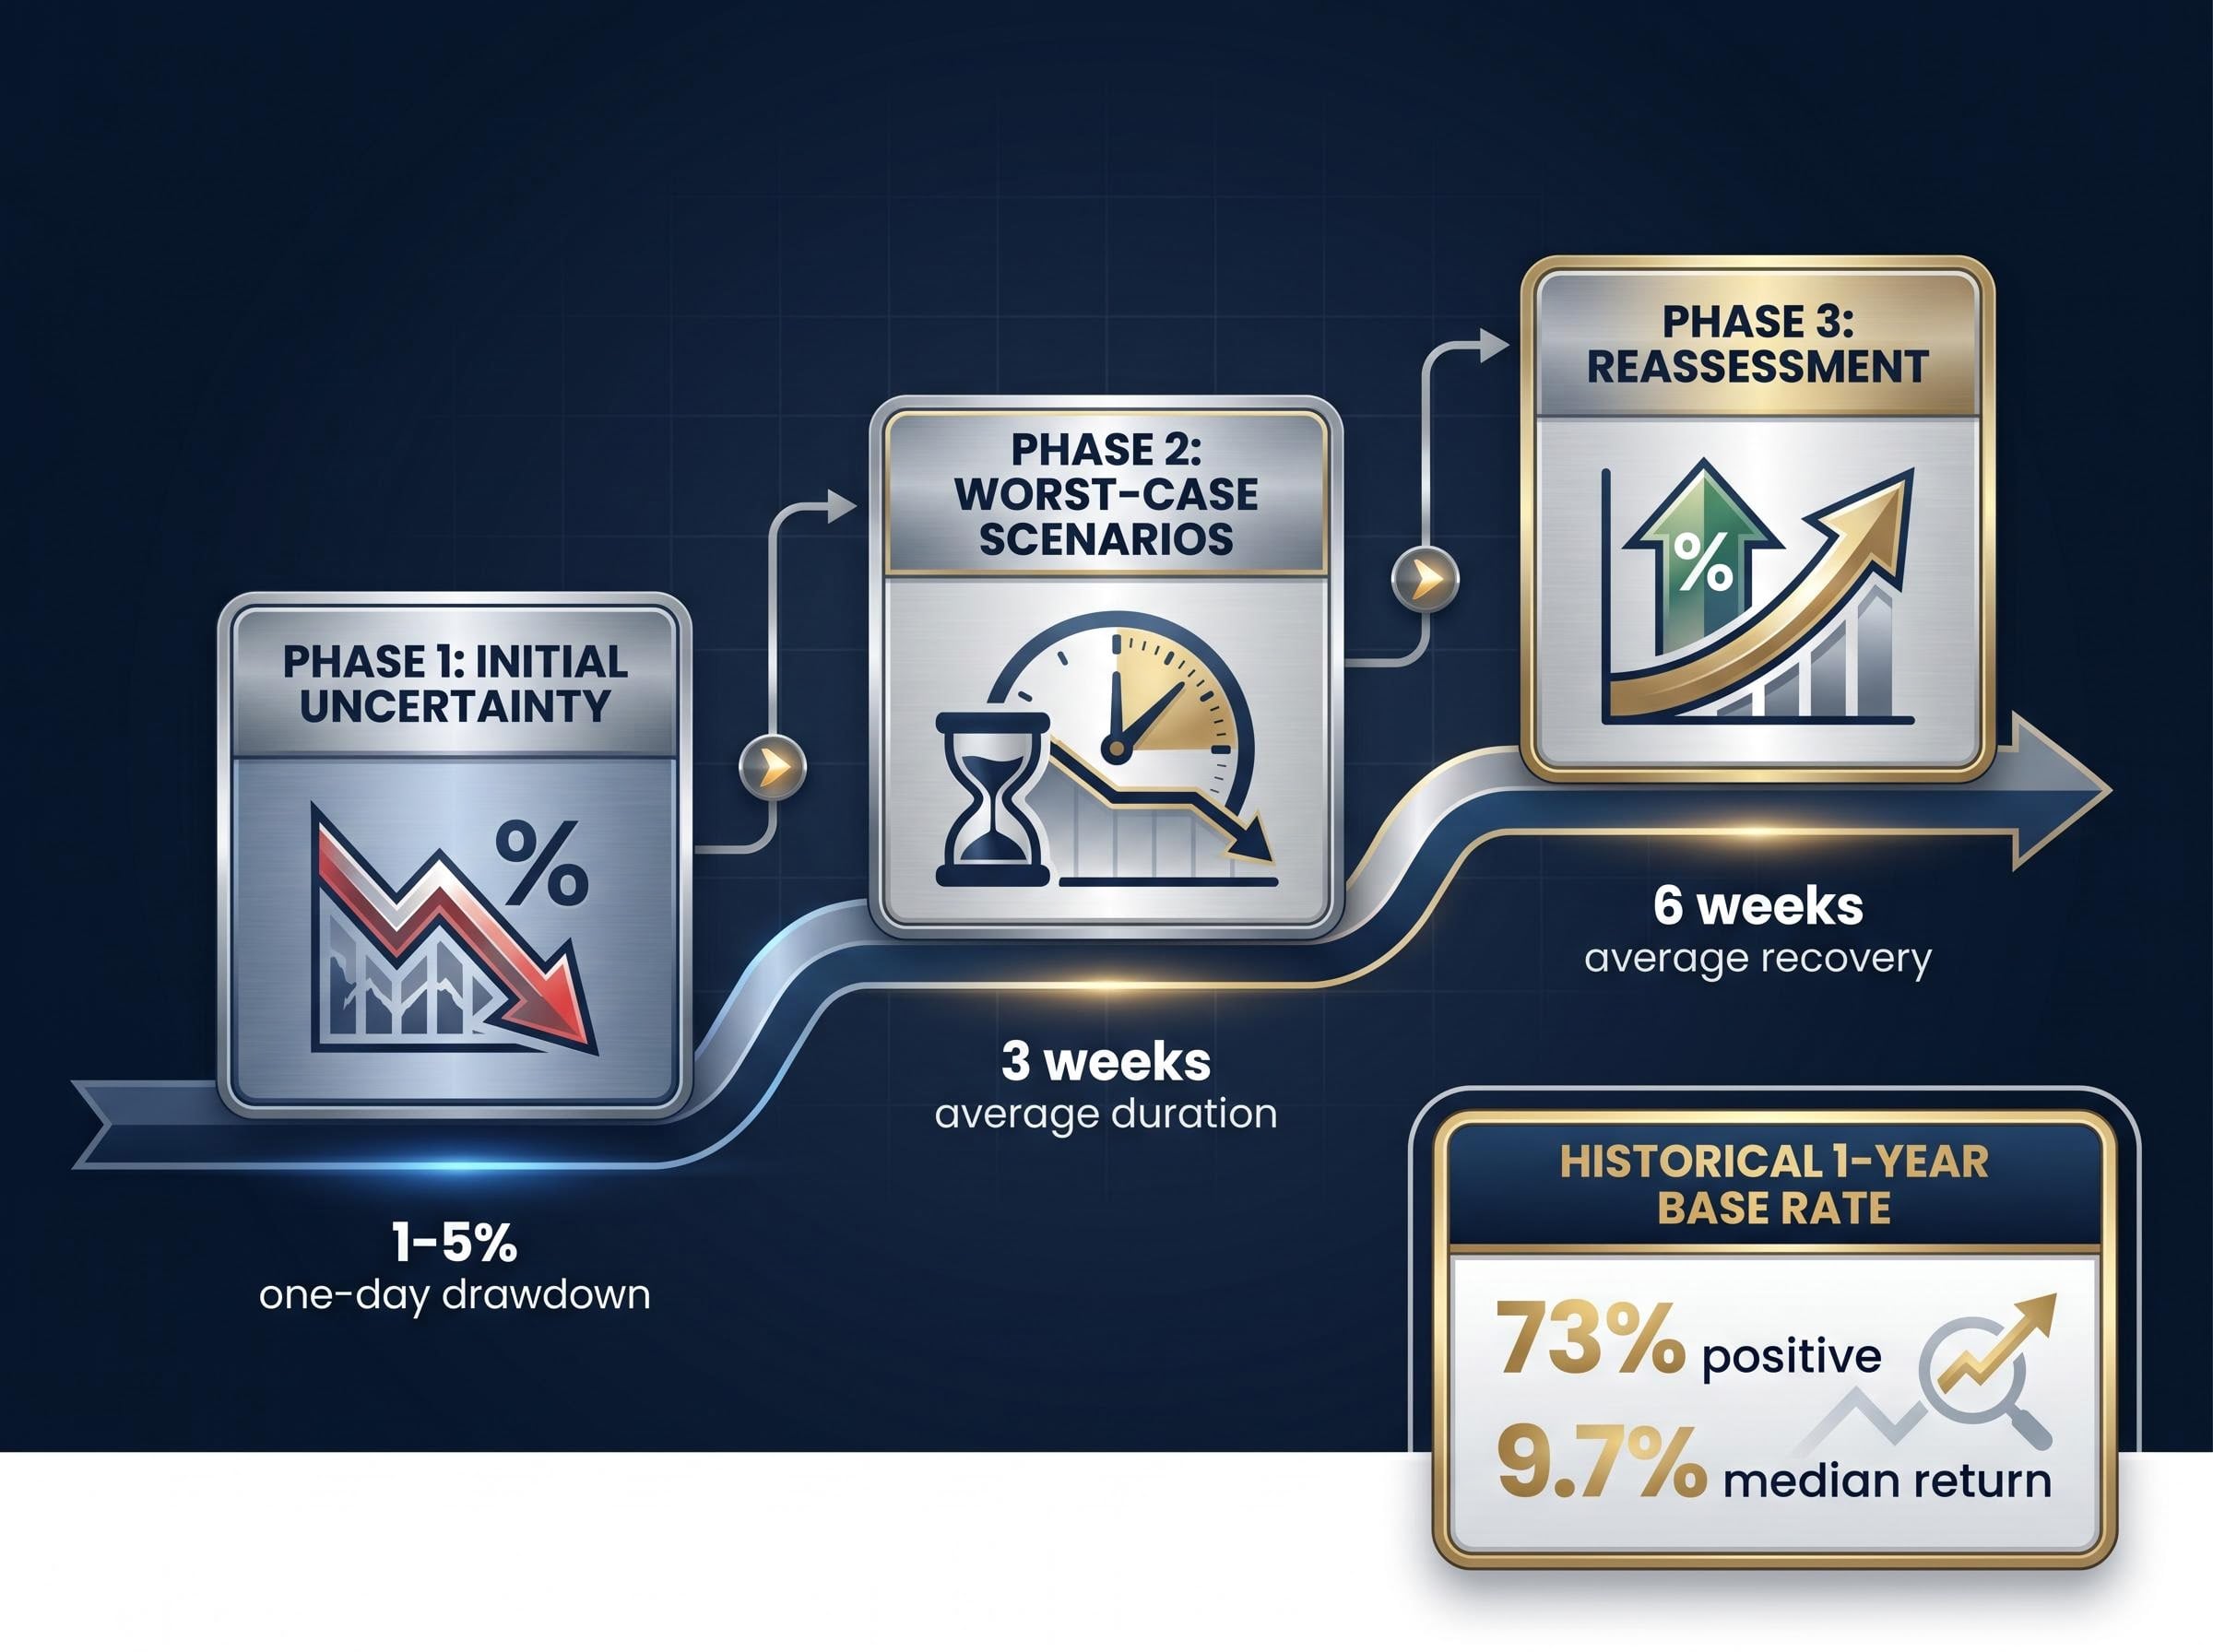
Geopolitical shocks feel chaotic in real time. In hindsight, they tend to follow a structure. Across every major regional conflict since the late 1950s, equity markets have moved through three distinct phases, each driven by a different behavioural mechanism.
The S&P 500 has been higher one year after the onset of a regional conflict 73% of the time, delivering a median return of approximately 9.7%.
That statistic is the base rate. The question for 2026 is whether this conflict fits the base case or belongs to the 27% that does not.
The historical record splits cleanly. Non-energy conflicts produce mild drawdowns with average recovery times near six weeks. Oil-shock conflicts produce the 15-16% drawdown cluster observed in 1973 and 1990. RBC Wealth Management’s framework describes this bifurcation as the single most explanatory variable in the conflict-recovery dataset.
The transmission mechanism is direct. Oil prices sustained above $100 per barrel create inflation risk that compresses corporate earnings expectations, according to analysis from SharePlanner. That compression extends the Phase 2 period by undermining the “no recession link” condition that enables rapid Phase 3 recovery. In the 1973 case, the overlap of energy shock with structural stagflation produced the worst modern outcome. In 1990, recovery followed once supply stability was re-established, but not before a 15.9% drawdown tested investor conviction.
The scale of the Hormuz supply disruption has no modern parallel in the dataset: the IEA estimates approximately 13 million barrels per day have been removed from global supply, a figure that dwarfs the production cuts that defined the 1973 and 1990 episodes and explains why professional risk markets are pricing this shock so differently from the equity indices.
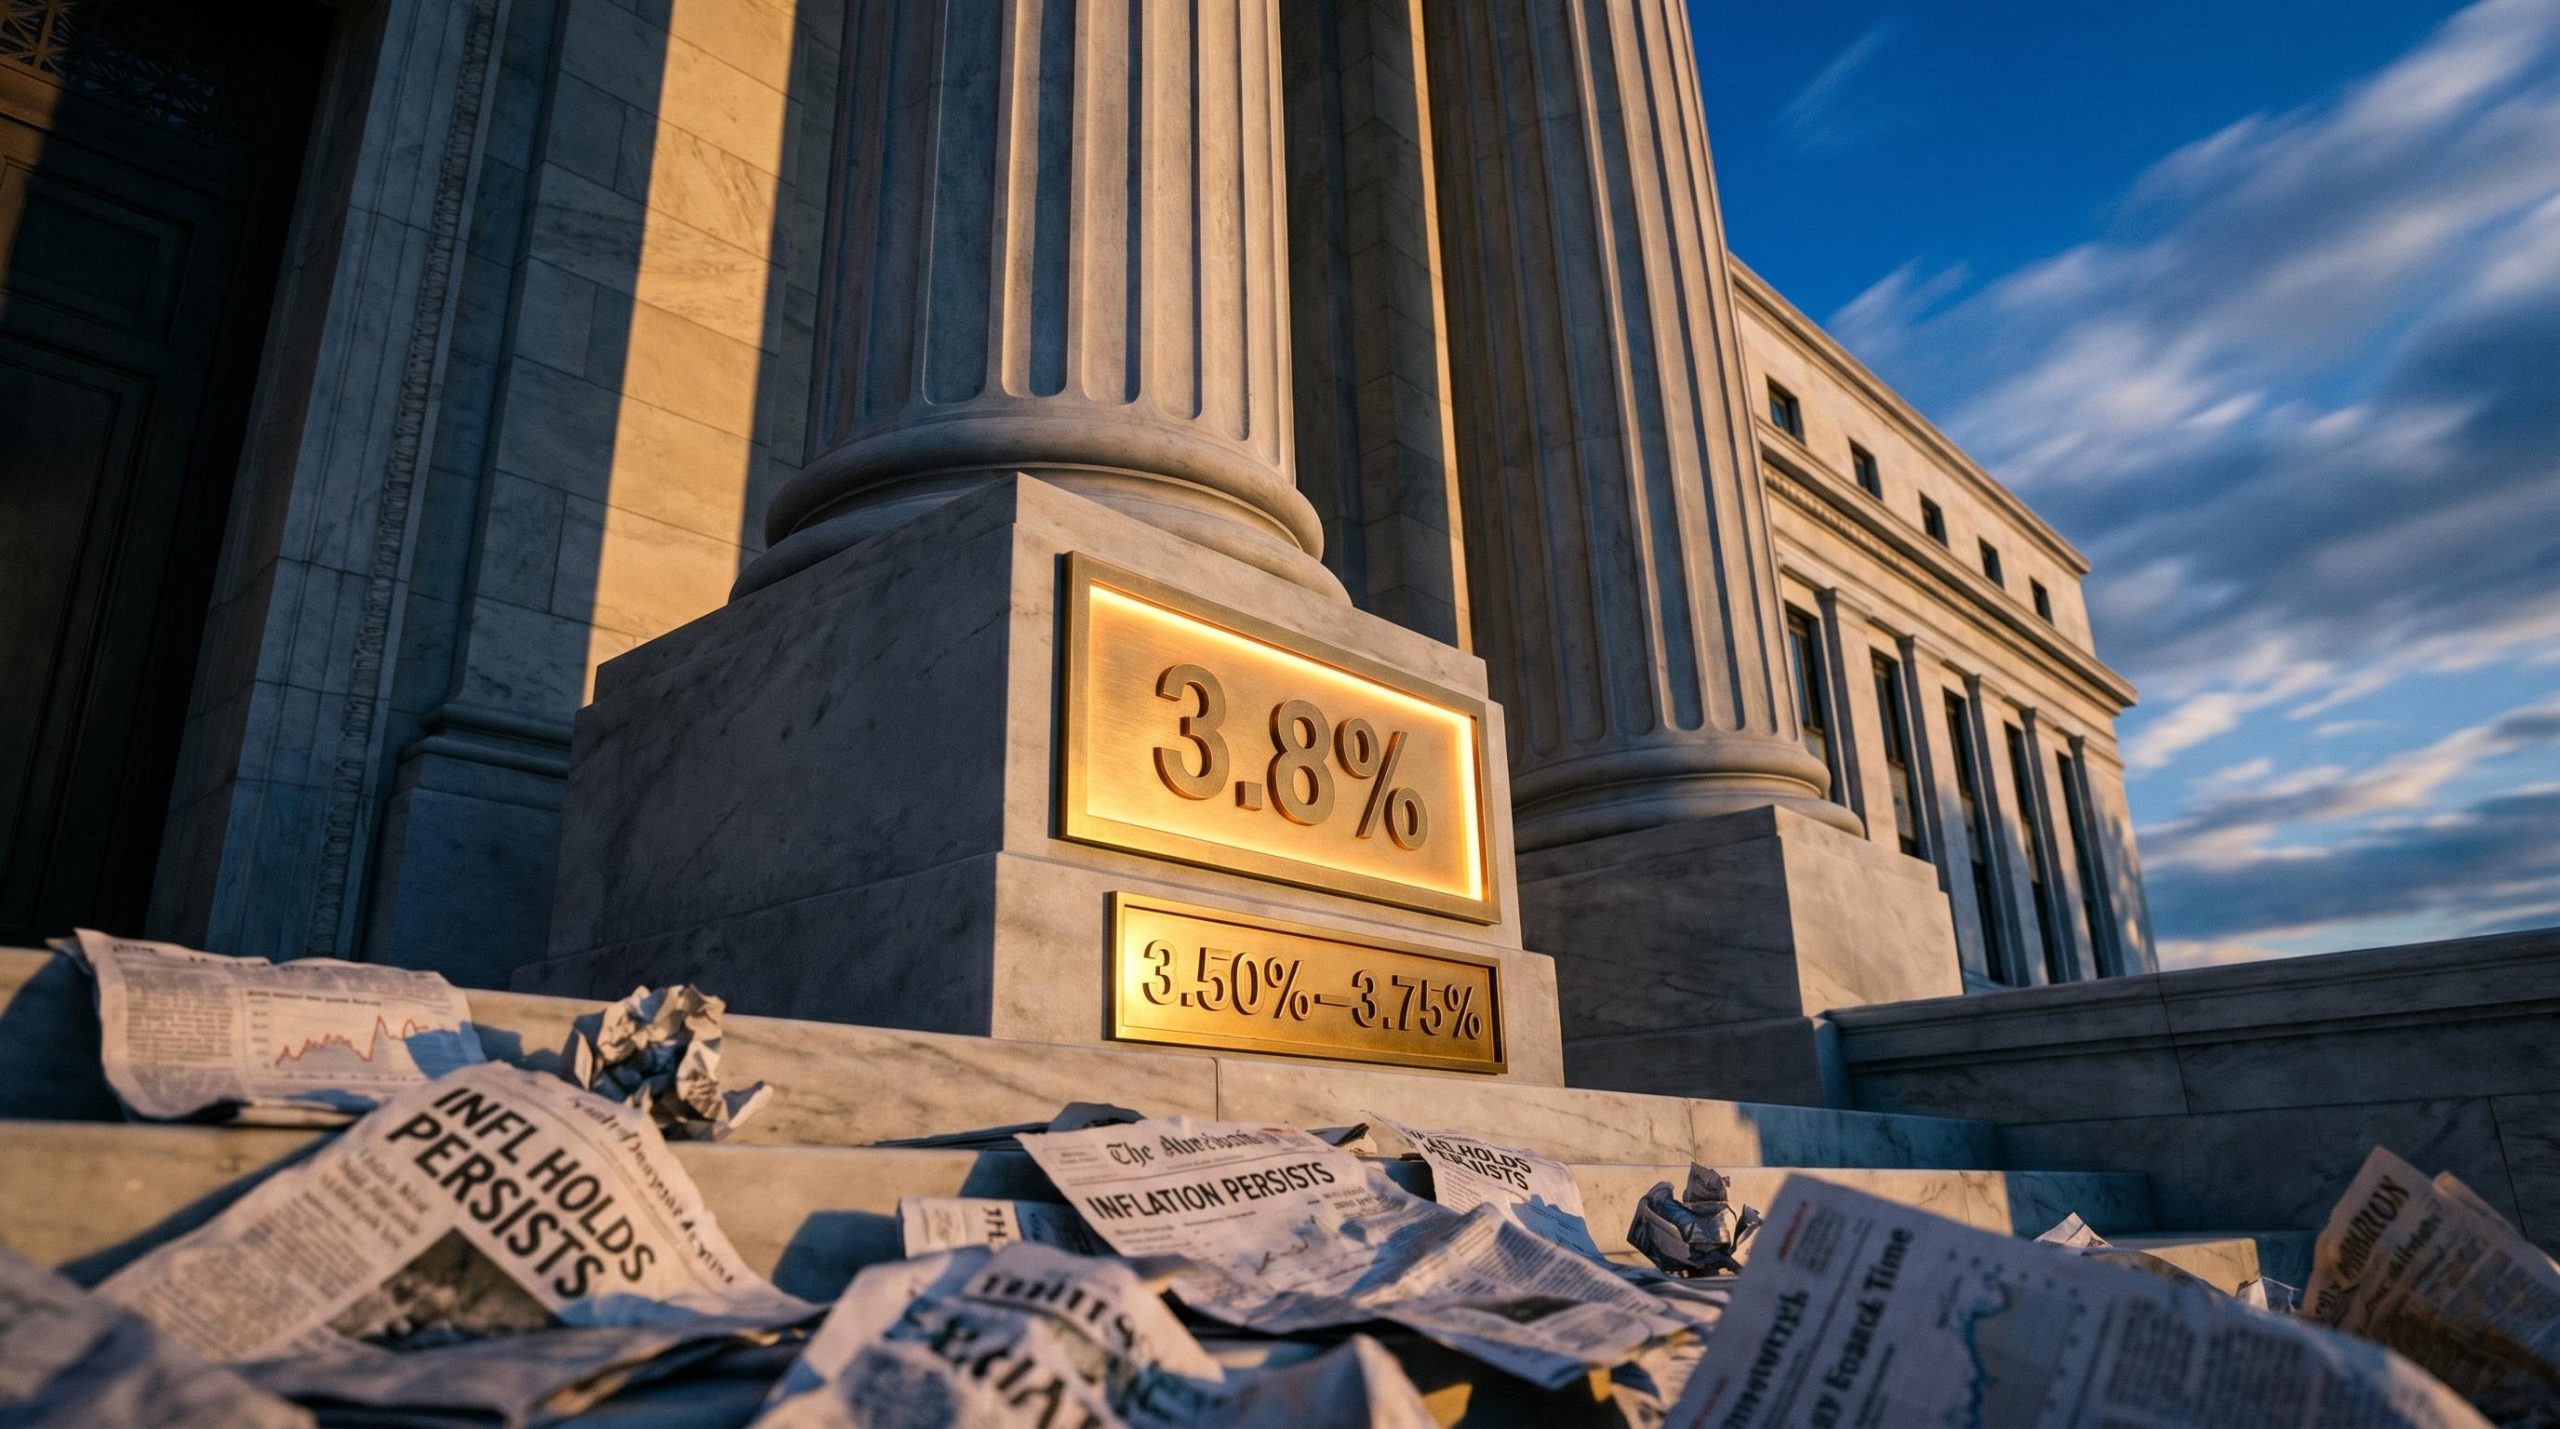
The 2026 Hormuz conflict sits unambiguously in the oil-shock category. WTI Crude stood at $105.49 per barrel as of 1 May 2026, having peaked at approximately $113.99 around 29 April 2026. Prices sustained above $110 during peak conflict intensity. Shipping insurance costs for Hormuz passage have risen to approximately 20 times normal levels, a signal that professional risk markets are pricing ongoing disruption even as equity indices reached record highs.
EIA Strait of Hormuz transit data published in March 2026 recorded approximately 20.9 million barrels per day moving through the strait in the first half of 2025, a volume that places it categorically above every other maritime chokepoint in systemic importance to global crude supply.
The oil-shock framework provides three concrete monitoring variables for tracking whether 2026 follows the six-week recovery script or the multi-quarter oil-shock precedent:
The three-phase model is a framework. The evidence base sits in a dataset maintained by Finaeon, Inc., covering S&P 500 daily total returns from 31 December 1959 through 31 March 2026 (pre-1988 data interpolated from price returns). Across that span, regional conflicts have produced a remarkably consistent pattern, with two notable exceptions.
| Conflict | Year | Peak Drawdown (S&P 500) | 12-Month Return After Onset | Notes |
|---|---|---|---|---|
| Yom Kippur War | 1973 | approx. -16.1% | Negative | Oil embargo compounded by stagflation |
| Kuwait Invasion | 1990 | approx. -15.9% | Positive (post-resolution) | Oil supply shock; recovery once supply stabilised |
| Iraq War | 2003 | Modest | approx. +29.16% | S&P from 874.77 to 1,129.99 over 12 months |
| Russia-Ukraine | 2022 | Moderate | Recovery within months | Energy risks contained via supply rerouting |
| Iran/Hormuz | 2026 | Ongoing | TBD | WTI above $105; ATH in April |
The 2003 Iraq War is the clearest example of Phase 3 outperformance. The S&P 500 stood at 874.77 on 20 March 2003, the day the invasion began. Twelve months later, it had climbed to 1,129.99, an approximate 29.16% gain. The conflict resolved faster than markets feared, and equities priced in that probability well before the formal conclusion.
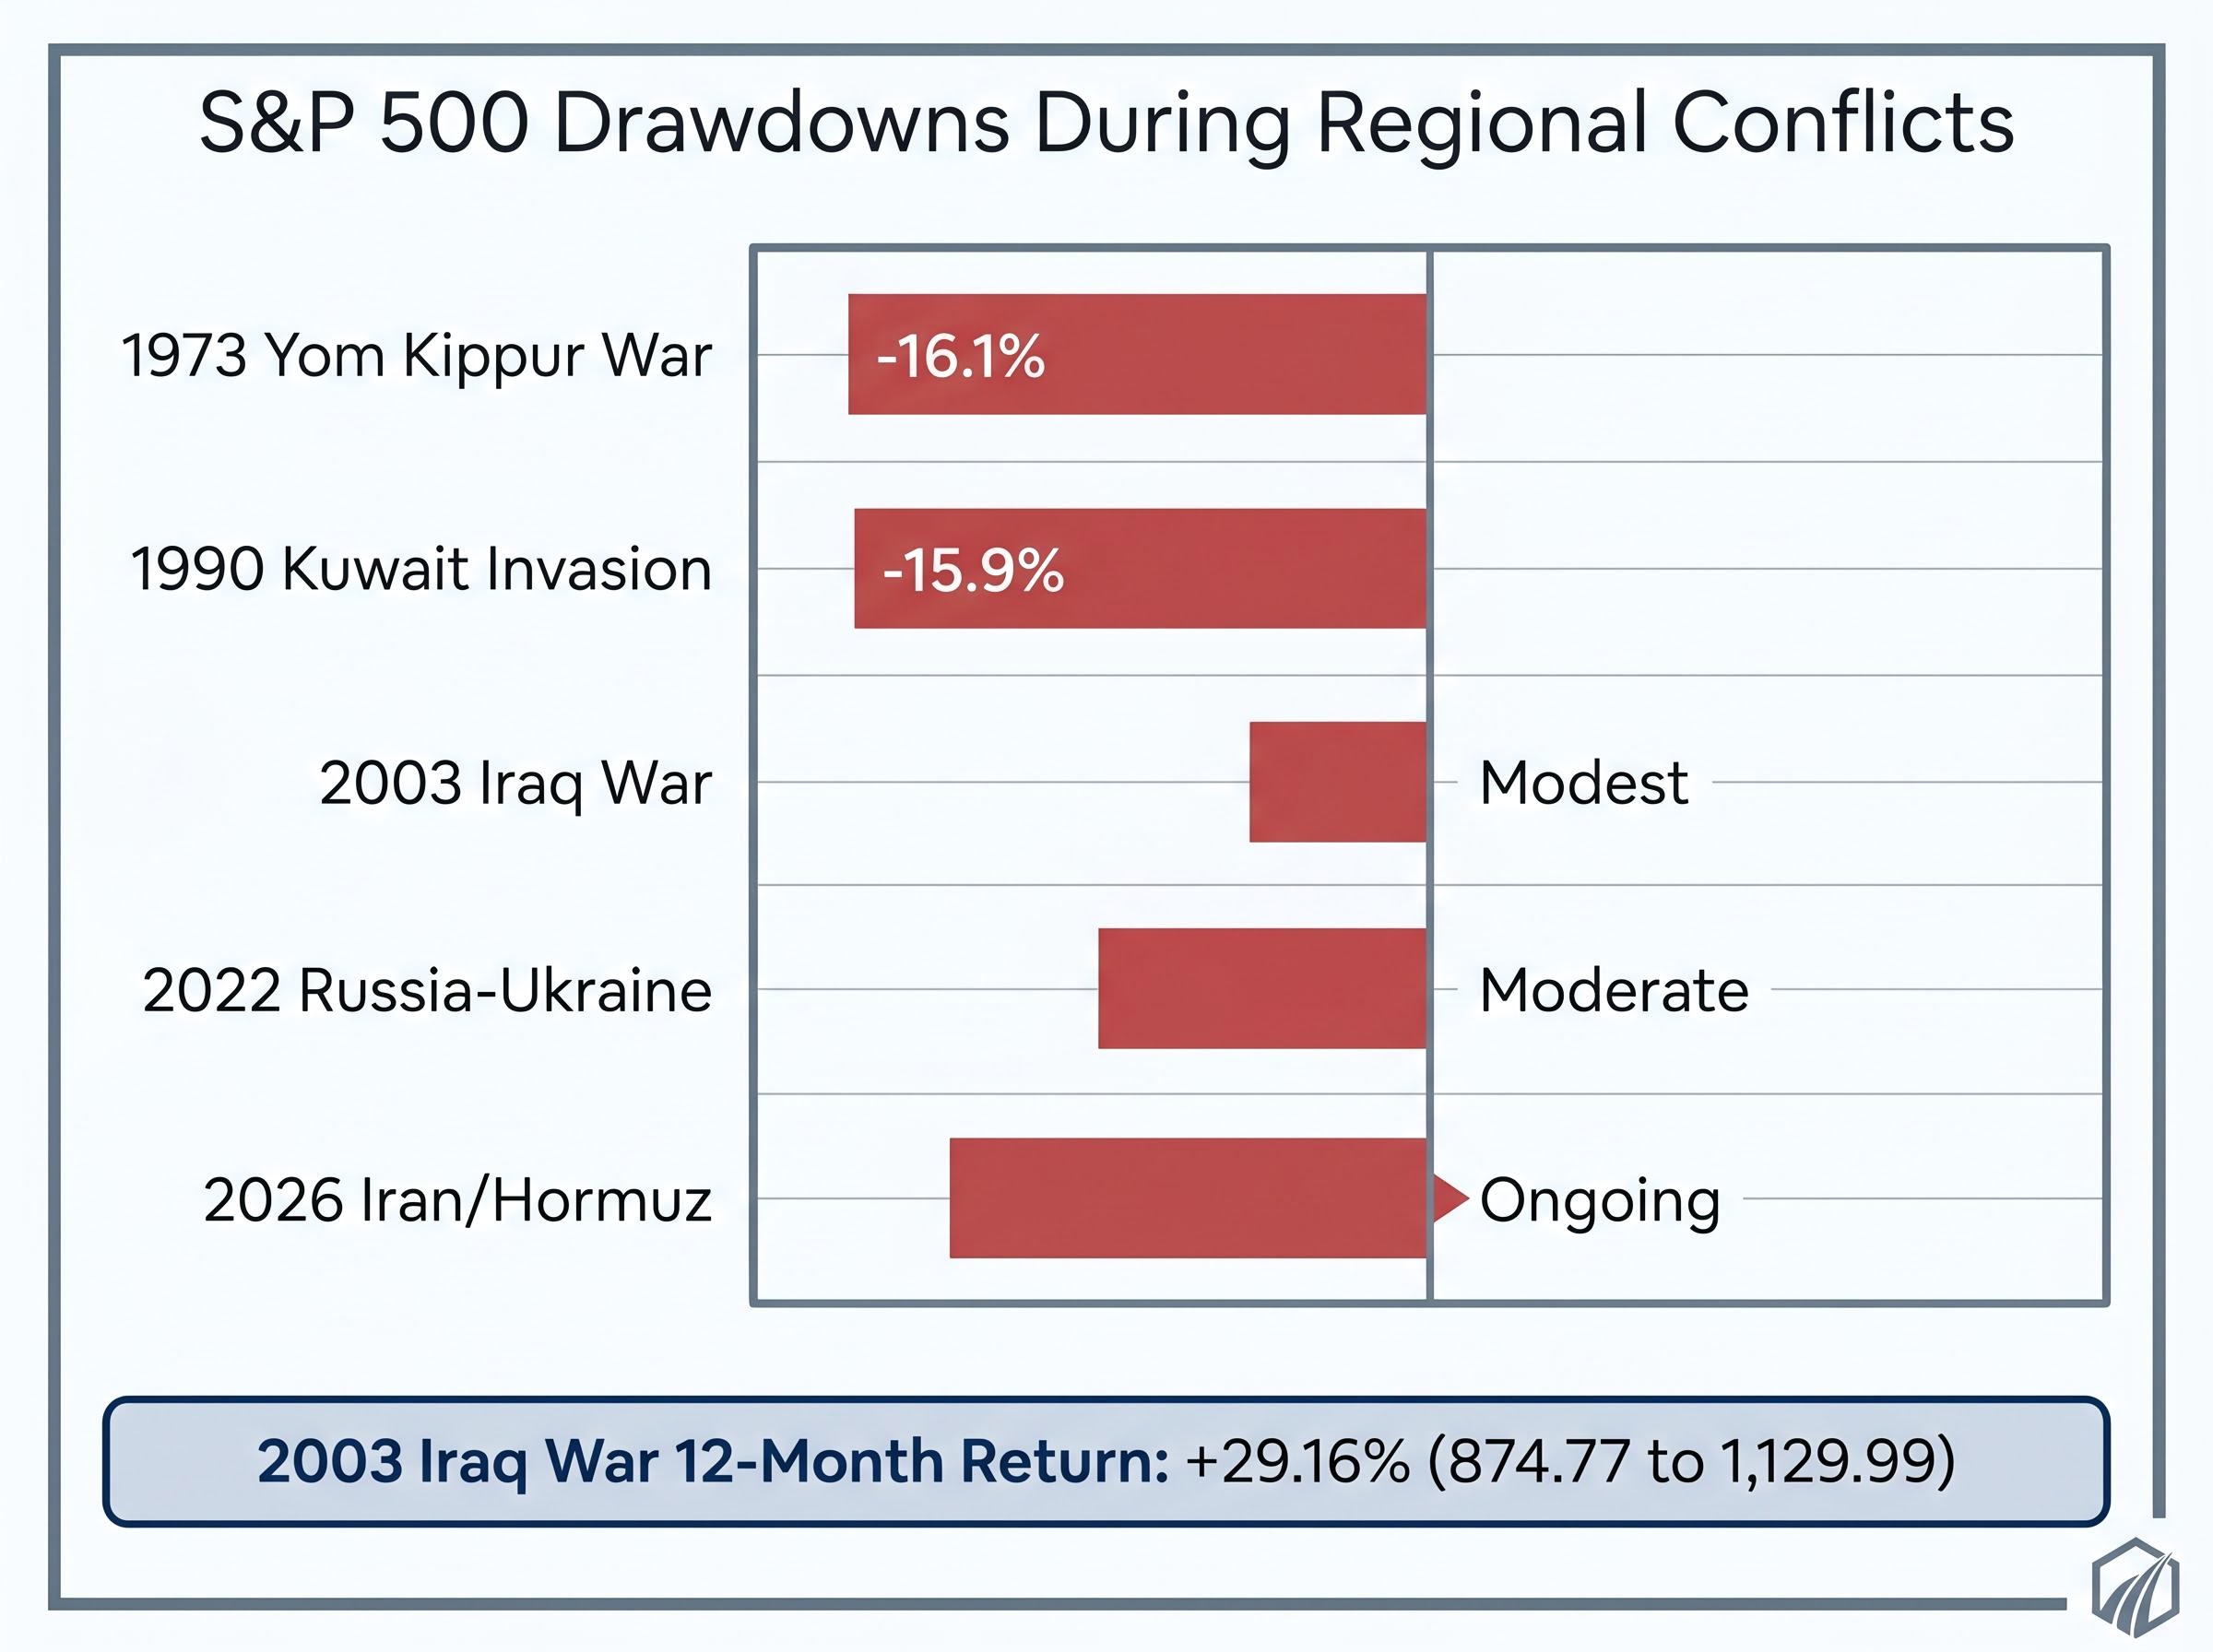
The two worst drawdowns in the dataset, 1973 and 1990, share a feature that separates them from every other case. Both involved a direct, sustained shock to global oil supply. The 1973 Yom Kippur War produced a 16.1% drawdown compounded by macro fragility that had nothing to do with the conflict itself. The 1990 Kuwait invasion produced a 15.9% drawdown driven by the same transmission channel: oil prices spiking, inflation expectations rising, and earnings forecasts compressing as a result.
Identifying that shared variable is what makes the energy section that follows the most important analytical thread in this piece.
Equity markets are forward-looking instruments. They do not track the daily intensity of conflict headlines; they discount the probable range of outcomes over a 3-30 month horizon, according to frameworks outlined by Fisher Investments in April 2026. This distinction, between real-time sentiment gauge and probabilistic pricing mechanism, is the foundation for understanding why Phase 3 recoveries begin before conflicts end.
The Phase 1 sell-off is an emotional response. Uncertainty spikes, risk models trigger selling, and capital moves to safety. Phase 3, by contrast, reflects analytical updating. Once the probability of containment rises, even modestly, forward-looking capital begins to reprice. Markets do not wait for confirmation; they price the shift in odds.
As U.S. Bank has observed, price swings during geopolitical events tend to fade when underlying economics remain steady. AllianceBernstein’s “Equities in Focus” report from 17 March 2026 reinforced this thesis: markets stabilise absent a direct linkage to recession.
AllianceBernstein’s core thesis holds that equity markets stabilise over longer horizons absent a confirmed connection between the conflict and recession-inducing economic dynamics.
Four conditions have historically accelerated the Phase 3 recovery:
When all four conditions hold, the six-week average recovery timeline tends to apply. When the third condition fails, the timeline extends materially.
Both the S&P 500 and the MSCI World index reached all-time highs in mid-to-late April 2026. That fact sits at the centre of a live analytical debate, and both sides carry genuine weight.
The rational repricing case rests on the historical base rate. Markets have been higher one year after conflict onset 73% of the time, with a median return near 9.7%. Phase 3 recoveries consistently precede formal resolution. The S&P 500 reaching a record in April with WTI at $105 is consistent with markets discounting a diplomatic resolution and pricing containment as the most probable outcome. AllianceBernstein and U.S. Bank both support the thesis that equities look through shocks absent recession confirmation.
The complacency risk case is not easily dismissed. Benjamin Cowen argued on 7 April 2026 that markets may be underpricing late-cycle oil risks, particularly at elevated absolute price levels. The 1973 parallel, the worst outcome in the modern dataset, occurred precisely when participants underestimated how long the energy disruption would last.
Financial Times complacency analysis published in March 2026 drew on institutional investor perspectives to frame the same tension: professional risk markets were pricing material disruption while equity indices absorbed the shock with relative calm, a divergence that the FT’s sources attributed partly to forward-looking discounting and partly to genuine underestimation of duration risk.
Shipping insurance costs at approximately 20 times normal levels signal that professional risk markets are pricing in substantial ongoing disruption, even as equity indices print record highs. The gap between what insurers are charging and what equity investors are pricing deserves scrutiny.
| Rational Repricing | Complacency Risk | |
|---|---|---|
| Supporting Evidence | S&P 500 at ATH; 73% base rate; WTI pulled back from peak | 20x insurance costs; WTI above $105; late-cycle oil risk |
| Historical Analogue | 2003 Iraq War (rapid Phase 3 recovery) | 1973 Yom Kippur War (prolonged drawdown) |
| Key Assumption | Hormuz closure is short; oil retreats below $100 | Closure persists; oil sustains above $110 |
| What Would Invalidate It | Diplomatic collapse; WTI breaks above $115 sustained | Rapid ceasefire; WTI drops below $90 |
The resolution is conditional. Rational repricing is the base case if the Hormuz closure is short and oil retreats. Complacency becomes the operative description if oil sustains above $110 and diplomatic talks collapse.
The three-phase framework is a probabilistic lens, not a prediction. Its value lies in calibrating expectations rather than eliminating uncertainty. Markets have been higher one year after conflict onset 73% of the time, with median returns near 9.7% and some analyses citing long-term averages closer to 12.5%. Those are base rates, not guarantees.
The 27% of cases where the pattern does not hold share a specific profile: a sustained oil shock overlapping with structural macroeconomic weakness. That combination, visible in 1973, is the primary failure mode.
Recession probability estimates from Goldman Sachs, JPMorgan, and Moody’s Analytics now range from 30% to 48.6% over the next 12 months, a range that would historically imply average S&P 500 drawdowns of approximately 32% from current levels and that represents the most direct quantitative challenge to the rational repricing thesis.
Three conditions historically define the difference between a Phase 3 recovery and a prolonged drawdown:
As of 1 May 2026, WTI sits at $105.49 (pulled back from a $113.99 peak), Pakistan-mediated talks are ongoing, and the Hormuz closure timeline remains unresolved. The framework offers structure. The monitoring variables will determine which historical precedent this conflict ultimately resembles.
Rapid equity recoveries during active conflicts reflect a historical norm, not investor naivety. The three-phase pattern has held across the majority of regional conflicts since 1959, and the 2026 market response, record highs in April despite an active naval blockade, is consistent with that record.
The energy-shock variable introduces genuine uncertainty that the simple base rate understates. Whether 2026 follows the 2003 script or the 1973 script depends on three live signals: WTI’s trajectory relative to the $110 threshold, the duration of the Hormuz closure, and the progress of Pakistan-mediated diplomacy. The framework laid out here is a starting point, not a verdict. The situation remains fluid, and the data that will determine which precedent applies has not yet arrived.
For investors wanting to translate this framework into portfolio decisions, our comprehensive walkthrough of geopolitical risk investing strategy covers the behavioural research on reactive trading during high-attention events, the convergent recommendations from Goldman Sachs, Morgan Stanley, and Charles Schwab on maintaining dollar-cost averaging, and the specific filter for distinguishing systematic rebalancing from costly headline-driven repositioning.
This article is for informational purposes only and should not be considered financial advice. Investors should conduct their own research and consult with financial professionals before making investment decisions. Past performance does not guarantee future results. Financial projections are subject to market conditions and various risk factors.
—
Historically, equity markets move through three phases during regional conflicts: an initial sell-off driven by uncertainty, a trough where worst-case scenarios dominate, and a recovery that begins before the conflict formally resolves. The S&P 500 has been higher one year after conflict onset 73% of the time, with a median return of approximately 9.7%.
Based on data covering regional conflicts since 1959, non-energy conflicts see equity markets recover to pre-shock levels in approximately six weeks on average. Oil-shock conflicts, such as the 1973 Yom Kippur War and the 1990 Kuwait invasion, produced drawdowns of around 15-16% and took significantly longer to recover.
A sustained oil price shock is the single most explanatory variable separating fast recoveries from prolonged drawdowns. When oil prices remain elevated above approximately $100-110 per barrel, inflation risk compresses corporate earnings expectations, extending the downturn, as seen in both 1973 and 1990.
WTI Crude stood at $105.49 per barrel on 1 May 2026, having peaked near $113.99 around 29 April 2026, while both the S&P 500 and MSCI World reached all-time highs in April 2026. Shipping insurance costs for Hormuz passage have risen to approximately 20 times normal levels, signalling a divergence between professional risk markets and equity index pricing.
Investors should watch three key signals: whether WTI retreats toward $90 (a containment signal) or sustains above $110 (the inflation transmission threshold), the duration of the Hormuz closure, and progress in Pakistan-mediated diplomatic talks, which could shift the probability distribution toward a faster resolution.