How the RBA’s Hawkish Pause Reshapes Australian Bank Shares
2 mins ago

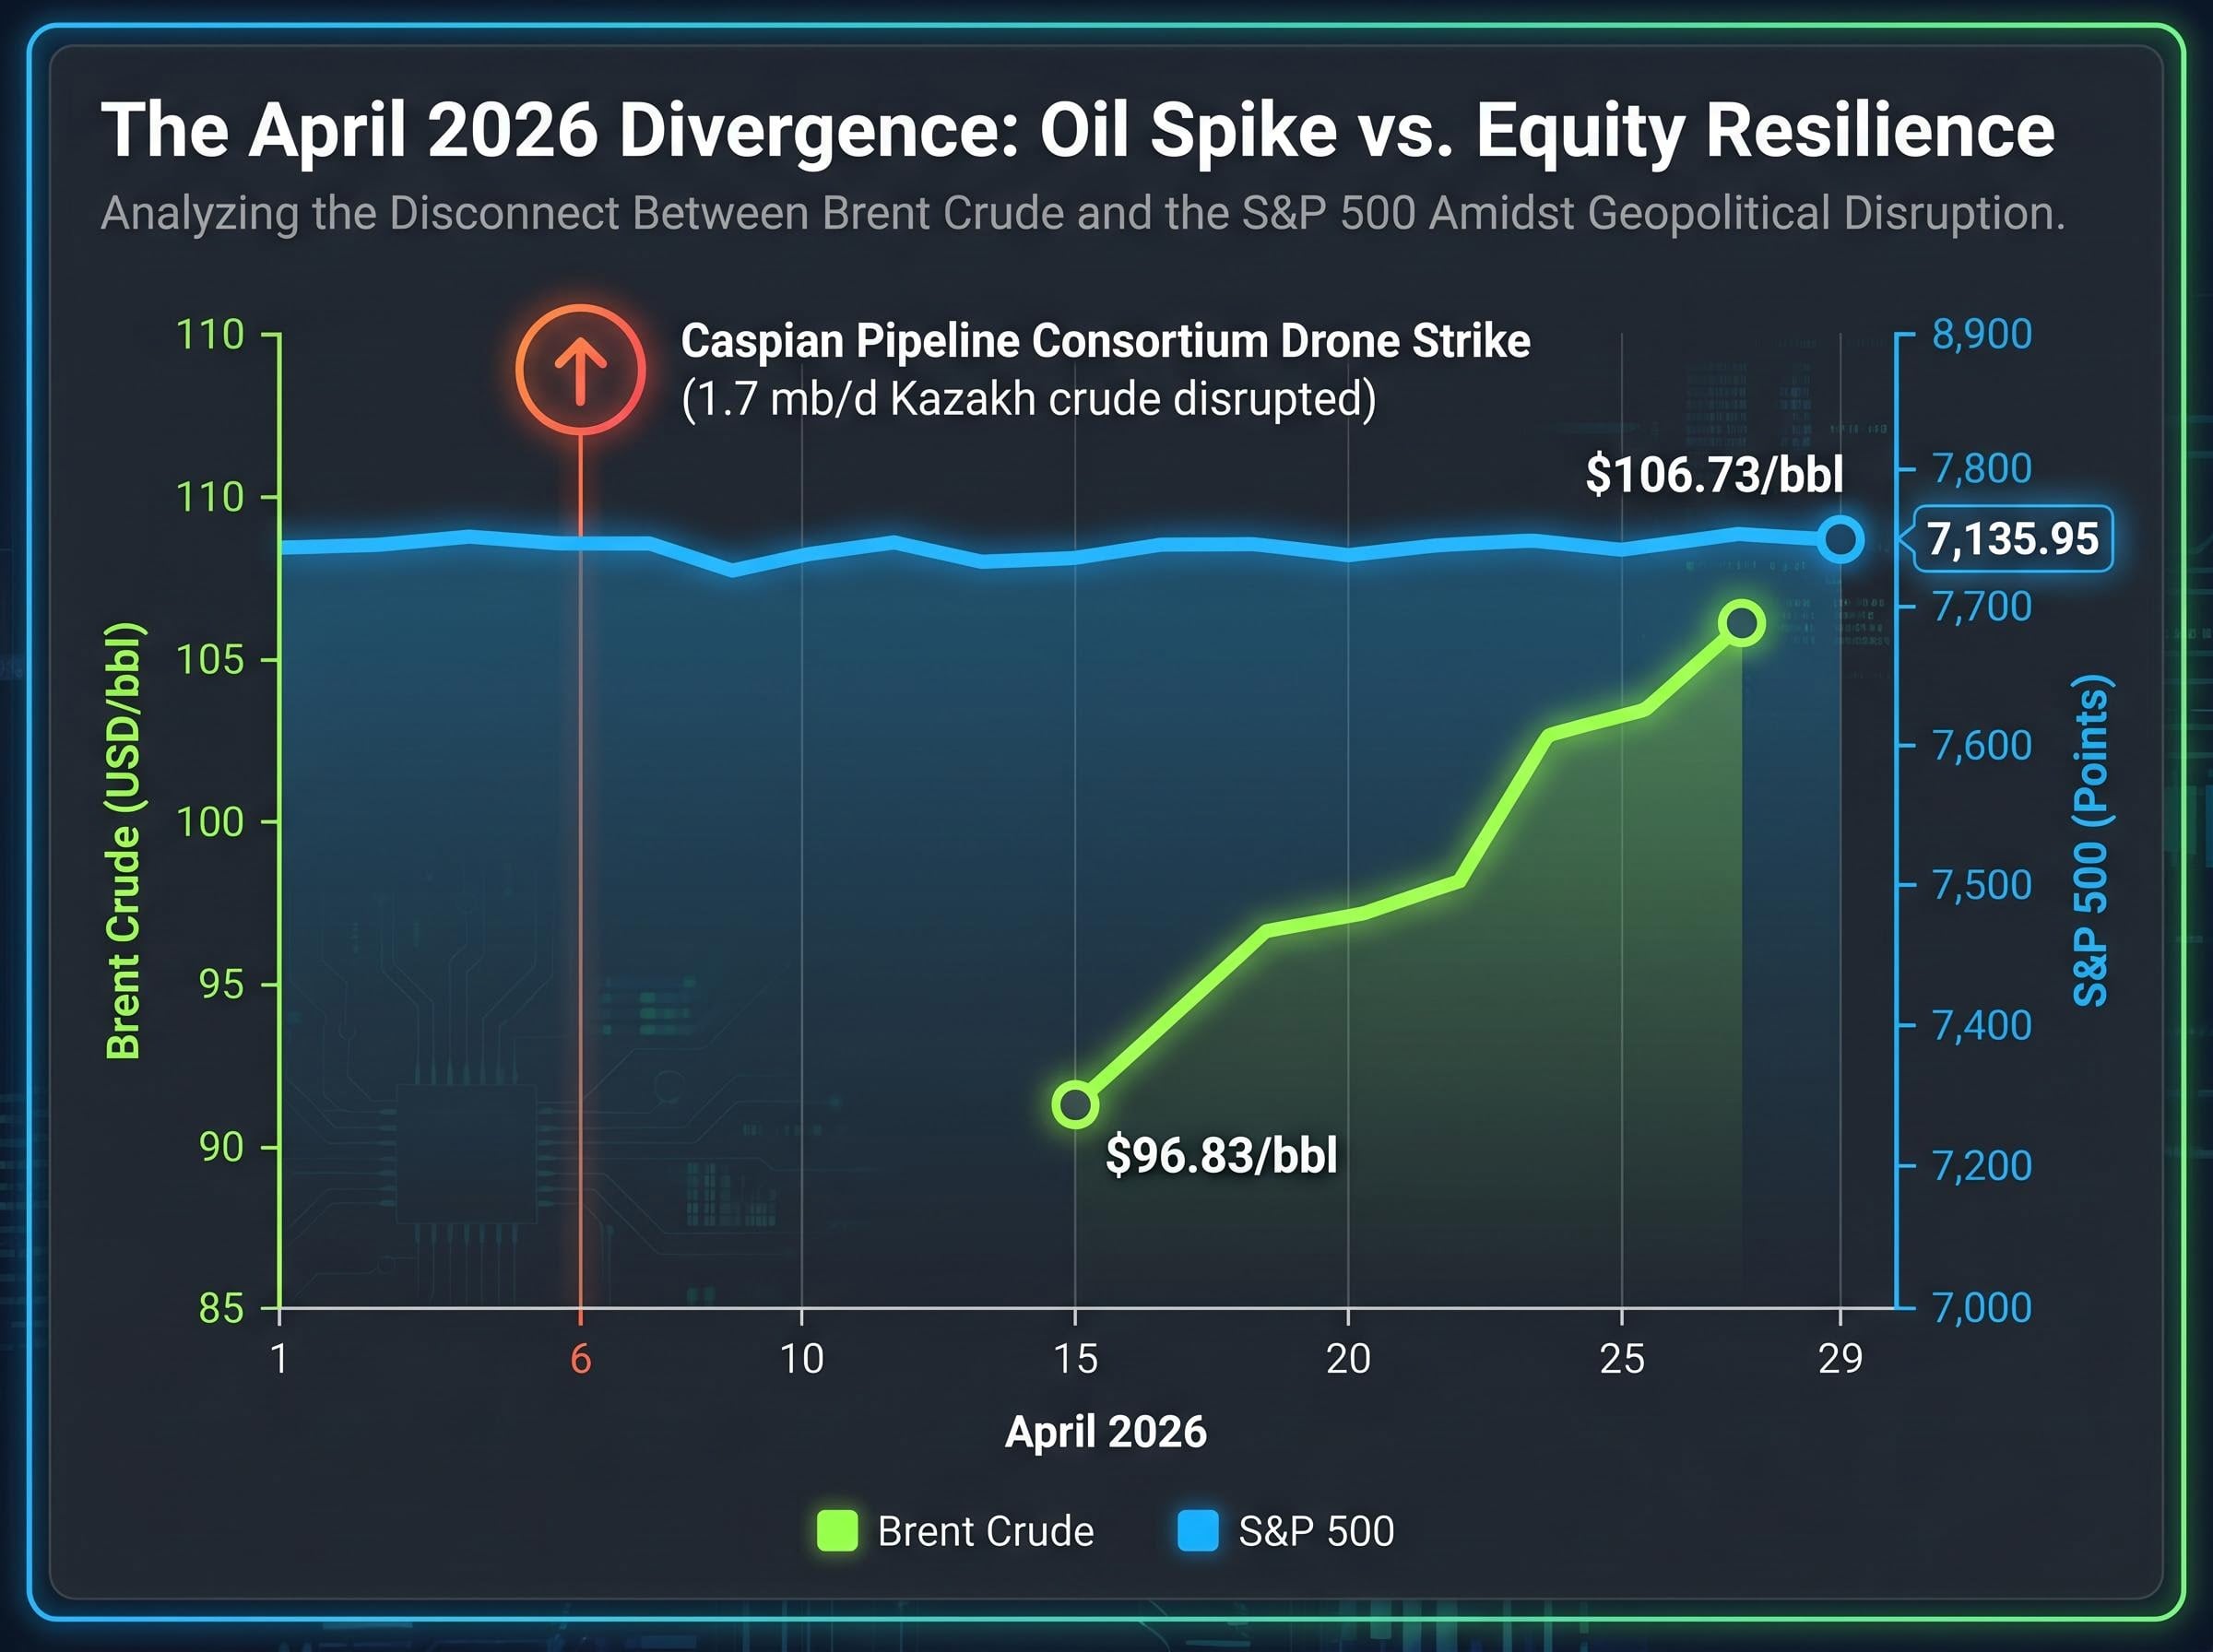
When Ukrainian drones struck the Caspian Pipeline Consortium terminal at Novorossiysk on 6 April 2026, disrupting roughly 1.7 million barrels per day of Kazakh crude, most observers expected equity markets to flinch. They largely did not. Brent crude climbed from $96.83 per barrel on 15 April to $106.73 by 27 April, yet the S&P 500 closed at approximately 7,135.95 on 29 April, holding near record territory. The gap between geopolitical risk and stock market behaviour has puzzled commentators for decades, and the April 2026 episode is only the latest example. That gap is not a flaw in how markets function. It is, in fact, the clearest signal of how they actually work. This article explains the mechanism behind that resilience, walks through the historical pattern it follows, and offers a practical framework for reading markets the next time an alarming headline arrives.
On 6 April 2026, a drone strike set fire to one of the Black Sea’s most important oil export terminals. Within days, energy analysts were warning of sustained supply disruption across European crude markets. Cable news segments featured maps of the Caspian pipeline route overlaid with explosion graphics. The language was urgent.
The price action told a different story.
This is not a market ignoring reality. It is a market and a newsroom measuring different things. Headlines report events as they occur; their job is to communicate what happened. Prices report expectations about what happens next, weighted by probability and discounted across months and years of future earnings. The two outputs can diverge sharply without either being wrong.
Capital reallocation during conflict follows sector-specific patterns that are distinct from broad index moves: energy inflation compresses margins in aviation and consumer discretionary while simultaneously accelerating institutional flows into technology infrastructure and alternative energy, a divergence that aggregate index-level data can obscure.
Understanding why they diverge is the first step toward reading market behaviour accurately during periods of geopolitical stress.
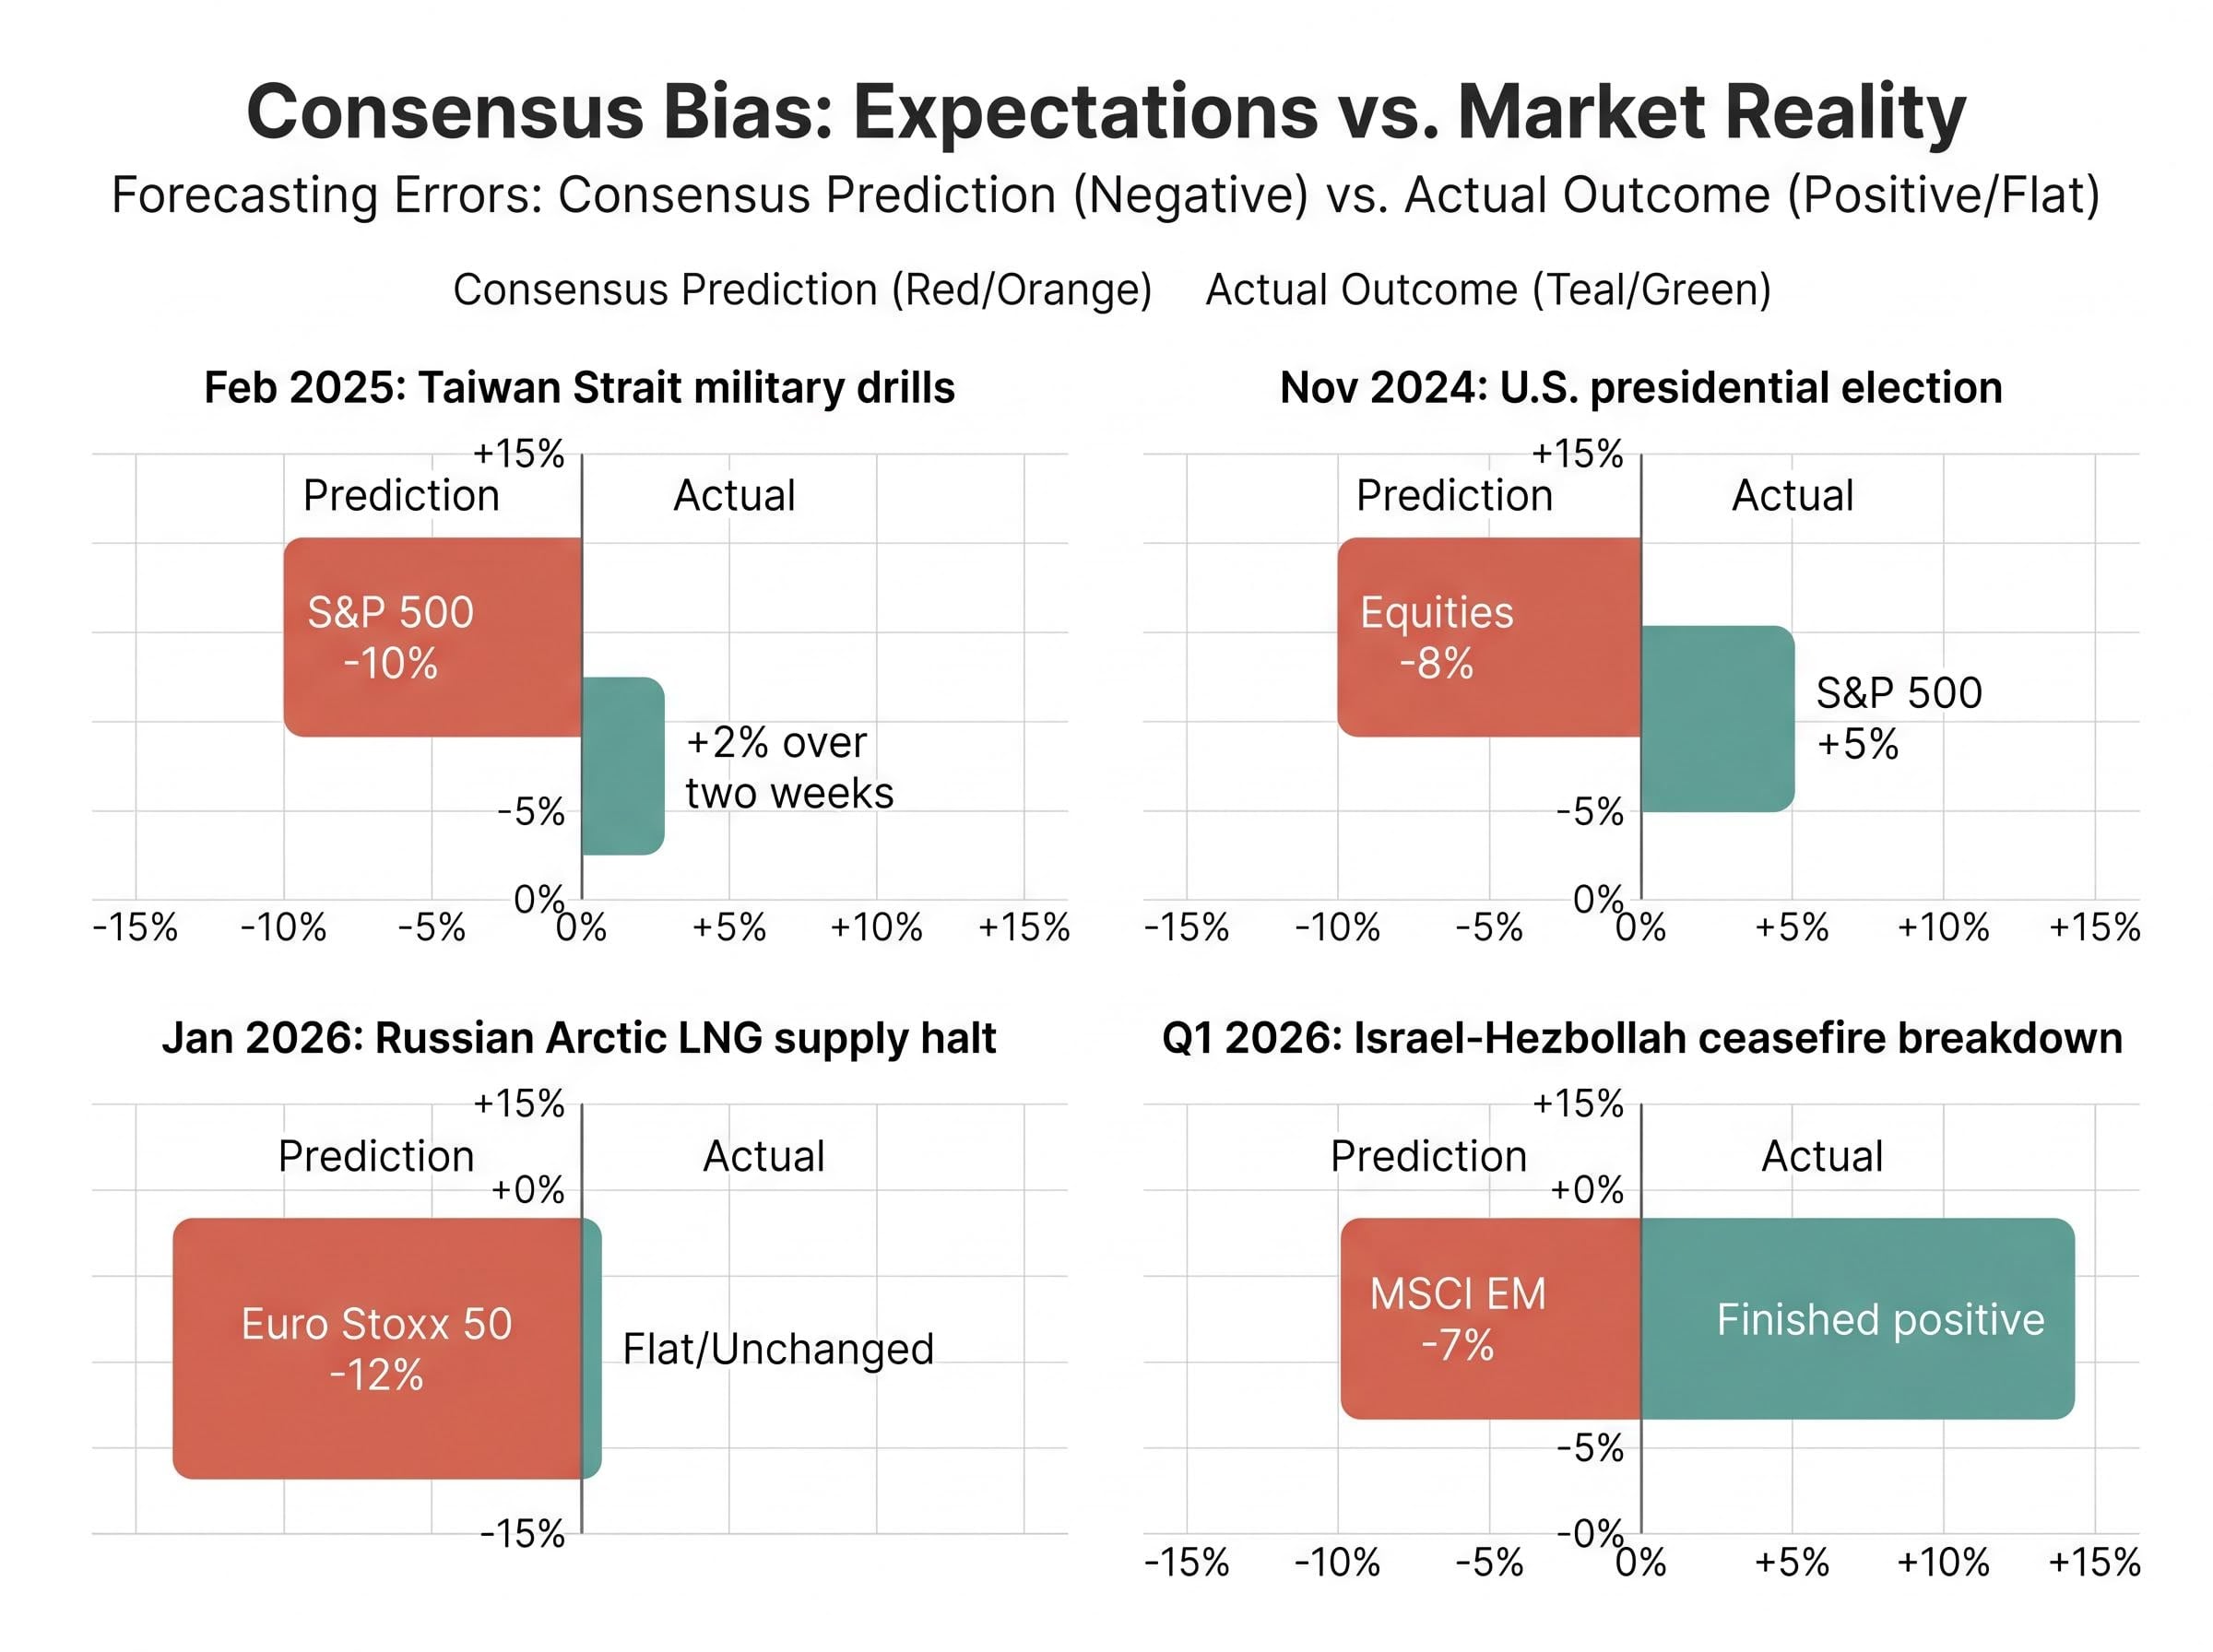
If markets process geopolitical risk through probabilistic discounting, the consensus view, shaped by headlines, availability bias, and the natural human tendency to overweight vivid threats, processes it differently. The result is a documented and recurring gap between what consensus expects and what markets deliver.
| Event | Consensus Prediction | Actual Outcome | Period |
|---|---|---|---|
| Taiwan Strait military drills | S&P 500 down approximately 10% | Markets gained approximately 2% over two weeks | February 2025 |
| U.S. presidential election | Significant VIX spike; equities down 8% | S&P 500 rose approximately 5% post-result | November 2024 |
| Russian Arctic LNG supply halt | Euro Stoxx 50 down approximately 12% | Flat to unchanged; mild winter reduced demand | January 2026 |
| Israel-Hezbollah ceasefire breakdown | MSCI EM down approximately 7% | MSCI EM finished positive | Q1 2026 |
In every case, the consensus overestimated the severity of the equity impact. The pattern is not random. It reflects a structural bias: consensus forecasting is anchored in headline salience, the psychological phenomenon where the most vivid and recent information dominates judgment. Markets aggregate a broader, longer-term probabilistic view that weights adaptation, spare capacity, and policy response.
Gillian Tett, writing in the Financial Times on 30 April 2026, observed that investors tend to ignore Hormuz scares, as they did with the 2019 drone attacks. Resilience, she argued, may reflect media amplification bias rather than genuine risk mispricing.
The principle that emerges is direct: when markets move contrary to consensus expectations on geopolitical events, the historical record suggests it is the consensus, not the market, that is more likely to be wrong. This does not mean consensus is always wrong. It means its error rate on geopolitical impact is high enough to warrant structural scepticism rather than default deference.
Retail sentiment surveys in April 2026 showed 46% bullish readings even as energy costs eroded household purchasing power, a divergence that institutional analysts flagged as a warning sign: sentiment-driven optimism built on depleted savings rather than income growth has historically proven fragile when supply shocks persist beyond a single quarter.
A common assumption is that equity markets function as real-time scorecards: bad event happens, prices fall in proportion to the event’s severity. If that were true, every drone strike, every naval confrontation, every sanctions announcement would produce a proportional drawdown. It does not work that way.
Markets are forward-looking aggregators of probabilistic expectations. At any given moment, the price of an index reflects the collective view of thousands of participants about corporate profitability over the next 3 to 30 months, weighted by the probability each participant assigns to various outcomes. A geopolitical event enters this system not as a headline but as a probability-adjusted input: how likely is it that this event produces a sustained hit to earnings?
Geopolitical Risk (GPR) Index: Developed by economists Caldara and Iacoviello, the GPR Index tracks the frequency of adverse geopolitical event mentions in major newspapers. Spikes in the index correlate with elevated market volatility, but the relationship between GPR readings and sustained equity drawdowns is nonlinear; most spikes produce temporary turbulence, not lasting damage.
Caldara and Iacoviello’s GPR Index methodology, published in the American Economic Review, constructs the index by tracking adverse geopolitical event mentions across major newspapers, establishing a rigorous empirical basis for the observed nonlinear relationship between geopolitical stress spikes and sustained equity drawdowns.
IMF Chief Economist Pierre-Olivier Gourinchas offered a complementary framing on 10 April 2026, characterising Middle East tensions as adding meaningful oil volatility but only a modest drag on global GDP. Markets, he suggested, were broadly correct to discount transient shocks.
Three layers explain how this processing works in practice:
The result is a system that reacts to events but does not overreact to headlines. For readers, this distinction is the difference between chasing every news cycle and reading price behaviour as the information source it actually is.
The April 2026 CPC disruption is not the first time markets have absorbed a geopolitical shock to energy infrastructure and emerged largely intact. The pattern across multiple historical episodes is consistent enough to constitute a documented sequence rather than a theory.
| Event | Year | Initial Equity Impact | Recovery Timeline | Key Factor |
|---|---|---|---|---|
| Gulf War (Kuwait invasion) | 1990 | S&P 500 down approximately 10-15% | Months | Conflict resolved on defined timeline |
| Abqaiq/Khurais attack | 2019 | Oil spiked approximately 15% in one session | Two weeks | Saudi Aramco restored production rapidly |
| Ukraine invasion | 2022 | European equities down; U.S. more resilient | Several months | Supply chains adapted; U.S. less exposed |
The sequence follows a broadly consistent three-phase structure. In the first few days, volatility spikes and prices draw down as uncertainty peaks. Over the following one to two weeks, markets reassess as the severity of actual disruption becomes clearer. Within weeks to a few months, recovery takes hold as supply chains reroute, policy responses materialise, and the probability of worst-case outcomes declines.
According to research published by the CFA Institute and the Journal of Financial Economics, average peak-to-trough equity drawdowns from geopolitical events have historically ranged from 5-10%, with recovery typically measured in weeks to a few months.
The three-phase sequence holds when events do not produce sustained economic disruption. When they do, the timeline stretches.
The 2022 European energy market is the clearest recent example. The scale of the Ukraine conflict and Europe’s direct dependence on Russian gas meant supply chains required months, not weeks, to adapt. European equities took considerably longer to stabilise than their U.S. counterparts. Even this episode, however, resolved without permanent structural impairment.
The conditions that override the standard pattern are specific: sustained supply disruption that cannot be rerouted, escalation to direct conflict between major economic powers, or knock-on effects severe enough to trigger recession. These are the scenarios worth monitoring, even when they appear unlikely.
The counterargument, that equity markets in April 2026 are actively mispricing tail scenarios worth monitoring, centres on the delayed inflation channel: crude oil above $100 per barrel transmits into transportation and producer prices over several quarters, meaning the full cost of the energy shock may not appear in earnings data until well after headlines have moved on.
Understanding the historical pattern is useful. Understanding why it repeats is more durable. The answer lies in the structural adaptability of global energy markets, a feature that rarely receives the same attention as the disruption itself.
When the CPC terminal came under attack on 6 April 2026, European buyers faced the loss of 1.7 mb/d of Kazakh crude. The disruption was real. But the response mechanism activated quickly. Europe drew on increased Norwegian gas imports, additional LNG cargoes from U.S. and Qatari suppliers, and the possibility of strategic petroleum reserve releases. No major blackouts resulted.
This adaptive sequence follows a broadly predictable order:
The 2022 supply chain rerouting after the Nord Stream disruptions served as a proof of concept for this adaptive capacity, with European energy systems adjusting over a period of months.
None of this eliminates tail risk. JPMorgan energy analyst Natasha Kane warned on 25 April 2026 that markets may underprice the most extreme scenarios.
“A real Hormuz blockade could spike oil above $120/bbl and trigger significant equity drawdowns.”
That warning deserves weight. The distinction is between a localised disruption, where adaptation mechanisms engage rapidly, and a systemic blockade of a chokepoint through which a large share of global supply flows. Markets do not dismiss the latter; they assign it a low probability and adjust that probability as evidence warrants.
The analytical argument matters less if it does not translate into something a reader can use. The following three questions offer a framework for evaluating the next geopolitical headline before reacting to it.
Goldman Sachs strategists noted in April 2026 that S&P 500 performance was driven by earnings growth (EPS growth of approximately 12%) rather than geopolitical headlines, even amid Hormuz tensions. When fundamental anchors like earnings growth remain intact, they tend to outweigh sentiment shocks.
Fiona Hill, senior fellow at the Brookings Institution, cautioned on 1 May 2026 that market resilience can shade into complacency, drawing parallels to pre-1973 conditions if escalation accelerates. The framework should include recognition of the conditions that would override the historical pattern, not dismiss them.
This article is for informational purposes only and should not be considered financial advice. Investors should conduct their own research and consult with financial professionals before making investment decisions. Past performance does not guarantee future results.
As of late April 2026, Brent crude sits above $100 per barrel. A Caspian pipeline terminal has been struck by drones. Middle East rhetoric remains elevated. And equity markets are near record levels. The gap between those facts and the price action is not complacency. It is the output of a system that processes geopolitical information faster and more probabilistically than media or conventional wisdom.
The three-phase recovery pattern, the structural adaptability of energy markets, the documented failure rate of consensus geopolitical forecasts: these are not arguments for ignoring risk. They are arguments for calibrating the response to the probable magnitude of economic disruption rather than the magnitude of the headline.
The framework works until it does not. The conditions under which it breaks down, sustained disruption, major-power escalation, recession-level knock-on effects, are worth taking seriously even when they appear remote.
Investors wanting to model the specific pathways through which sustained crude prices above $100 per barrel flow into GDP contraction will find our full explainer on oil price transmission channels covers all four simultaneous mechanisms, reduced consumer disposable income, rising business input costs, Federal Reserve rate pressure, and an investment and hiring pullback, with historical recession precedents from 1973 onward.
The next geopolitical headline will arrive. Before defaulting to alarm, check the price. It may already contain the answer.
—
Geopolitical risk does not automatically translate into sustained equity drawdowns because markets are forward-looking aggregators of probabilistic expectations, pricing in the likelihood of lasting economic consequences rather than reacting proportionally to headline events.
The S&P 500 closed at approximately 7,135.95 on 29 April 2026 because markets assessed the disruption as localised and adaptable, with spare capacity, strategic reserves, and alternative supply routes offsetting the loss of 1.7 million barrels per day of Kazakh crude.
According to CFA Institute and Journal of Financial Economics research, average peak-to-trough equity drawdowns from geopolitical events have historically ranged from 5-10%, with recovery typically measured in weeks to a few months, depending on whether the disruption is localised or structural.
The three-phase recovery pattern breaks down when events produce sustained supply disruption that cannot be rerouted, escalation to direct conflict between major economic powers, or knock-on effects severe enough to trigger recessionary conditions.
Investors should ask three questions: whether the event's economic consequences are actually severe, whether the disruption is localised or structural, and whether the market's price reaction is diverging from or confirming the consensus narrative, using price behaviour as the primary information source.