Hormuz Shipping Collapses 52% as US-Iran Clash Sends Oil Surging
5 hrs ago

Global oil markets absorbed a seismic announcement on 28 April 2026: the UAE, OPEC’s fourth-largest producer, declared it was leaving the cartel effective 1 May. Within 72 hours, the US reported its economy had accelerated sharply, with first-quarter GDP rebounding to 2.0% annualised growth. Both developments landed in the same week, and both pointed in the same direction: the three fears that had defined investor sentiment heading into May, OPEC’s grip on oil supply, a sluggish US economy, and a fragile eurozone, were each tested and found less solid than markets had assumed.
What follows explains what the UAE’s departure actually means for OPEC’s market power, what the Q1 GDP figures reveal about economic resilience on both sides of the Atlantic, and why the combination of these developments may matter more for investor outlook than either story does in isolation.
At its peak in the 1970s and 1980s, OPEC wielded extraordinary influence. The Arab oil embargo produced fuel rationing across Western nations and cemented the cartel’s reputation as the single most powerful actor in energy markets. That reputation has persisted in investor psychology long after the structural reality shifted.
Over the past two decades, US shale production, alongside output growth in Canada, Brazil, and Guyana, has steadily diluted OPEC’s share of global supply. The US now accounts for approximately 22% of worldwide crude output, establishing it as the primary swing producer. OPEC’s projected share following the UAE’s exit falls to roughly 26%, down from 30%.
Fisher Investments has characterised persistent OPEC fear as a “false fear” and a feature of the market’s “wall of worry,” noting that investors consistently overestimate the cartel’s ability to dictate prices.
The broader OPEC+ grouping, which includes non-member producers such as Russia, collectively holds approximately 43% of global production. Yet even that figure overstates coordinated control, given chronic compliance gaps among members.
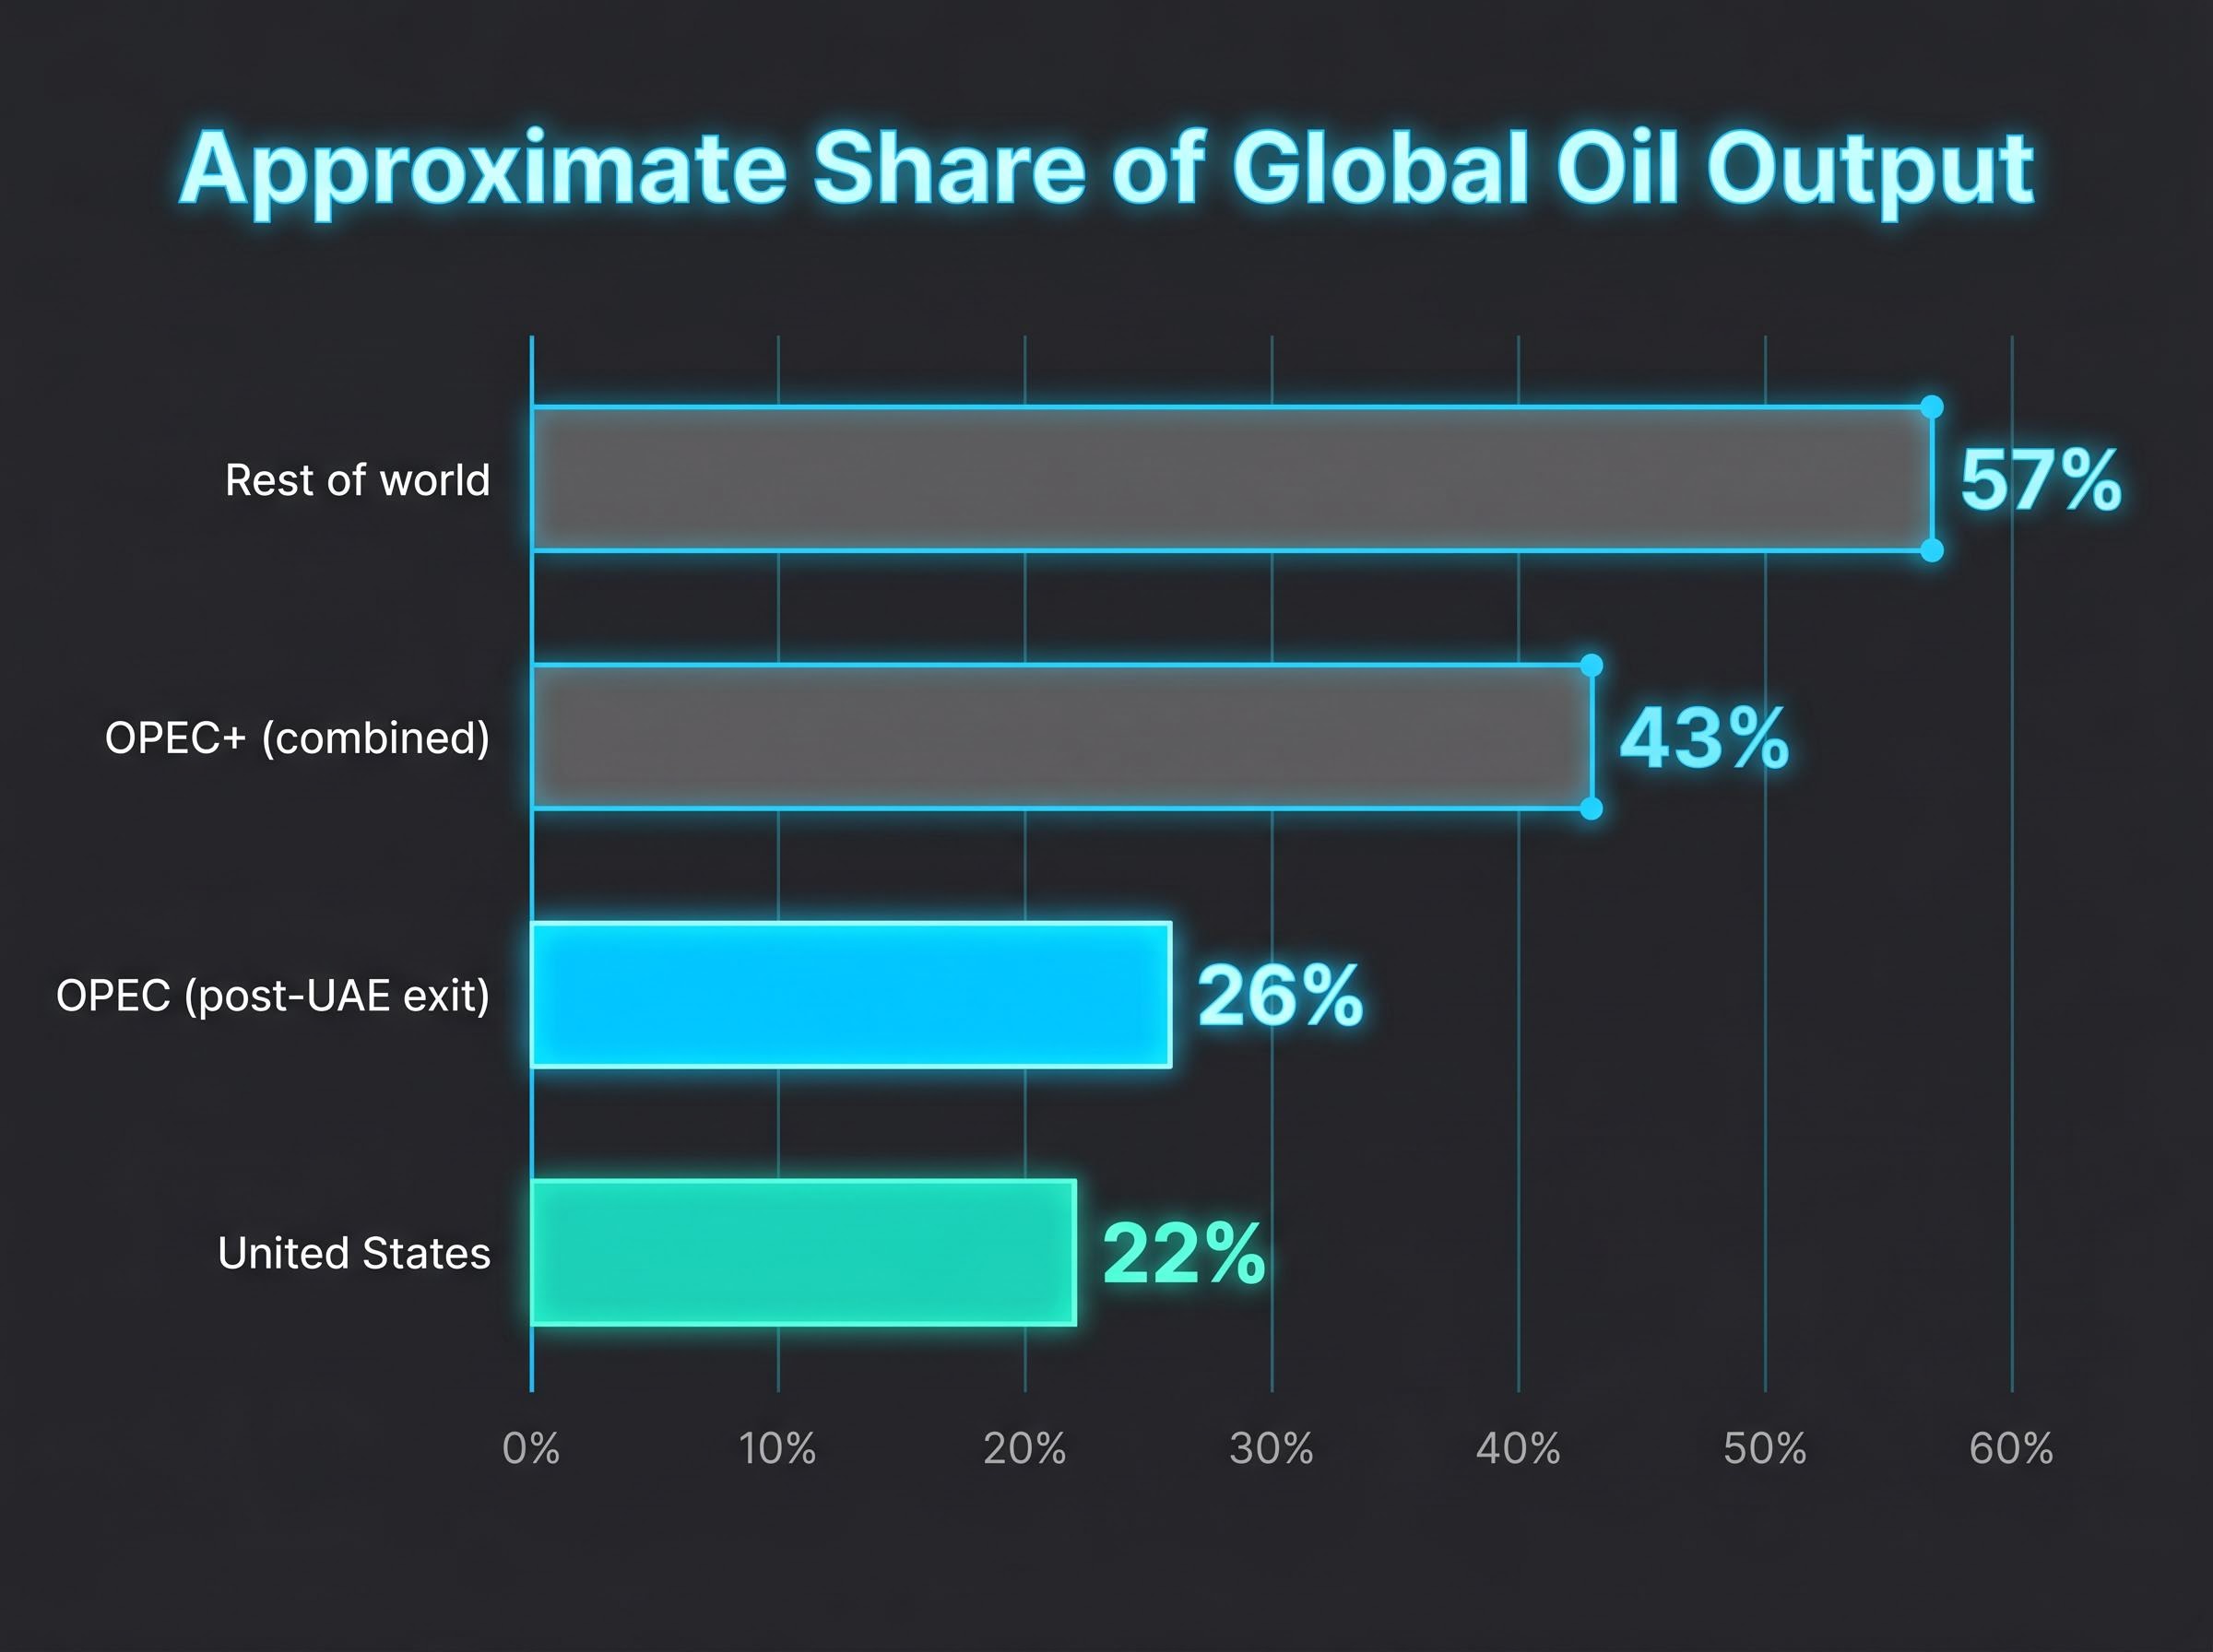
| Producer group | Approximate share of global output |
|---|---|
| OPEC (post-UAE exit) | ~26% |
| United States | ~22% |
| OPEC+ (combined) | ~43% |
| Rest of world | ~57% |
Investors who continue to price OPEC as the dominant force in oil markets are operating on a mental model that is decades out of date.
Investor sentiment divergence between retail optimism and the physical economic realities of sustained $100-plus oil has been one of the more unusual features of the 2026 market environment, with 46% bullish retail expectations running alongside institutional warnings of significant corrections in the same weeks that GDP data was being released.
Abu Dhabi’s decision did not arrive without warning. Three factors had been building for years:
UAE Energy Minister Suhail Al Mazrouei framed the decision as reflecting national interests amid exceptional circumstances. Official language described the move as “a policy-driven evolution in the UAE’s approach, enhancing flexibility to respond to market needs.”
The UAE Energy Minister on production targets confirmed the 5 million barrel per day ambition publicly on the day of the exit announcement, framing the departure as a deliberate alignment of national output strategy with long-term production capacity rather than a reactive response to any single quota dispute.
The UAE accounted for approximately 12% of OPEC’s overall production capacity. Its departure is not impulsive; it reflects years of accumulated frustration and a clearly articulated national production strategy. That context matters for assessing whether other Gulf producers might eventually follow the same path.
OPEC manages supply through production quotas assigned to member nations. Each member receives an output ceiling; in theory, coordinated cuts or increases allow the cartel to influence global prices by tightening or loosening supply.
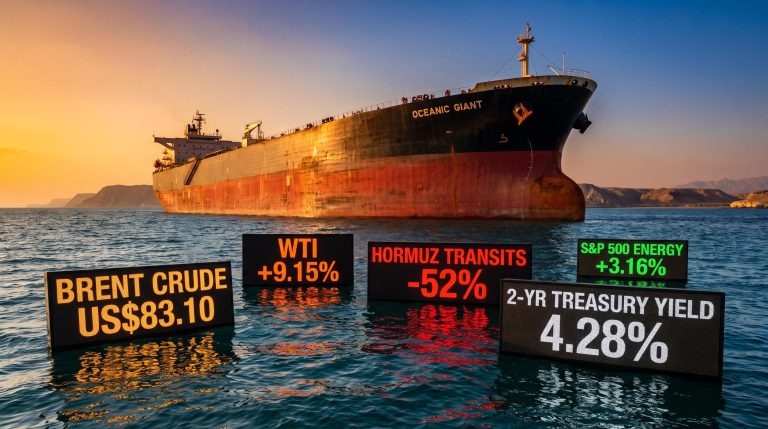
In practice, compliance has always been uneven. Members routinely produce above their quotas, and the gap between announced cuts and actual output has widened as non-OPEC supply has grown. Oil prices stood at approximately $110 per barrel as of 28 April 2026, roughly 53% higher than the pre-war Brent level of approximately $72 per barrel. That price elevation reflects ongoing Strait of Hormuz disruption and geopolitical risk premiums, not successful cartel coordination.
The Hormuz closure had already removed approximately 13 million barrels per day from global supply before the UAE’s exit was announced, a disruption the IEA described as having no modern parallel in scale or duration, and one that explains why current prices reflect geopolitical risk premiums more than cartel coordination.
Analyst assessments suggest the UAE’s exit may not have immediate price effects on oil markets. Current Hormuz constraints limit how quickly the UAE’s production expansion ambitions translate to market-available supply, meaning the real impact is structural rather than immediate.
Spare capacity, production that can be brought online quickly during a supply shock, is OPEC’s primary mechanism for managing crises. The sequence works as follows:
The UAE held a disproportionate share of spare capacity relative to its quota. Its exit weakens OPEC’s crisis-response ability more than its day-to-day market share suggests, removing a buffer the cartel had relied upon to absorb supply shocks.
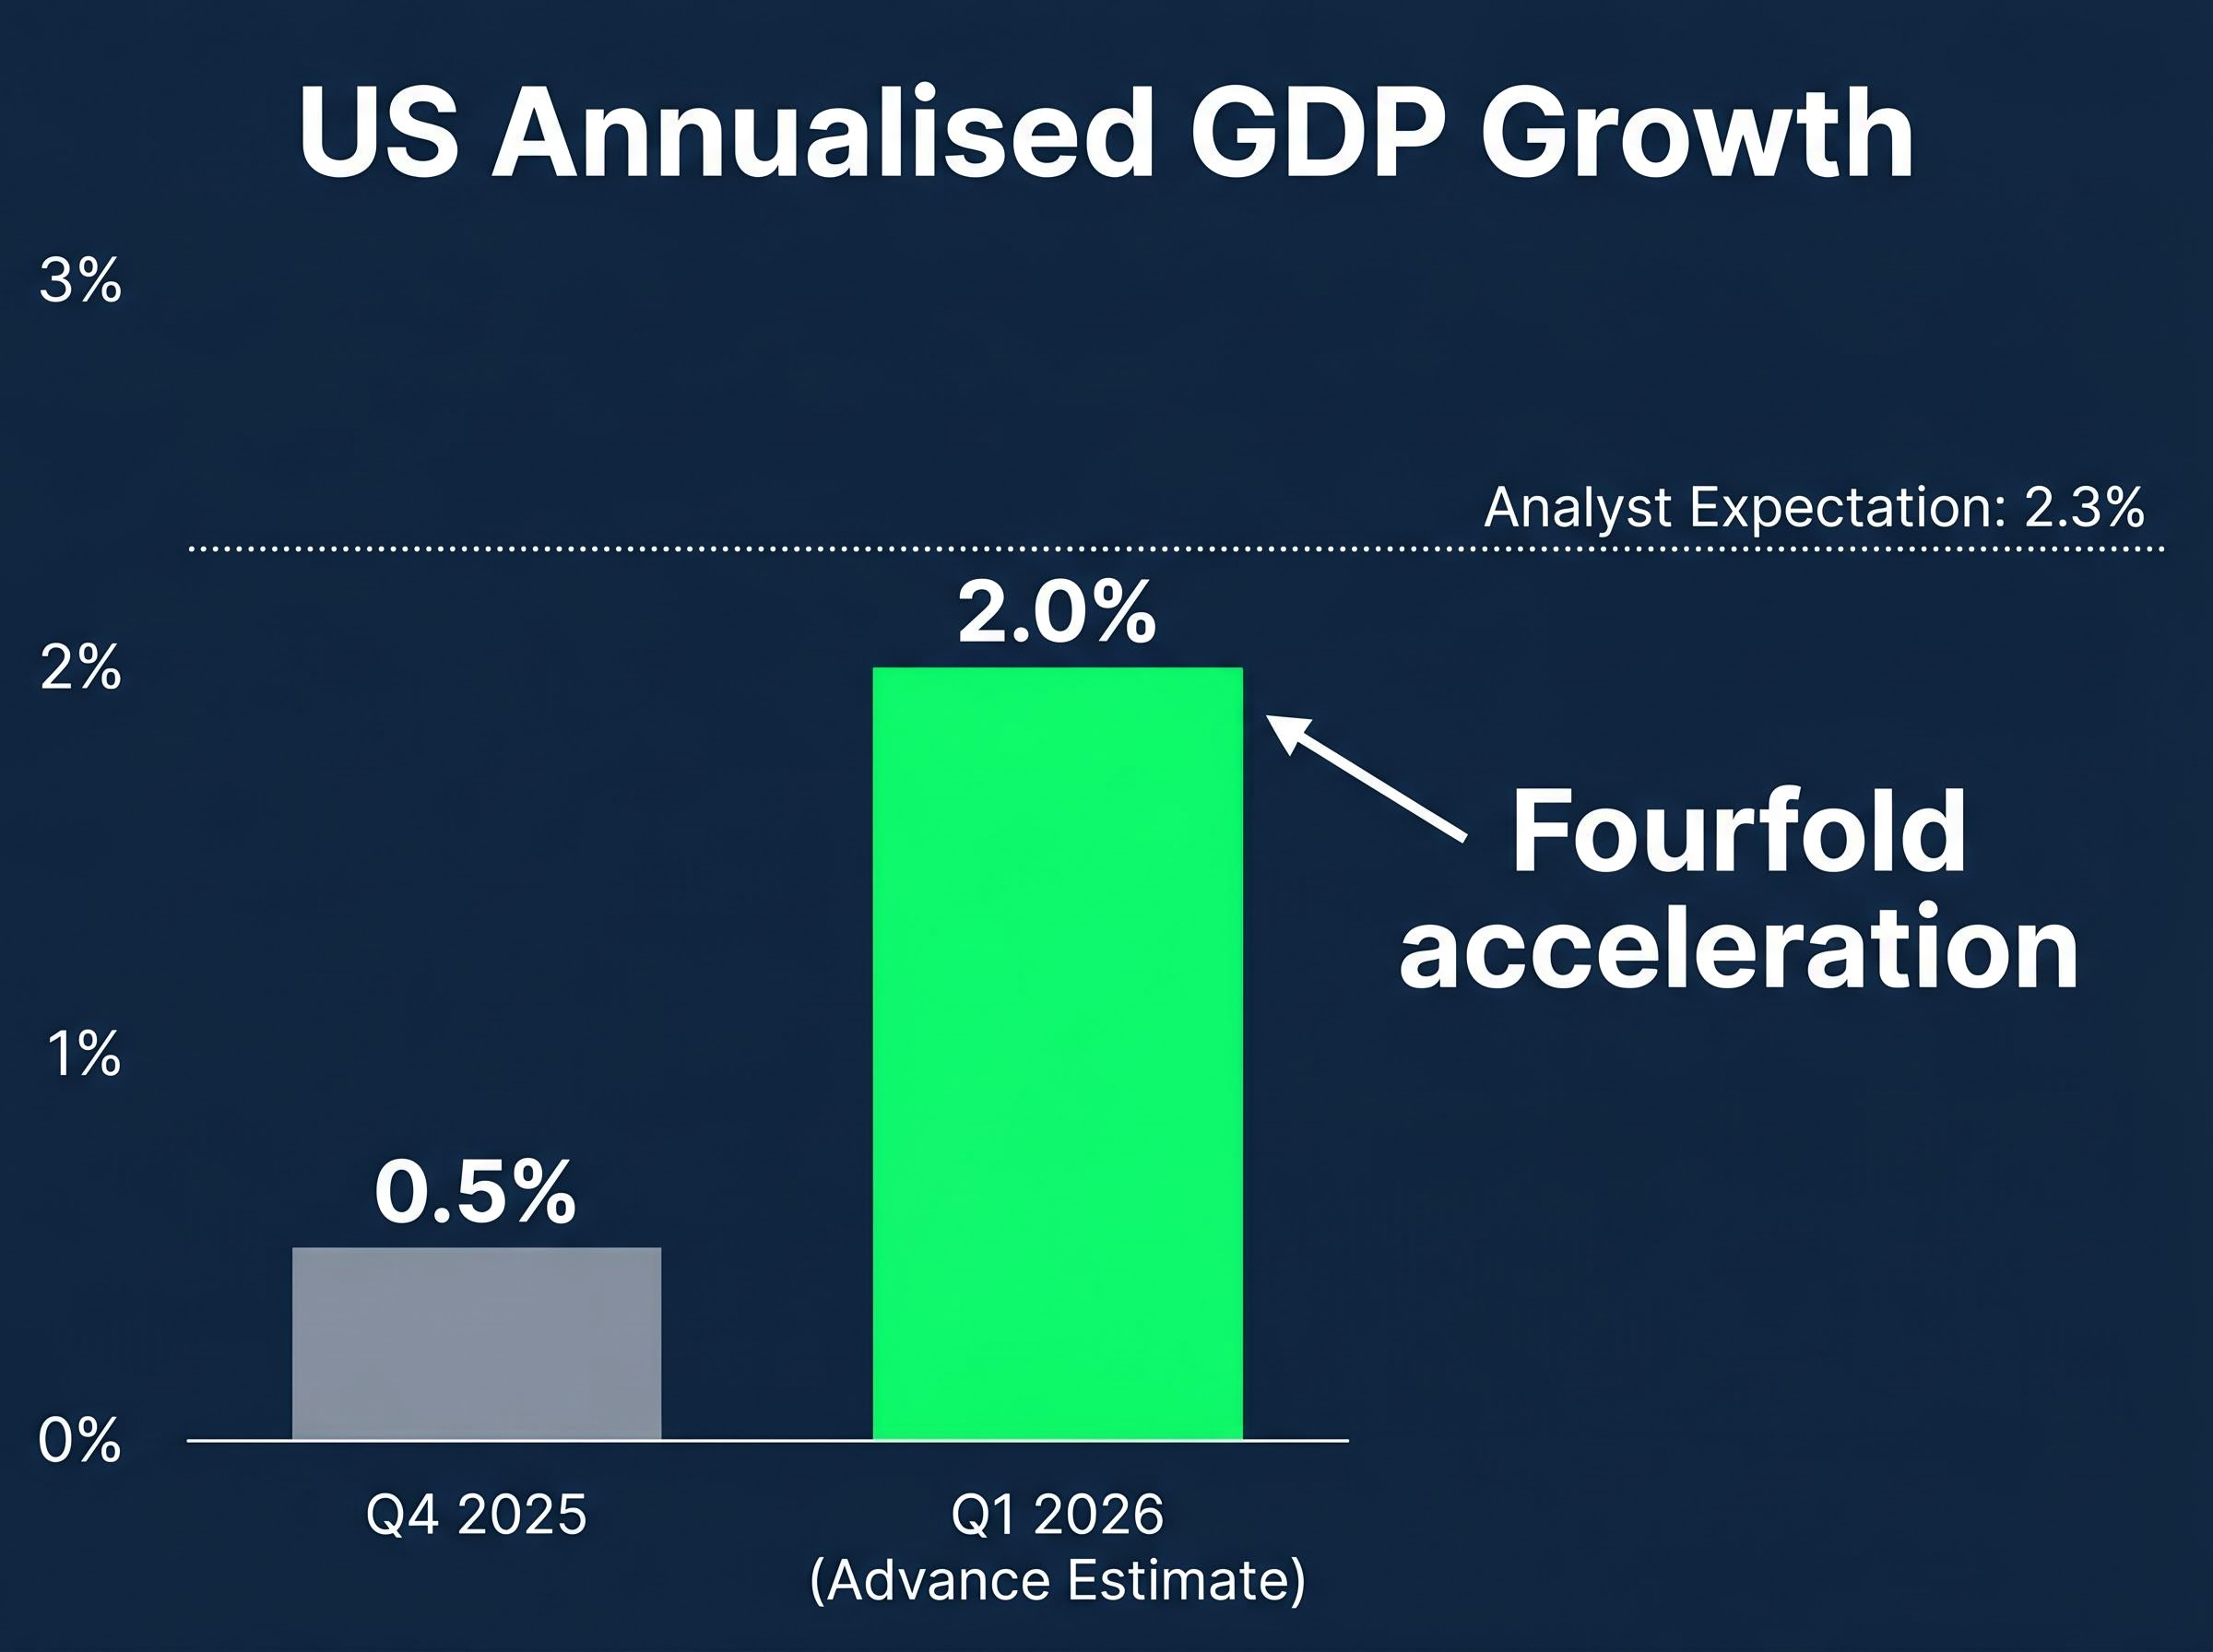
The Bureau of Economic Analysis released its advance estimate for Q1 2026 on 1 May 2026: annualised GDP growth of 2.0%, a fourfold acceleration from Q4 2025’s 0.5%. The figure came in slightly below some analyst expectations of 2.3%, but the miss needs context.
The BEA advance GDP estimate for Q1 2026 confirmed the 2.0% annualised growth figure, identifying business investment and consumer spending as the two primary contributors to the acceleration from Q4 2025’s near-stall rate.
Brief slowdowns are common within extended economic expansions, and a below-consensus quarter does not by itself signal recession. The rebound from near-stall speed to 2.0% shifts the probability distribution on recession risk meaningfully. Three components drove the improvement:
Fisher Investments has argued that pessimistic sentiment creates conditions where modest improvements in economic reality can produce upside surprises. The Q1 rebound fits that pattern precisely.
Equity markets are forward-looking and are broadly considered to have already incorporated Q1 data. The sentiment recalibration around the release, the shift from recession fear to expansion acknowledgement, may prove more meaningful than the number itself.
The eurozone reported Q1 2026 GDP growth of 0.1% quarter-on-quarter on 1 May 2026, missing consensus expectations of 0.2%. On its own, the miss looks like another chapter in the familiar European stagnation narrative. It may be the least informative data point in the week’s set.
Three signals deserve parallel consideration:
The initial GDP release also predates the most recent Hormuz-linked energy disruption, limiting its forward-looking relevance. Prevailing negative sentiment toward Europe creates conditions for positive surprises if actual outcomes modestly exceed depressed expectations. The yield curve and lending data are the specific signals worth watching.
Three fears had defined investor sentiment heading into May: that OPEC would weaponise oil supply, that the US economy was sliding toward recession, and that the eurozone remained structurally impaired. The week of 1 May 2026 tested each of those fears.
| Event | Fear it was meant to confirm | Actual outcome | Market implication |
|---|---|---|---|
| UAE exits OPEC | Cartel controls oil supply | OPEC’s share falls to ~26%; structural power erodes further | Cartel risk repriced lower |
| US Q1 GDP: 2.0% | Economy stalling toward recession | Fourfold acceleration from Q4 2025 | Recession probability reduced |
| Eurozone Q1 GDP: 0.1% | Europe structurally impaired | Modest miss; yield curve and lending data positive | Sentiment gap creates upside potential |
Global equities reached new record highs in early May 2026, with forward projections calling for approximately 11% returns over the next 12 months, driven by AI-sector momentum and fiscal expansion. Worldwide equities had declined roughly 9% in Q1 2026 following the outbreak of the Iran conflict; the full recovery through April represents the adaptive pattern that bull markets produce when fears are resolved incrementally.
Oil-driven inflation and Fed rate policy represent the binding constraint that the UAE exit and GDP rebound cannot resolve on their own: Goldman Sachs projected a 9.6 million barrel per day global supply deficit as of late April, and persistent inflation at that scale keeps the Federal Reserve’s hands tied on rate cuts well into 2027.
Structural adaptation to Hormuz disruption, including non-Gulf production increases and alternative route development, represents a longer-term resiliency story that extends well beyond the OPEC exit headline.
Unresolved risks remain. Hormuz disruption continues, the downstream effects of the UAE’s expanded production ambitions are unclear, and the eurozone remains dependent on energy cost normalisation. The UAE’s exit is structurally significant for OPEC’s long-term market power but does not represent an immediate supply shock given current shipping constraints.
The week of 1 May 2026 delivered more evidence for resilience than for the recessionary and supply-shock scenarios that had been priced into sentiment. Not every fear has been retired, but each of the three dominant concerns of the past month has been tested and found less solid than the market’s mood had suggested.
Investors wanting to stress-test the 11% forward return projection against current market structure data will find our full explainer on the BofA Sell Side Indicator useful: it covers the April 2026 reading of 55.6%, the dangerously narrow market breadth sitting beneath the headline figure, and what the 1.9 percentage point gap to the historic sell signal threshold means for positioning.
This article is for informational purposes only and should not be considered financial advice. Investors should conduct their own research and consult with financial professionals before making investment decisions. Forward-looking statements regarding production targets, GDP trajectories, and equity return projections are subject to change based on market developments and geopolitical conditions.
The UAE left OPEC effective 1 May 2026 due to long-running quota disputes, a strategic rift with Saudi Arabia, and its ambition to expand production to five million barrels per day by 2027, nearly two million barrels above its previously permitted OPEC output level.
Analysts suggest the UAE exit may not have immediate price effects because current Strait of Hormuz disruptions limit how quickly the UAE can bring expanded production to market; the impact is structural rather than immediate, further eroding OPEC's long-term market power.
Following the UAE's departure, OPEC's share of global crude output falls to approximately 26%, down from 30%, while the broader OPEC+ grouping including Russia holds roughly 43% of global production.
The Bureau of Economic Analysis reported annualised GDP growth of 2.0% for Q1 2026, a fourfold acceleration from Q4 2025's near-stall rate of 0.5%, driven by AI-led business investment and consumer spending, meaningfully shifting the probability distribution away from recession.
Despite the eurozone's Q1 2026 GDP coming in at 0.1% quarter-on-quarter against a 0.2% consensus expectation, investors should monitor the positively sloped yield curve and expanding lending growth, both of which are forward-looking indicators suggesting conditions may improve beyond what the backward-looking GDP print implies.