Goldman Sees Contrarian Buy Signal in KOSPI Foreign Selloff
9 hrs ago

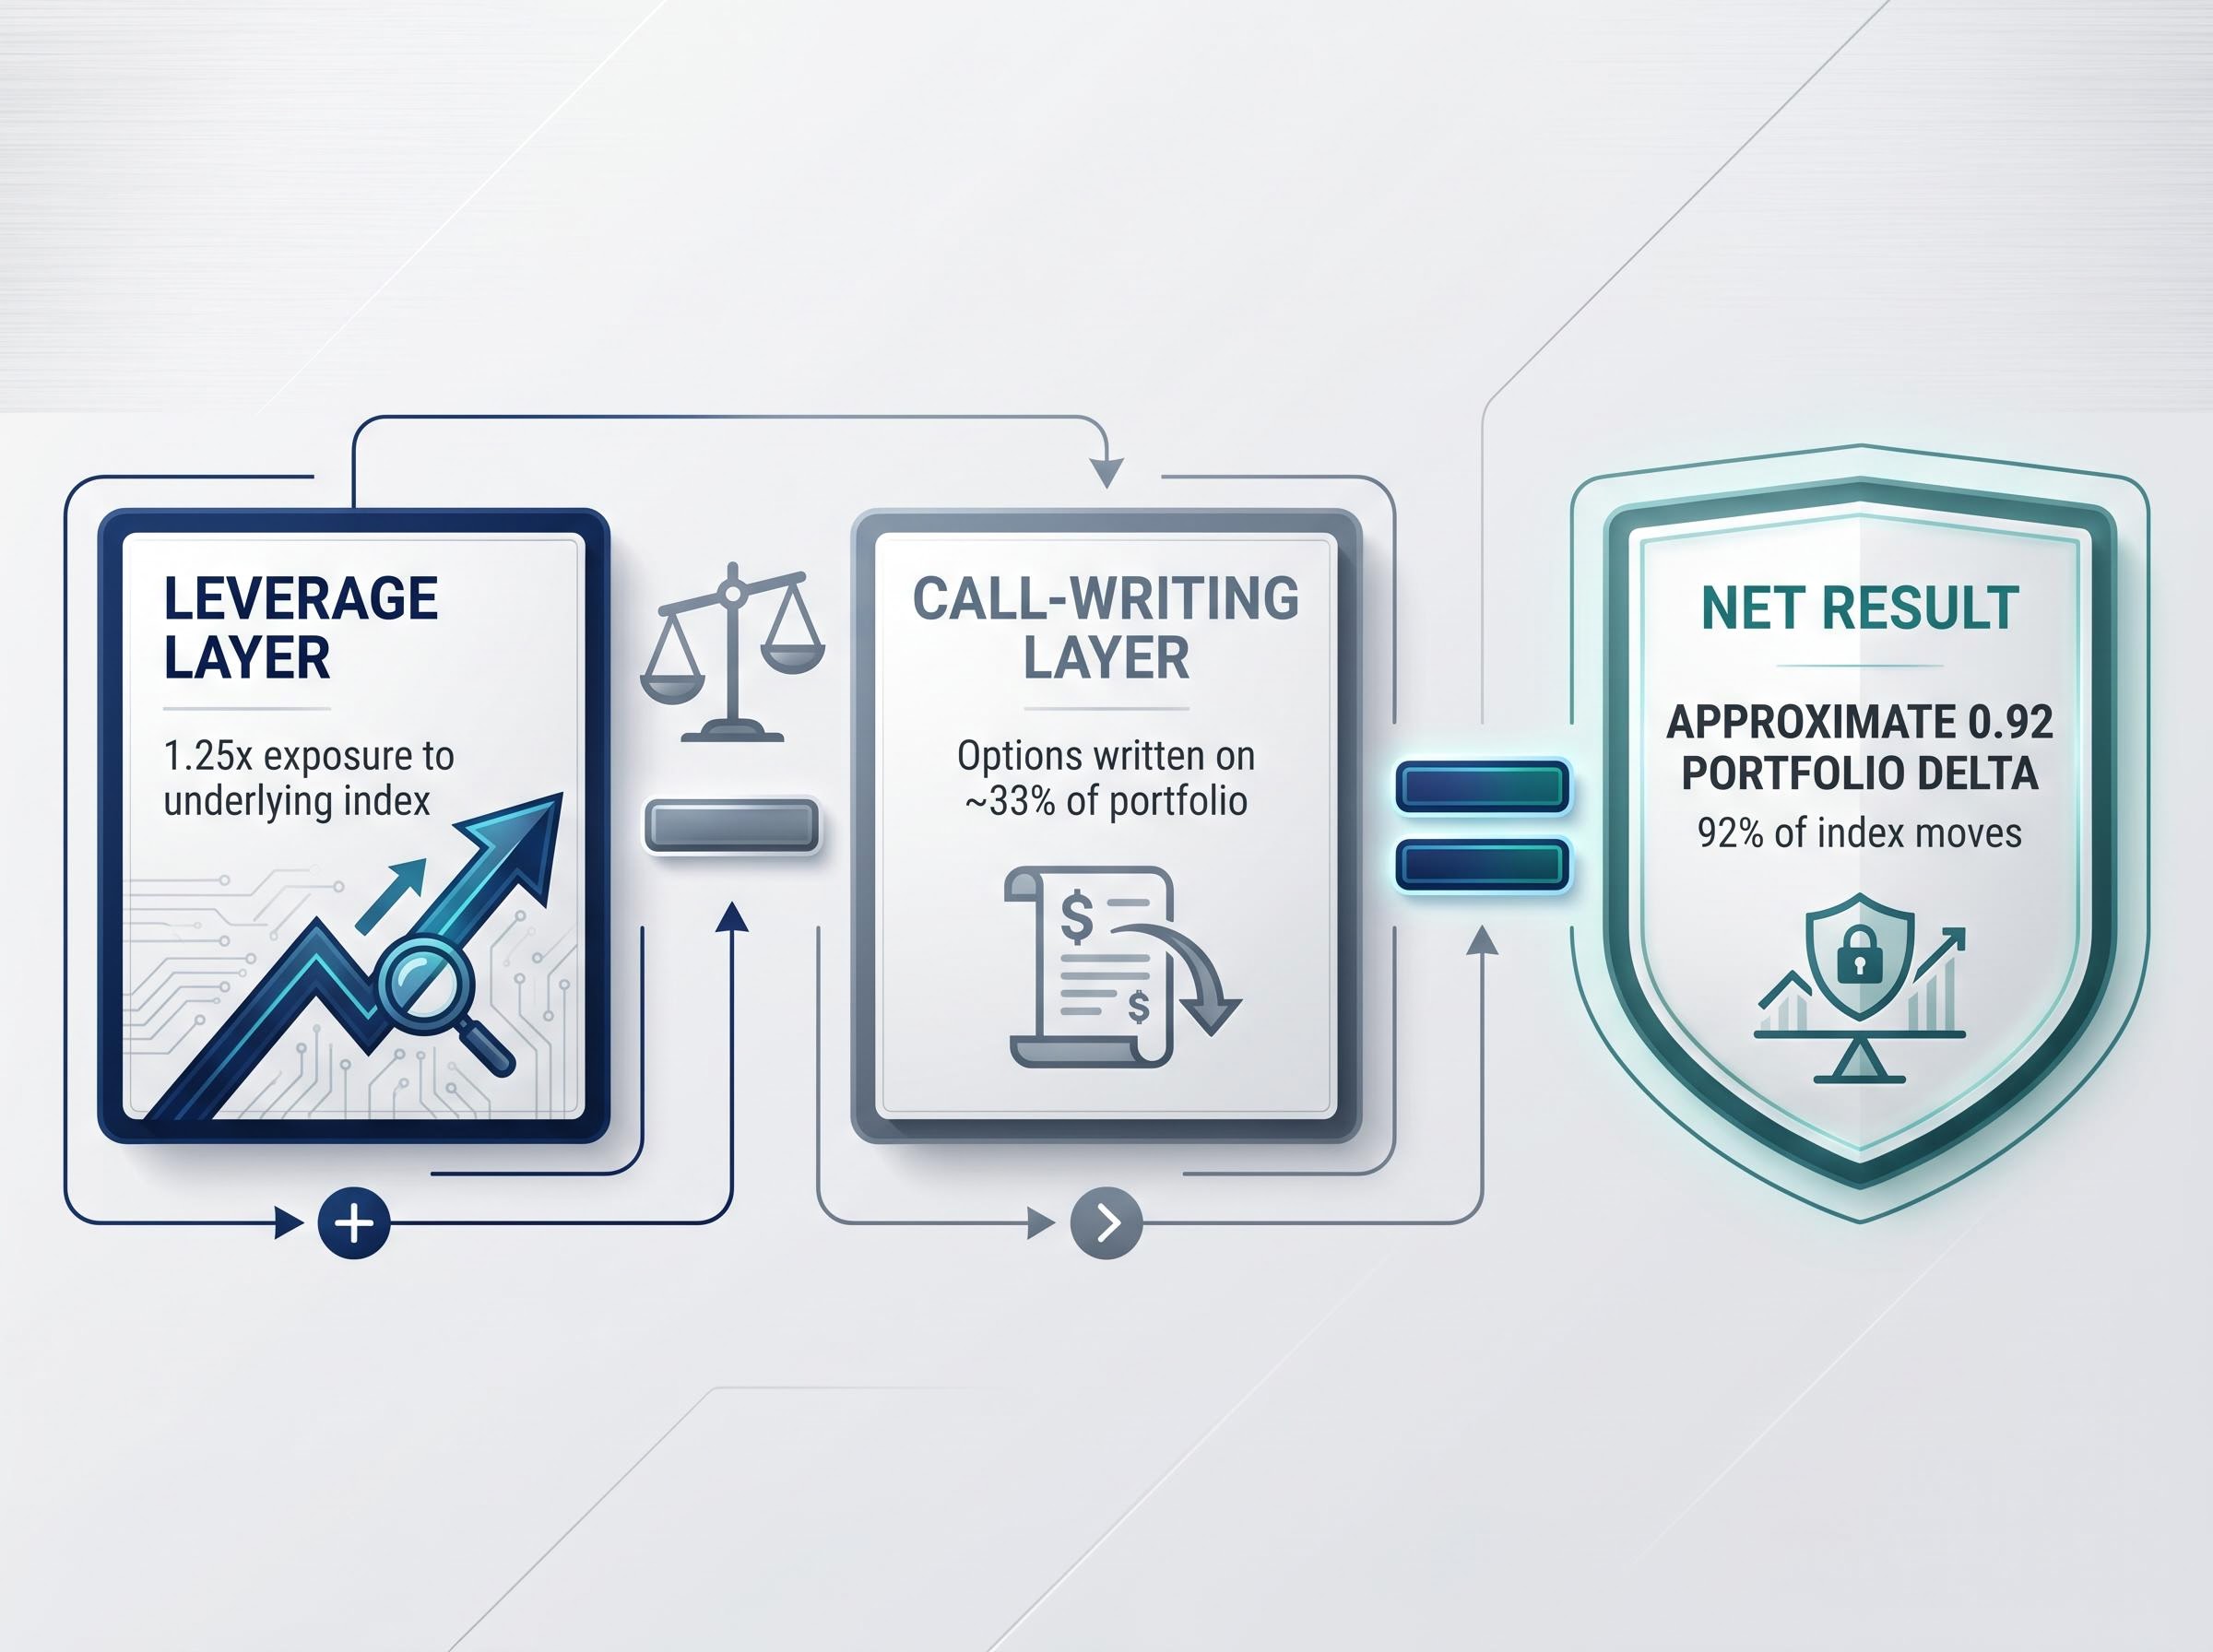
Two mechanisms that should, in theory, pull a portfolio in opposite directions are generating one of the more compelling income stories in global ETF markets. Leveraged covered call ETFs apply 25% leverage to amplify equity exposure, then write call options on roughly a third of the portfolio to collect premium income and partially offset the added risk. The net result, a portfolio delta of approximately 0.92, suggests participation in roughly 92% of underlying index moves while delivering yields that can exceed 13%. The category has attracted more than $3 billion in Canadian-listed assets under management alone, with a wave of global launches through 2025 and into 2026 confirming broad institutional and retail appetite. What follows is an evidence-based assessment of the risk-offset mechanics, 20 months of real total-return data across four paired ETF comparisons, and a suitability framework for investors evaluating whether the yield premium justifies the structural complexity.
The leverage component is where most investors hesitate, and reasonably so. A 25% increase in market exposure means a 25% amplification of both gains and losses. In isolation, that leverage would push a portfolio’s volatility well above its underlying index. USSL.TO and QQQL.TO, which carry leverage without a covered call overlay, demonstrate the effect: approximately 25% higher volatility than their unleveraged equivalents.
Leverage amplification mechanics operate on the same mathematical principle across product structures: a given percentage move in the underlying produces a proportionally larger gain or loss on the deployed capital, with the multiplier determined by the notional exposure relative to the equity committed. The 1.25x structure used in these ETFs is qualitatively different from the 5x to 20x leverage commonly applied in CFD trading, but the directional amplification logic is identical.
The covered call layer operates as the structural counterweight. Three components interact to produce the final exposure:
The combined structure produces a portfolio delta of approximately 0.92, meaning participation in roughly 92% of underlying index moves.
The 25% leverage level was not selected as an arbitrary round number. It represents the approximate balance point where the income-generating call overlay and the return-amplifying leverage offset each other in risk terms. This distinction matters: daily-reset 2x and 3x leveraged products are designed for short-term trading and carry compounding decay risks that are structurally absent from these 1.25x products. The two categories share a label but operate on fundamentally different mechanics.
The income generated by writing call options is genuine. In sideways or mildly declining markets, the premium collected adds to total return and modestly dampens volatility. That much is structural and reliable.
What covered calls do not provide is meaningful downside protection. This is the most common misreading of the product category, identified explicitly by both ProShares (2025) and Seeking Alpha (February 2026) as a persistent misconception among retail investors. In a sharp drawdown, losses will exceed the premium collected, and the presence of leverage amplifies that shortfall.
The CSA consultation on leveraged ETF disclosure, published by the Ontario Securities Commission in October 2025, recommended mandatory point-of-sale risk warnings for leveraged and inverse ETFs, citing documented evidence that retail investors routinely underestimate the compounding and volatility characteristics of these products.
ProShares and Cboe S&P 500 BuyWrite Index data show that traditional monthly covered call strategies captured approximately 65% of S&P 500 upside but 84% of downside over a 10-year period.
The asymmetry is the price of the income. USCL.TO’s 13.45% yield reflects premium income, not a risk reduction mechanism. Investors who size these ETFs as a defensive allocation and then experience leveraged drawdown losses have misidentified the tool. The premium is compensation for capped upside, not insurance against the downside.
The first meaningful observation window for these products spans approximately June 2024 through late February 2026, covering roughly 20 months of live trading that included periods of meaningful volatility. Two paired comparisons structure the findings:
| ETF Ticker | Underlying Index | Leverage | Income Yield | Approx. 1-Year Return |
|---|---|---|---|---|
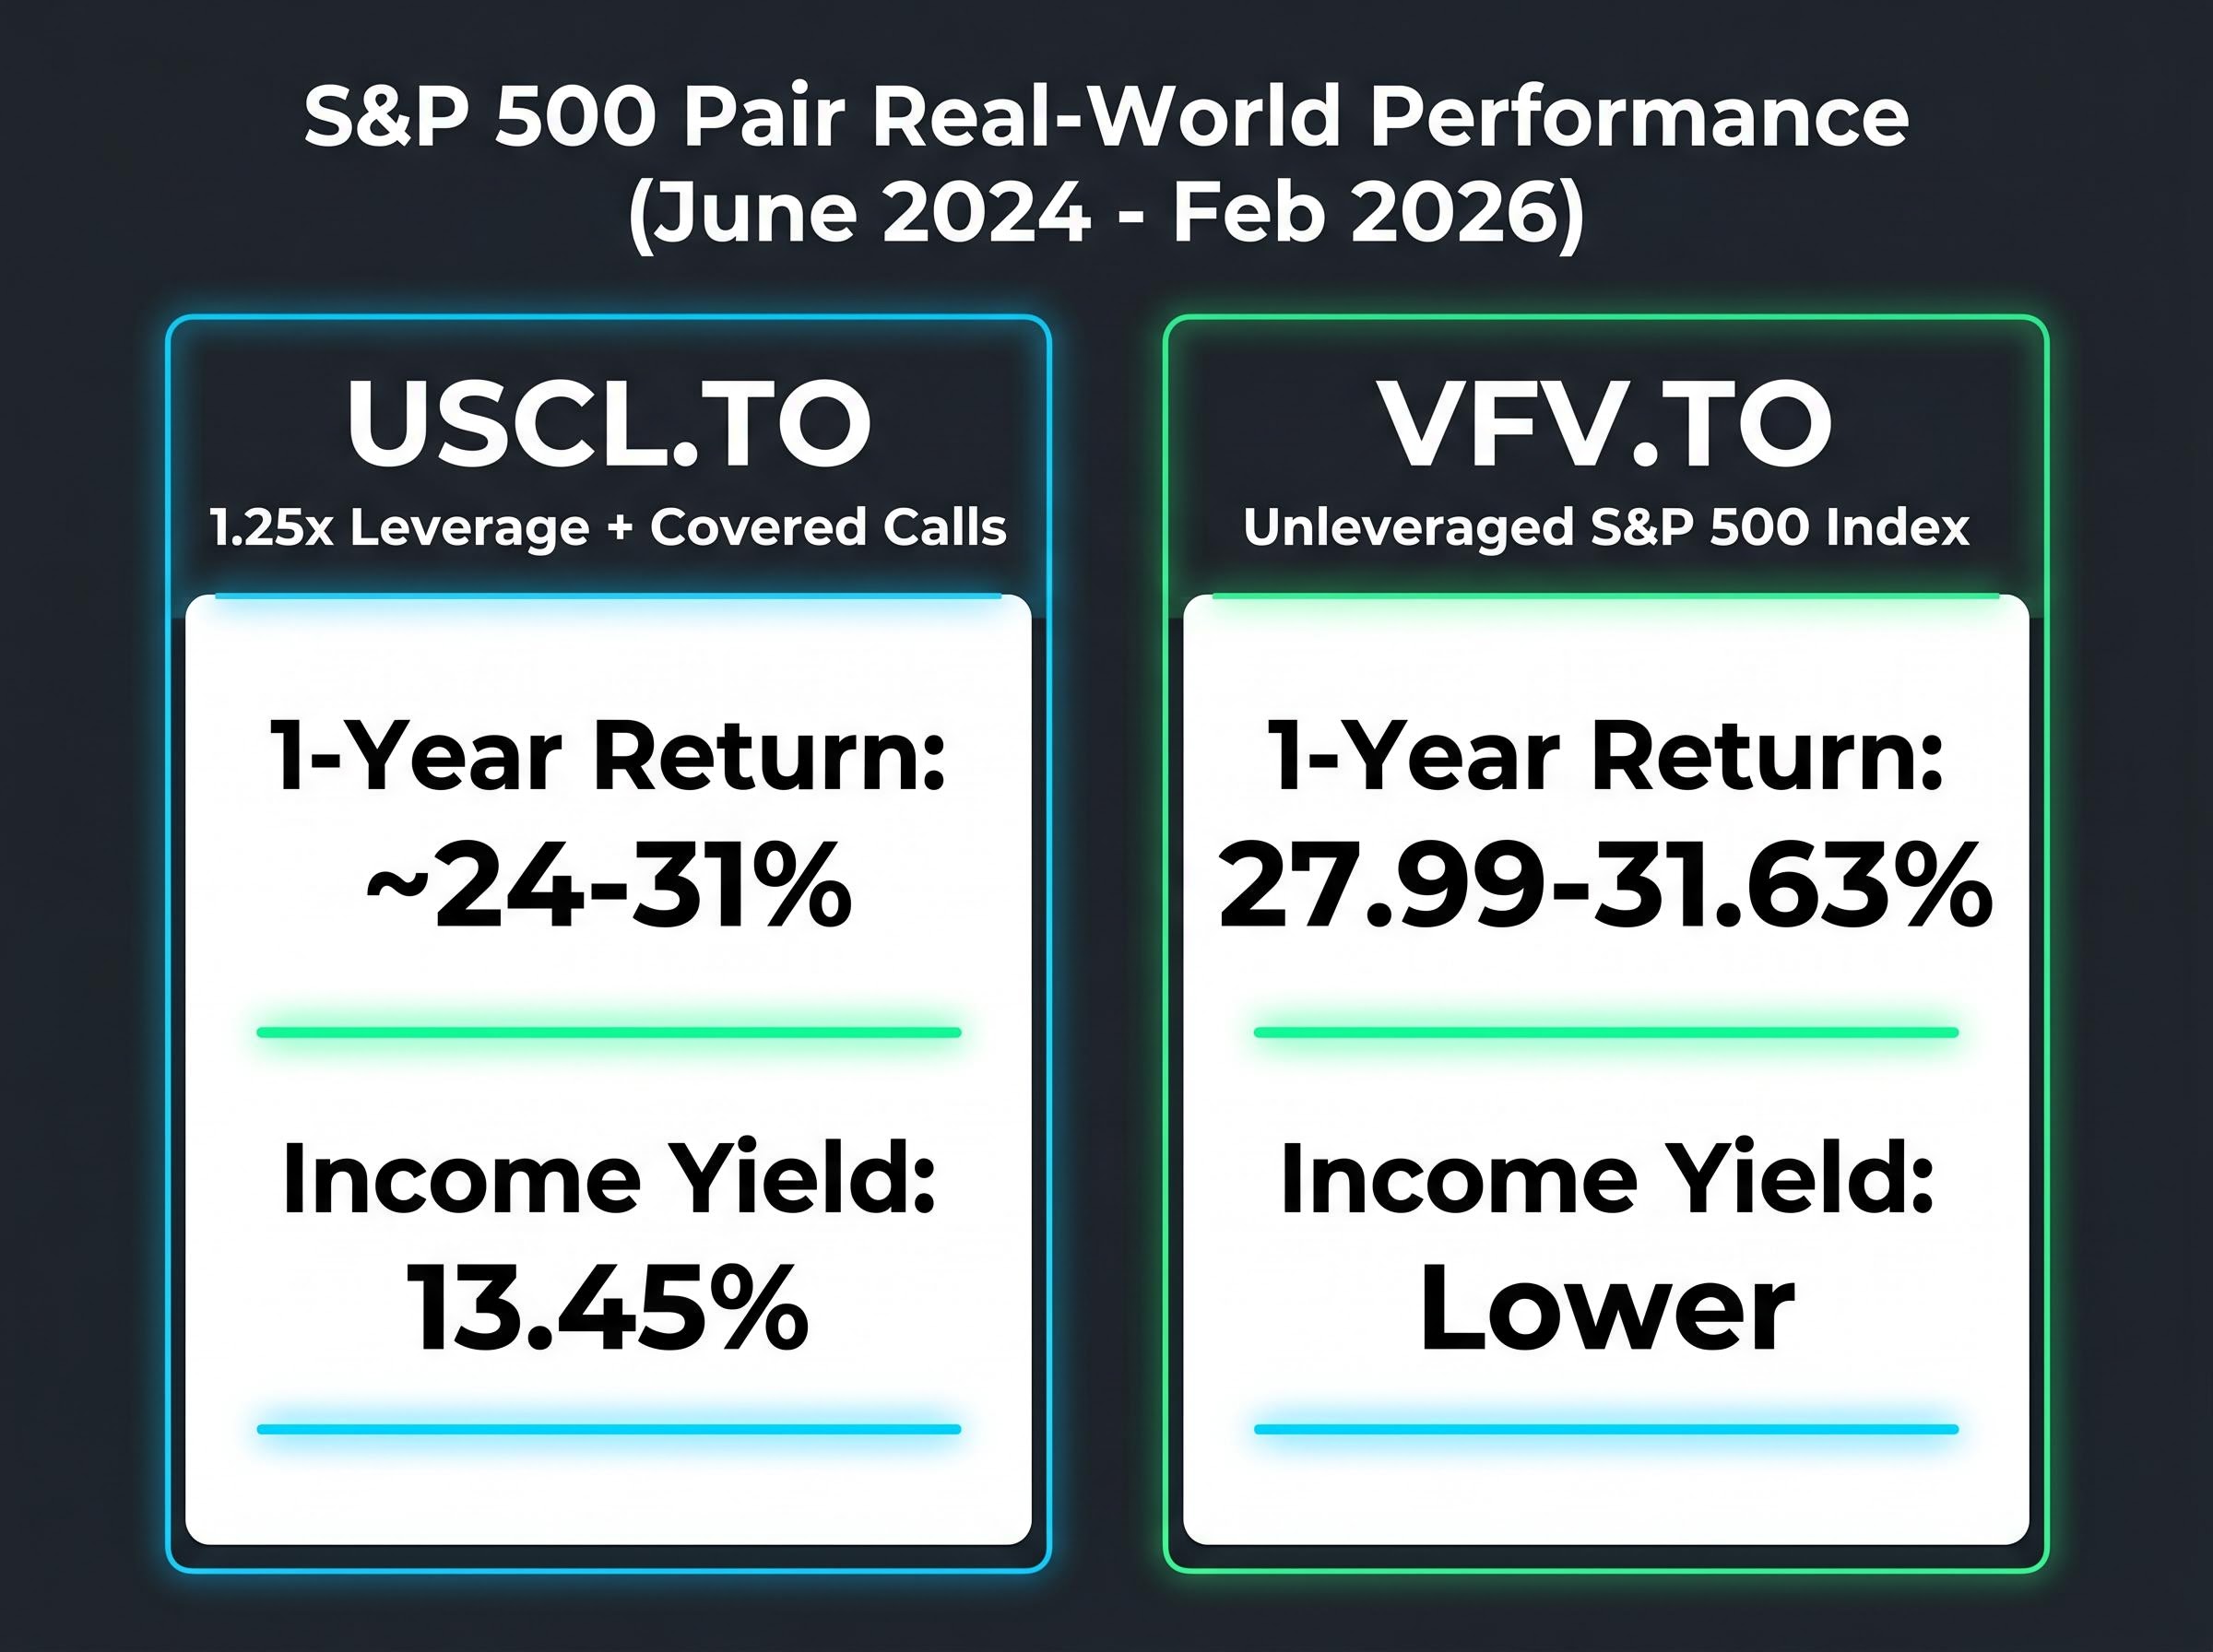
| USCL.TO | S&P 500 | 1.25x + covered calls | 13.45% | ~24-31% |
| VFV.TO | S&P 500 | None | Lower | 27.99-31.63% |
| QQCL.TO | Nasdaq 100 | 1.25x + covered calls | Enhanced | 18.61% |
| QQQL.TO | Nasdaq 100 | 1.25x (no calls) | Minimal | Higher than unleveraged |
A caveat applies to the Nasdaq 100 result: the outperformance partly reflects Nasdaq underperformance relative to its long-term trend during this specific window rather than a structural edge inherent to leverage. Over a longer return history, QQQL.TO (leveraged without the call cap) may emerge as the higher total-return product. Twenty months is not a full market cycle, but it provides observed data rather than backtested projections, a meaningful upgrade for evaluating whether the structural thesis holds in practice.
Income ETF comparisons across the ASX universe confirm that total return and distribution yield can diverge dramatically within a single 12-month window: one product in the 2026 comparison set returned 26.7% while another lost 4.0%, a gap driven entirely by index methodology rather than market timing. That spread illustrates why evaluating the leveraged covered call category purely on yield headlines, without examining total return data across different market environments, produces systematically misleading suitability conclusions.
The one external variable investors cannot control, and the one that most directly determines whether the structural thesis delivers in practice, is the interest rate environment. If the cost of borrowing exceeds the incremental return generated by leverage, the structure destroys value rather than creating it.
Current rate data points frame the calculus:
The Bank of Canada policy rate decision published on 29 April 2026 confirmed the rate hold at 2.25%, citing persistent uncertainty in the global trade environment as a key factor shaping the monetary policy outlook through the remainder of 2026.
The spread between borrowing costs and expected equity returns remains positive at current levels. Analysis from Defiance ETFs (March 2025) noted that elevated rates amplify leverage cost erosion more aggressively than many investors anticipate. The current environment at 2.25% in Canada is more favourable than the peak-rate conditions of 2022-2024, but it is not the near-zero rate environment in which many of these products were originally structured and marketed.
Canadian-listed ETFs such as USCL.TO and QQCL.TO borrow directly to achieve their 1.25x exposure, making their leverage costs directly sensitive to Bank of Canada rate decisions. US-listed products achieve equivalent exposure through options and swaps, embedding rate sensitivity indirectly into derivatives pricing rather than through a transparent borrowing line. The distinction affects how sharply leverage costs respond to central bank moves; Canadian products repricing more quickly and visibly when rates shift.
The investor profile where this structure genuinely delivers on its promise is specific. An income-focused investor with a long holding horizon, no near-term need to liquidate, the temperament to tolerate short-term drawdowns without a behavioural response, and a rate environment that keeps borrowing costs well below expected equity returns. For that investor, USCL.TO’s 13.45% yield, distributed on a weekly, biweekly, or monthly schedule depending on the product, represents a meaningful income stream that plain index ETFs cannot replicate.
The structure breaks down under three conditions:
| Investor Profile / Condition | Suitability Assessment |
|---|---|
| Income-focused, long-horizon investor | Strong fit; high yield with near-index risk profile suits long-term income reinvestment |
| Total-return-focused investor | Weak fit; capped upside compounds negatively over full market cycles versus plain index ETFs |
| High-rate environment | Reduced appeal; borrowing costs erode the leverage benefit and compress net yield advantage |
| Sustained market decline | Elevated risk; leverage amplifies losses beyond what option premium income can offset |
| Sideways or range-bound market | Strongest fit; call premiums generate income without the upside cap being triggered frequently |
Community commentary on Reddit’s r/CoveredCalls (2026) reinforces the amplified volatility concern when covered calls are layered with leveraged positions. ProShares data indicates its daily call strategy targeted a 9.9% annualised yield as of 31 December 2025, providing a benchmark against which the 13.45% yield from USCL.TO can be measured, though the two strategies carry different risk profiles.
Three analytical threads converge on a calibrated conclusion. The risk-offset mechanics hold structurally: leverage and call writing produce a portfolio delta that approximates plain index exposure. The 20-month performance data supports the thesis empirically, with USCL.TO and QQCL.TO each producing total returns broadly comparable to or exceeding their non-leveraged equivalents while delivering substantially higher income yields. The suitability case, however, is specific rather than universal.
The leveraged covered call ETF category exceeded $3 billion in Canadian-listed AUM as of 31 October 2024, with continued growth indicated by QQCL.TO’s approximately $301 million AUM and the volume of new product launches through 2025 and 2026.
For investors with genuinely long horizons of 5, 10, or 15-plus years who reinvest distributions and do not need to sell holdings to meet income needs, the embedded leverage is unlikely to be a source of meaningful practical disruption. The compounding effect of reinvested 13%-plus distributions over decades represents a different return path than plain index appreciation, one that may prove superior or inferior depending on market conditions over the holding period.
The distinction between yield and total return is the single most consequential framing error income investors make, and covered call strategies sit at the centre of the debate; the yield vs total return analysis across ASX income ETFs shows that covered call products such as YMAX consistently surrender the upside participation that drives most long-run equity compounding. A 13% income yield distributed weekly is not equivalent to 13% total return growth, and the gap compounds materially over multi-year holding periods.
Two conditions warrant ongoing monitoring. The rate environment directly affects leverage cost drag; a return to peak-rate conditions would compress the advantage materially. Sustained bear market periods, where leverage amplification is not offset by premium income, represent the structural stress scenario.
The institutional conviction behind the category continues to build. State Street Global Advisors launched 11 sector-specific covered call ETFs in early 2026. Global X has continued expanding its product suite. NEOS and Tap Alpha have both entered the space with differentiated structures. The pattern suggests the leveraged covered call structure is maturing from a niche income product into a recognised category with institutional backing.
The risk-offset thesis is mechanically sound, and 20 months of observed data provide empirical support. The appropriate investor profile, however, is specific: income-focused, long-horizon, tolerant of short-term drawdowns, and situated in a rate environment where borrowing costs remain well below expected equity returns.
Two considerations apply before taking a position. First, assess whether income generation or total return maximisation is the genuine priority; these products are engineered for the former and structurally constrained on the latter. Second, evaluate the current rate environment against the expected holding period. At 2.25% in Canada and 3.50-3.75% in the US, the spread remains positive but is not wide enough to absorb a significant rate increase without compressing the advantage.
The institutional expansion from State Street, Global X, NEOS, and Tap Alpha suggests a maturing category. The data warrants attention and careful position sizing, not reflexive dismissal or uncritical enthusiasm.
For investors wanting to stress-test the leveraged covered call thesis against a range of rate scenarios, our full explainer on building inflation-resilient ETF portfolios examines how negative real rates, RBA rate decisions, and bond yield movements reshape the risk-return calculus across ETF categories, including quality-factor and fixed income allocations that may complement or substitute for a leveraged income position depending on the rate environment.
This article is for informational purposes only and should not be considered financial advice. Investors should conduct their own research and consult with financial professionals before making investment decisions. Past performance does not guarantee future results. Financial projections are subject to market conditions and various risk factors.
Leveraged covered call ETFs apply 25% leverage to amplify equity exposure and then write call options on roughly a third of the portfolio to generate premium income. The two mechanisms roughly offset each other in risk terms, producing a portfolio delta of approximately 0.92, meaning the fund participates in about 92% of underlying index moves.
No, covered calls do not provide meaningful downside protection. In a sharp market decline, losses will exceed the premium income collected, and the presence of 1.25x leverage amplifies that shortfall beyond what the option premium can offset.
Over approximately 20 months from June 2024 through February 2026, USCL.TO delivered one-year total returns of approximately 24-31%, broadly comparable to VFV.TO's 27.99-31.63%, while generating a significantly higher income yield of 13.45% versus VFV.TO's lower distributions.
Rising interest rates increase the borrowing costs that fund the 1.25x leverage, compressing the net yield advantage. Canadian-listed products such as USCL.TO are directly sensitive to Bank of Canada rate decisions, with the current rate held at 2.25% as of April 2026 representing a more favourable environment than the peak-rate conditions of 2022-2024.
These ETFs are best suited to income-focused investors with long holding horizons of five years or more, who can tolerate short-term drawdowns without selling, and who prioritise high yield over maximum total return. They are a weaker fit for total-return-focused investors, as capped upside compounds negatively over full market cycles compared to plain index ETFs.