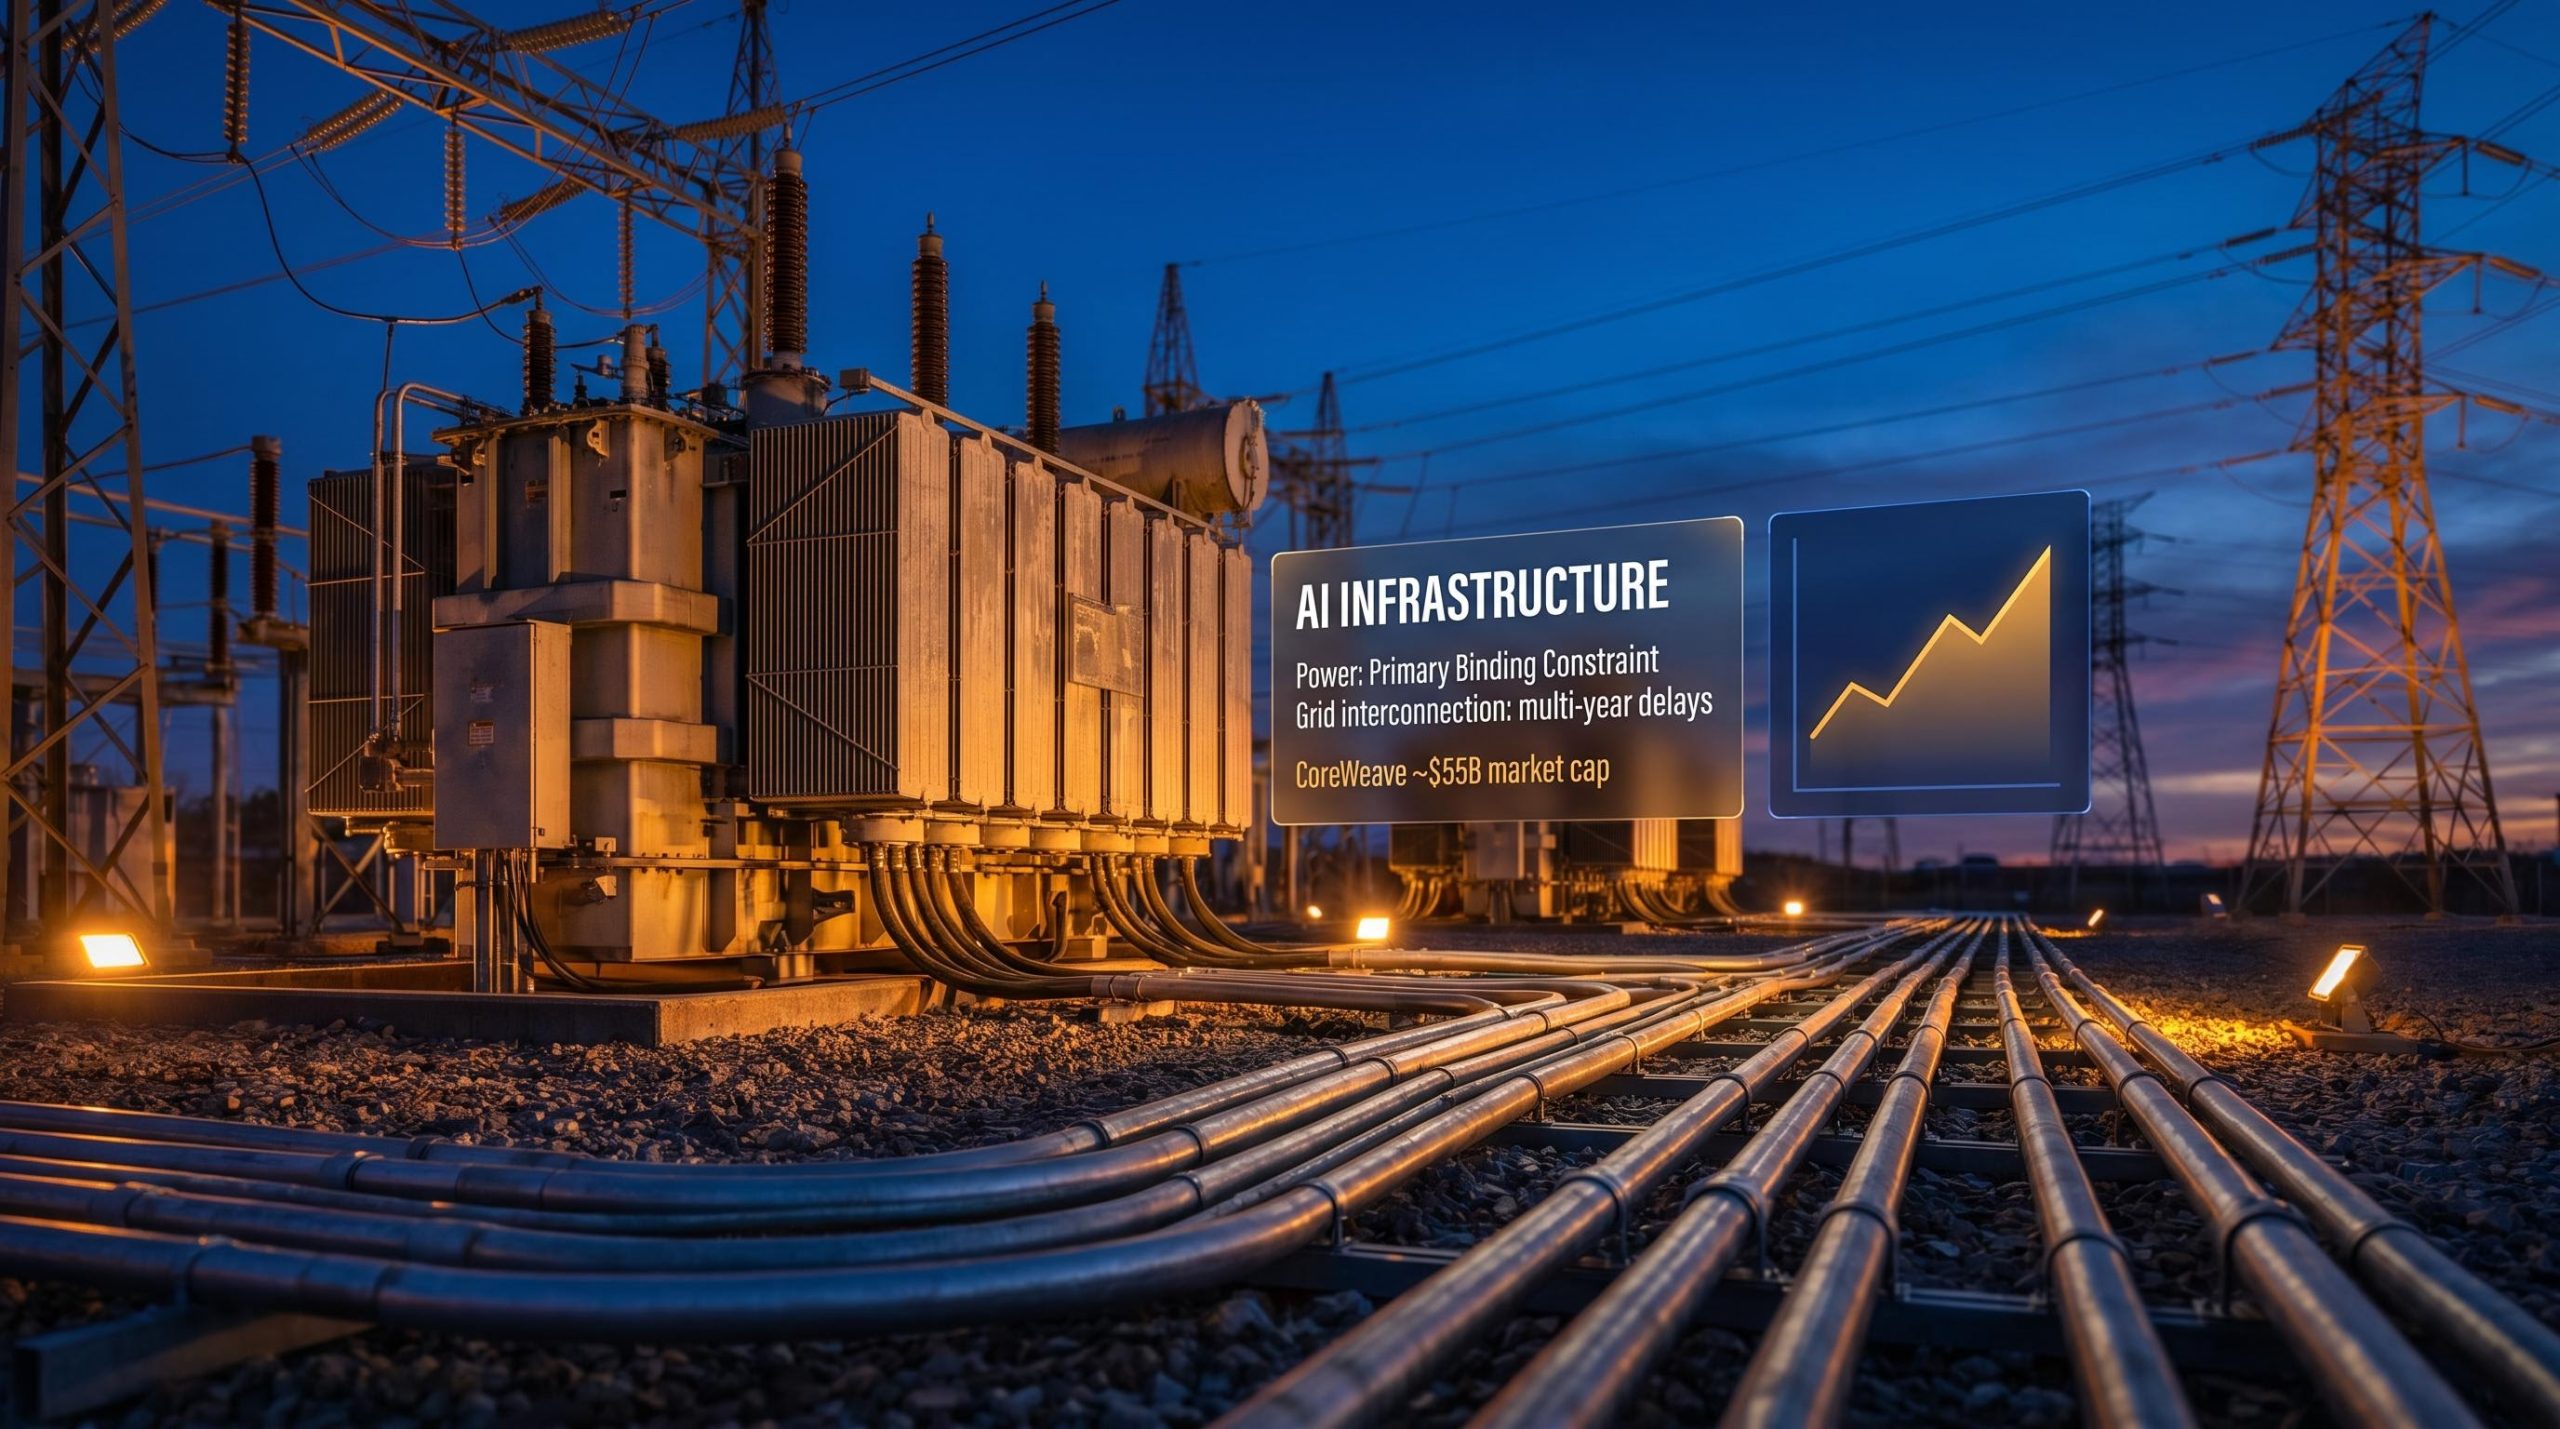
Why AI Infrastructure, Not Chips, Is Where Durable Value Sits
33 mins ago
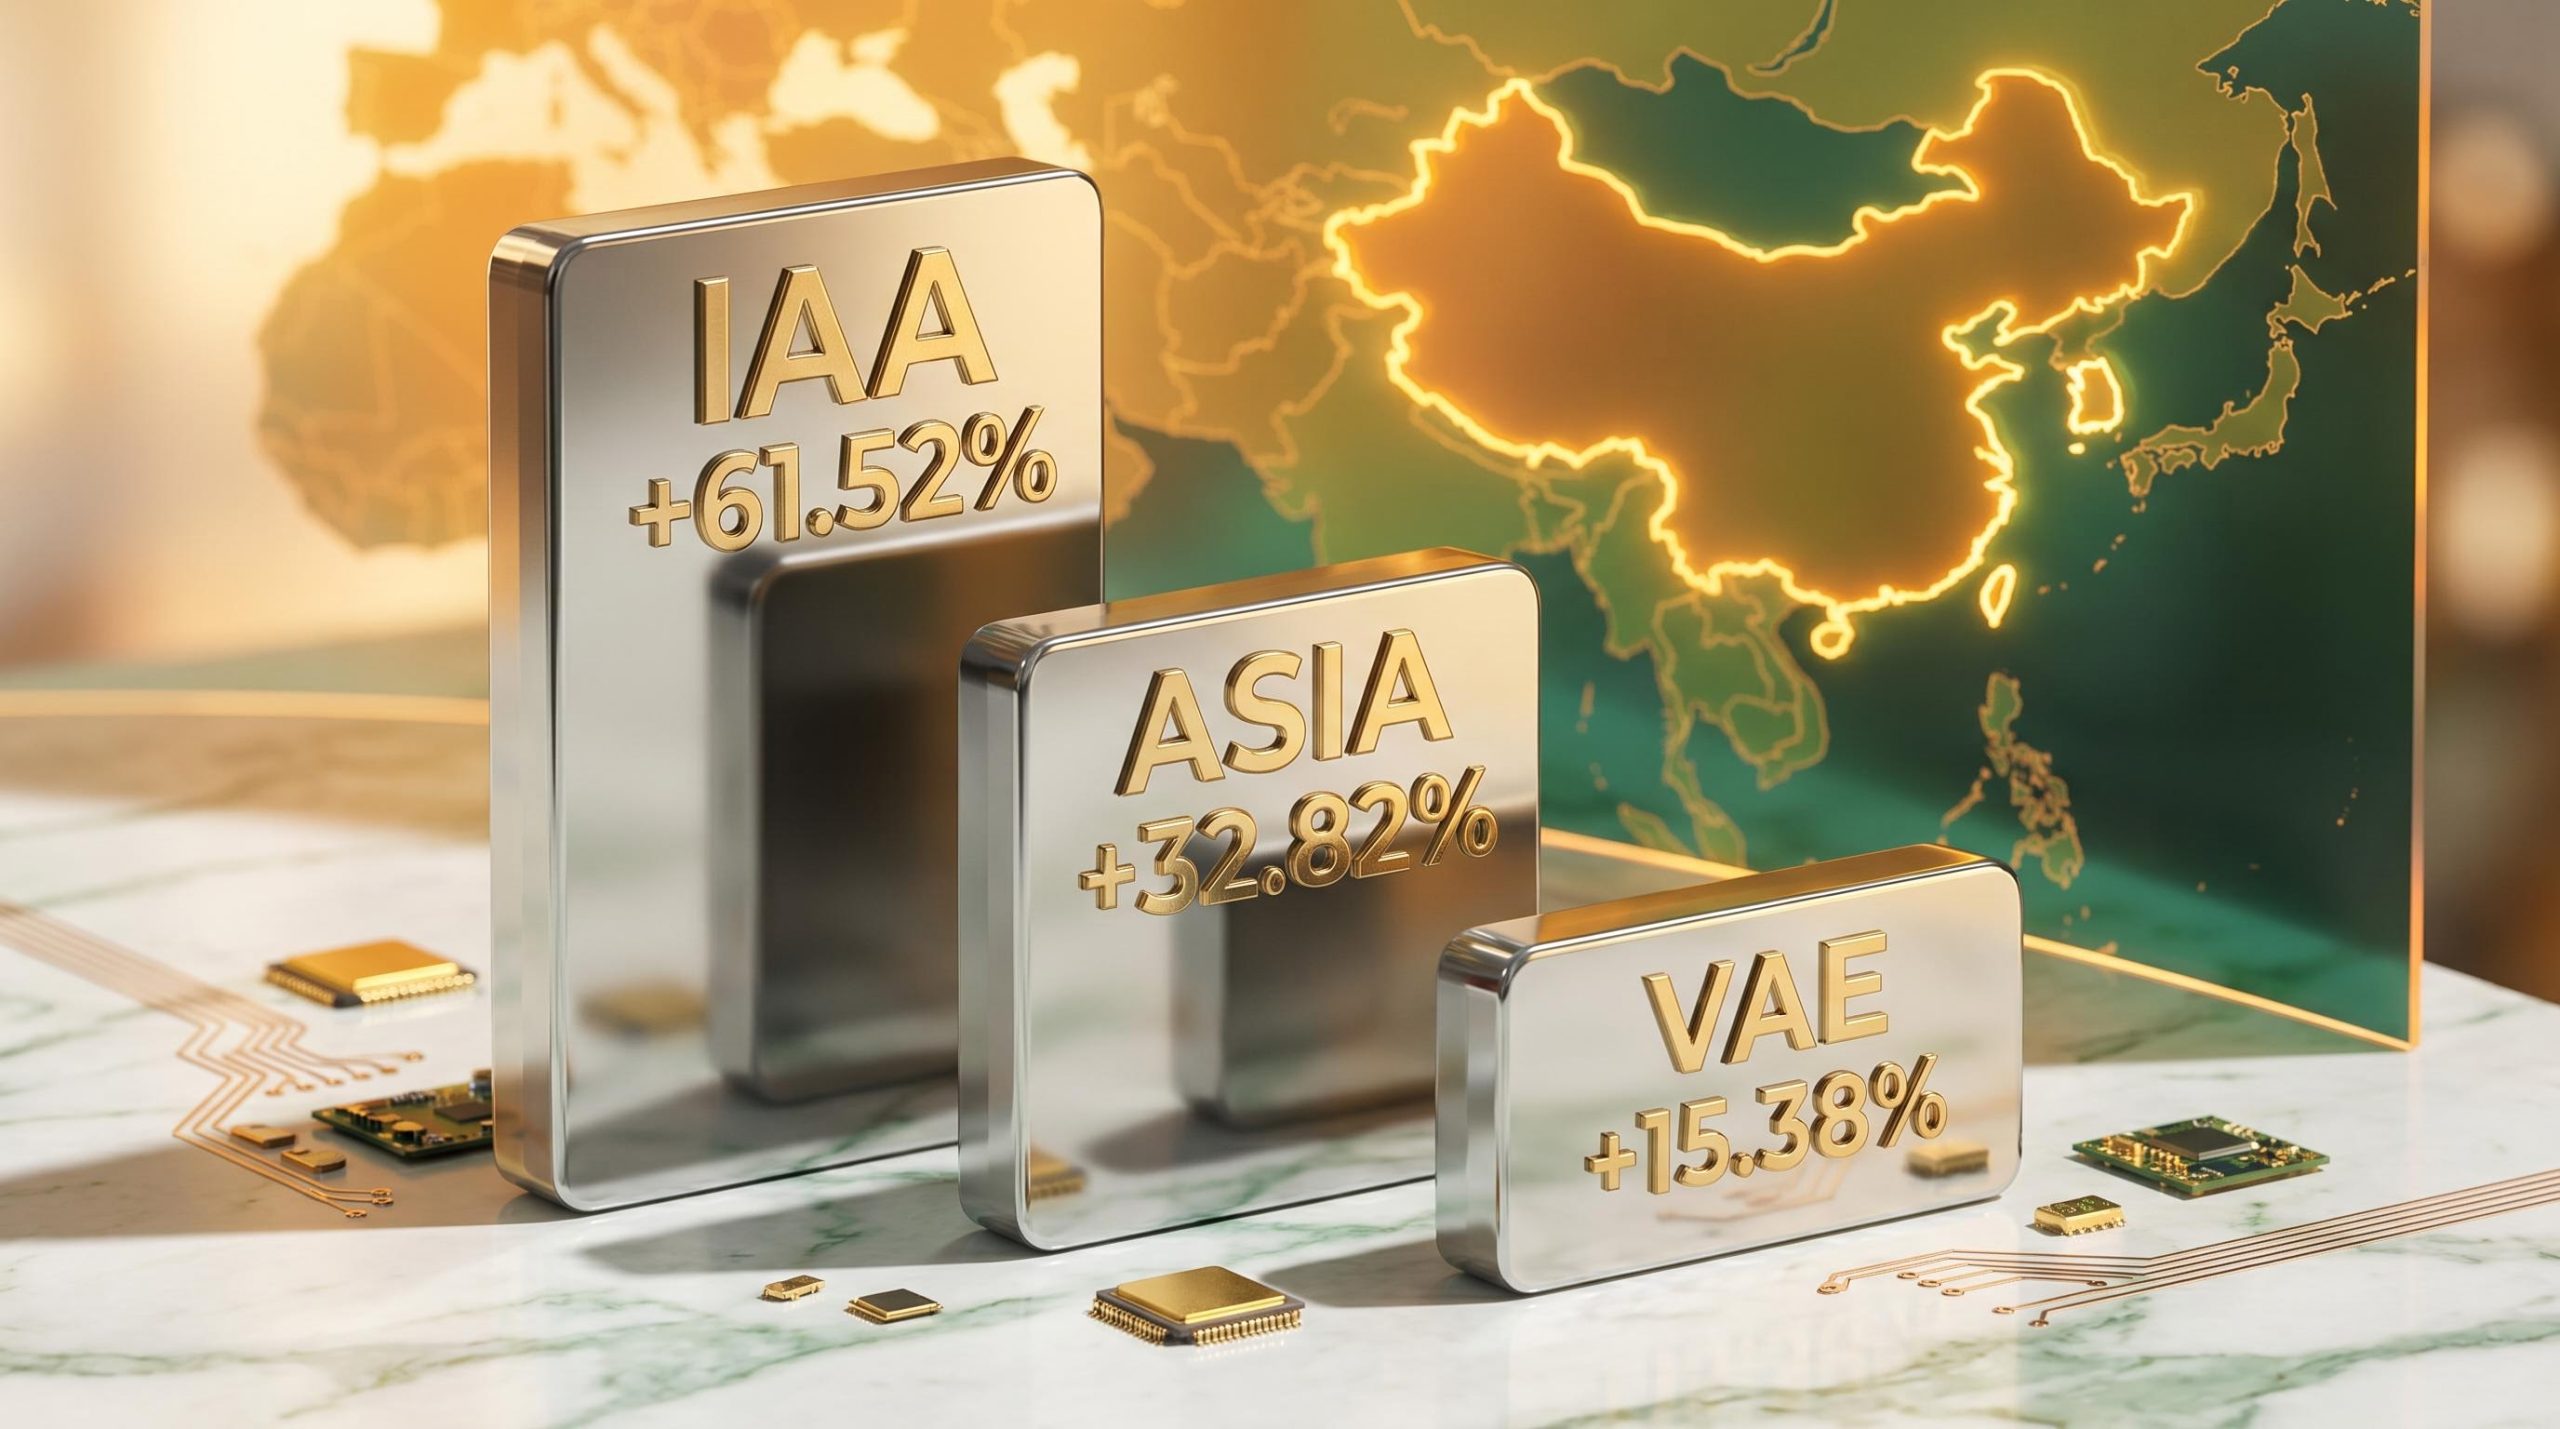
Three ASX-listed ETFs offer Australian investors exposure to Asian equities, yet the gap between their recent returns tells a story that goes well beyond geography. IAA returned 61.52% over the past year, ASIA returned 32.82%, and VAE returned 15.38%, a 46-percentage-point spread that reflects three fundamentally different bets on the region. For investors drawn to Asia as a structural diversifier away from US equity concentration, the question is not which fund topped the charts last year but which one aligns with their own risk tolerance, time horizon, and portfolio objectives. This analysis compares the construction, fees, holdings, and performance of these three ASX Asia ETFs, then maps each to a specific investor profile.
The Australian ETF market reached record total assets in 2025, according to Morningstar Australia, and a meaningful share of new capital flowed toward Asia-focused vehicles. Three forces drove that allocation shift:
International equity ETF flows reached $17.3 billion in 2025, surpassing domestic Australian equity ETFs for the first time, a shift that directly reflects the US concentration risk concern driving investors toward Asian regional allocations.
The White House fact sheet on the US-China trade deal confirms that tariff reductions were exchanged for China’s commitment to halting fentanyl precursor exports and resuming US soybean purchases, the specific concessions that reduced the geopolitical discount applied to Chinese and broader Asian equities heading into late 2025.
China’s exports to the Global South surged 39-fold from 2000 to 2024, signalling a structural trade reorientation that reduces Beijing’s dependence on US markets and creates new growth channels for Asian corporates.
The performance divergence across VAE, IAA, and ASIA is not random noise. It is a direct consequence of how differently each fund is constructed, and of which of these macro tailwinds each portfolio was positioned to capture.
All three funds carry the label “Asia ETF” on the ASX, but their underlying indices define very different investment universes.
VAE tracks the FTSE Asia Ex-Japan Index, a broad-market benchmark covering large- and mid-cap equities across the widest geographic footprint of the three. IAA follows the S&P Asia 50 Index, a concentrated portfolio of 50 of the region’s largest companies drawn from China, Hong Kong, South Korea, Singapore, and Taiwan. ASIA tracks the Solactive Asia Ex-Japan Technology and Internet Tigers Index, a sector-specific mandate focused on technology and internet companies listed in China, Hong Kong, Taiwan, and South Korea.
| Fund | Index tracked | Geographic scope | FUM | Top holdings |
|---|---|---|---|---|
| VAE | FTSE Asia Ex-Japan | Broadest (Asia ex-Japan, ex-Australia, ex-NZ) | $731.53M | Tencent, TSMC |
| IAA | S&P Asia 50 | China, HK, South Korea, Singapore, Taiwan | ~$1.43B | Alibaba, HSBC, TSMC |
| ASIA | Solactive Asia Ex-Japan Tech & Internet Tigers | China, HK, Taiwan, South Korea | ~$1.18B | SK Hynix, Samsung, Tencent |
TSMC appears as a significant holding in both VAE and IAA, creating overlapping Taiwan Strait geopolitical exposure for any investor who holds both funds simultaneously. That correlation is worth monitoring, particularly given ongoing tensions around Taiwan’s semiconductor manufacturing base.
ASIA presents a different concentration risk entirely. Its top two holdings, SK Hynix at 18.0% and Samsung at 18.0%, combine for 36% of the portfolio in Korean semiconductor names alone. That weighting makes ASIA less a diversified Asian technology fund and more a leveraged bet on the global memory chip cycle. When AI-driven demand surges, that concentration amplifies returns. When the semiconductor cycle turns, it amplifies drawdowns with equal force.
The three funds span a fee range of 0.29% to 0.67% per annum, and the gap between the cheapest and most expensive compounds into a material cost difference over a long holding period.
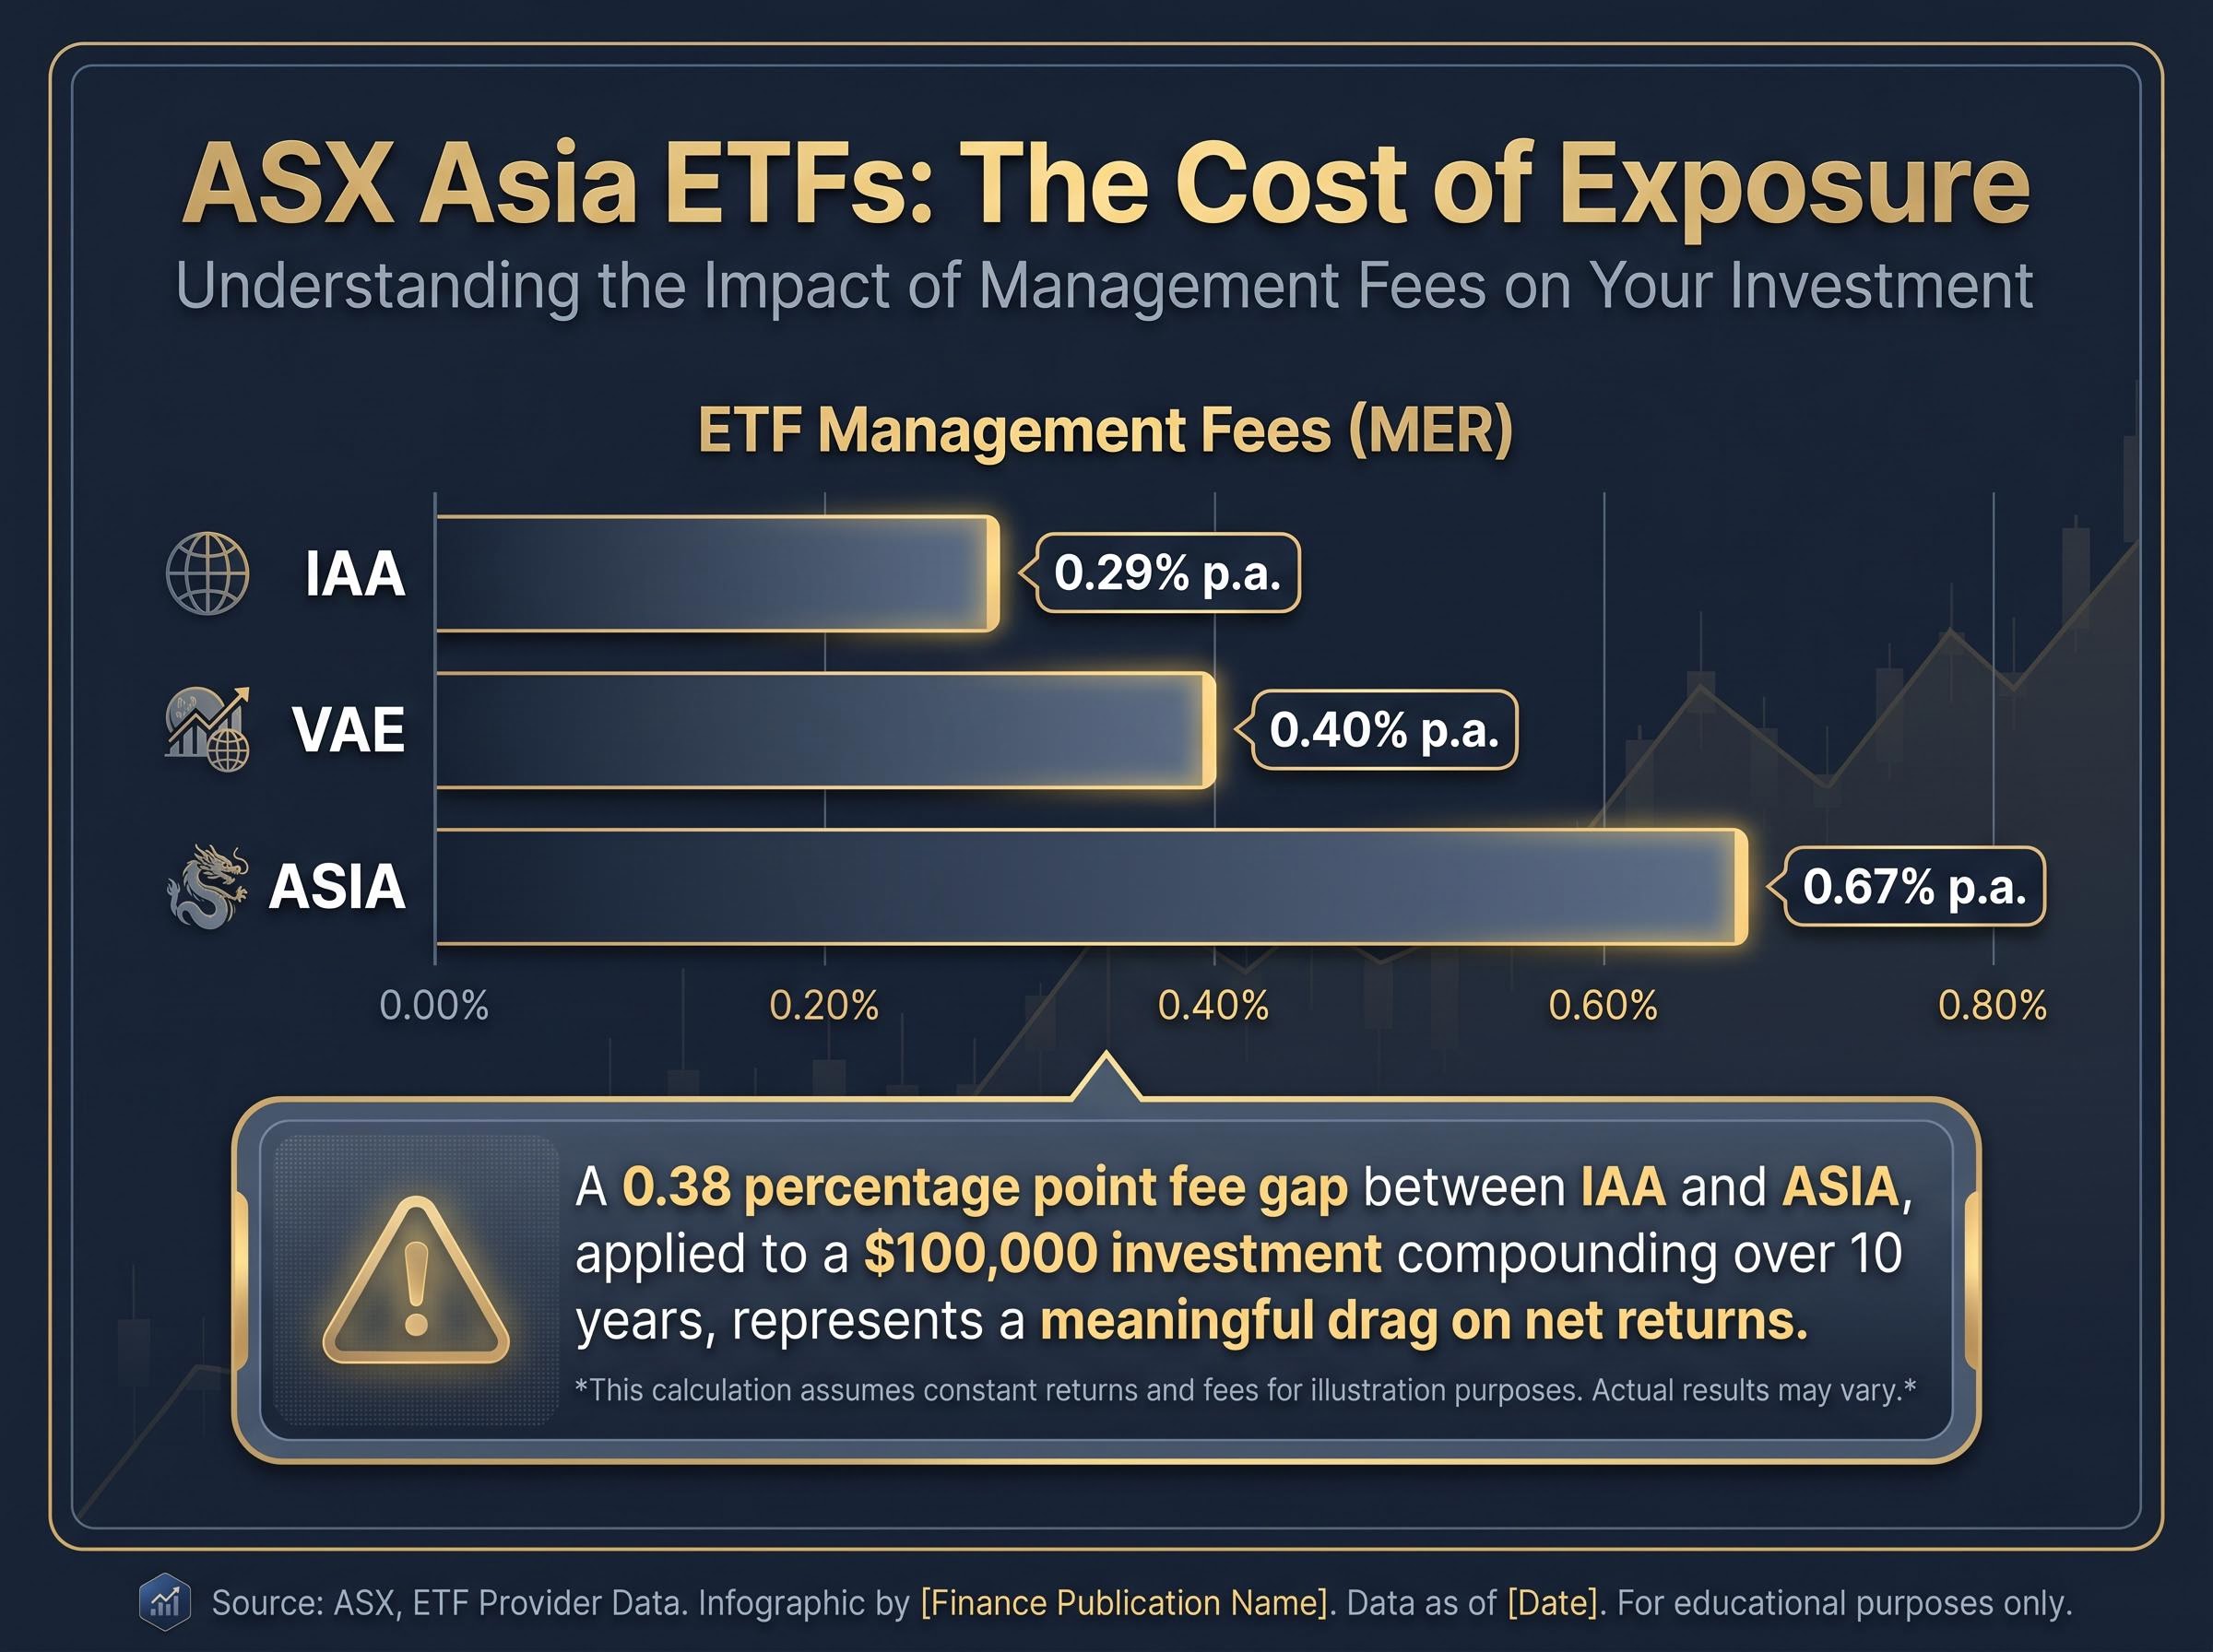
The 0.38 percentage point fee gap between IAA and ASIA, applied to a $100,000 investment compounding over 10 years, represents a meaningful drag on net returns. For investors using these ETFs as long-term core holdings rather than tactical positions, that cost differential deserves weight in the decision.
Whether the higher fee is justified depends entirely on what those additional basis points deliver in returns, which is the question the performance data addresses next.
ETF holding period and tax treatment are material to the net-return comparison across these three funds; units held for at least 12 months qualify for the 50% capital gains tax discount, and the interaction between that discount and each fund’s distribution schedule can shift the after-tax outcome meaningfully depending on whether the position is held inside or outside superannuation.
IAA’s 61.52% one-year return is the headline figure in any comparison of these three funds. It is also the number most likely to mislead if taken at face value.
That return reflects the concentrated power of the S&P Asia 50’s large-cap tilt during a period when South Korean and Taiwanese equities rebounded sharply on AI semiconductor demand and the partial easing of US-China trade tensions. A 50-stock portfolio with heavy exposure to those two markets was structurally positioned to capture that move in a way that a broad-market or sector-specific fund was not.
The AI hardware capex cycle, driven by hyperscaler commitments of $600 billion to $750 billion in 2026 infrastructure spending, is the macro engine behind the semiconductor demand surge that lifted South Korean and Taiwanese equities and, in turn, drove IAA’s outsized one-year return.
| Fund | 1-year return | 3-year return (p.a.) | 5-year return (p.a.) |
|---|---|---|---|
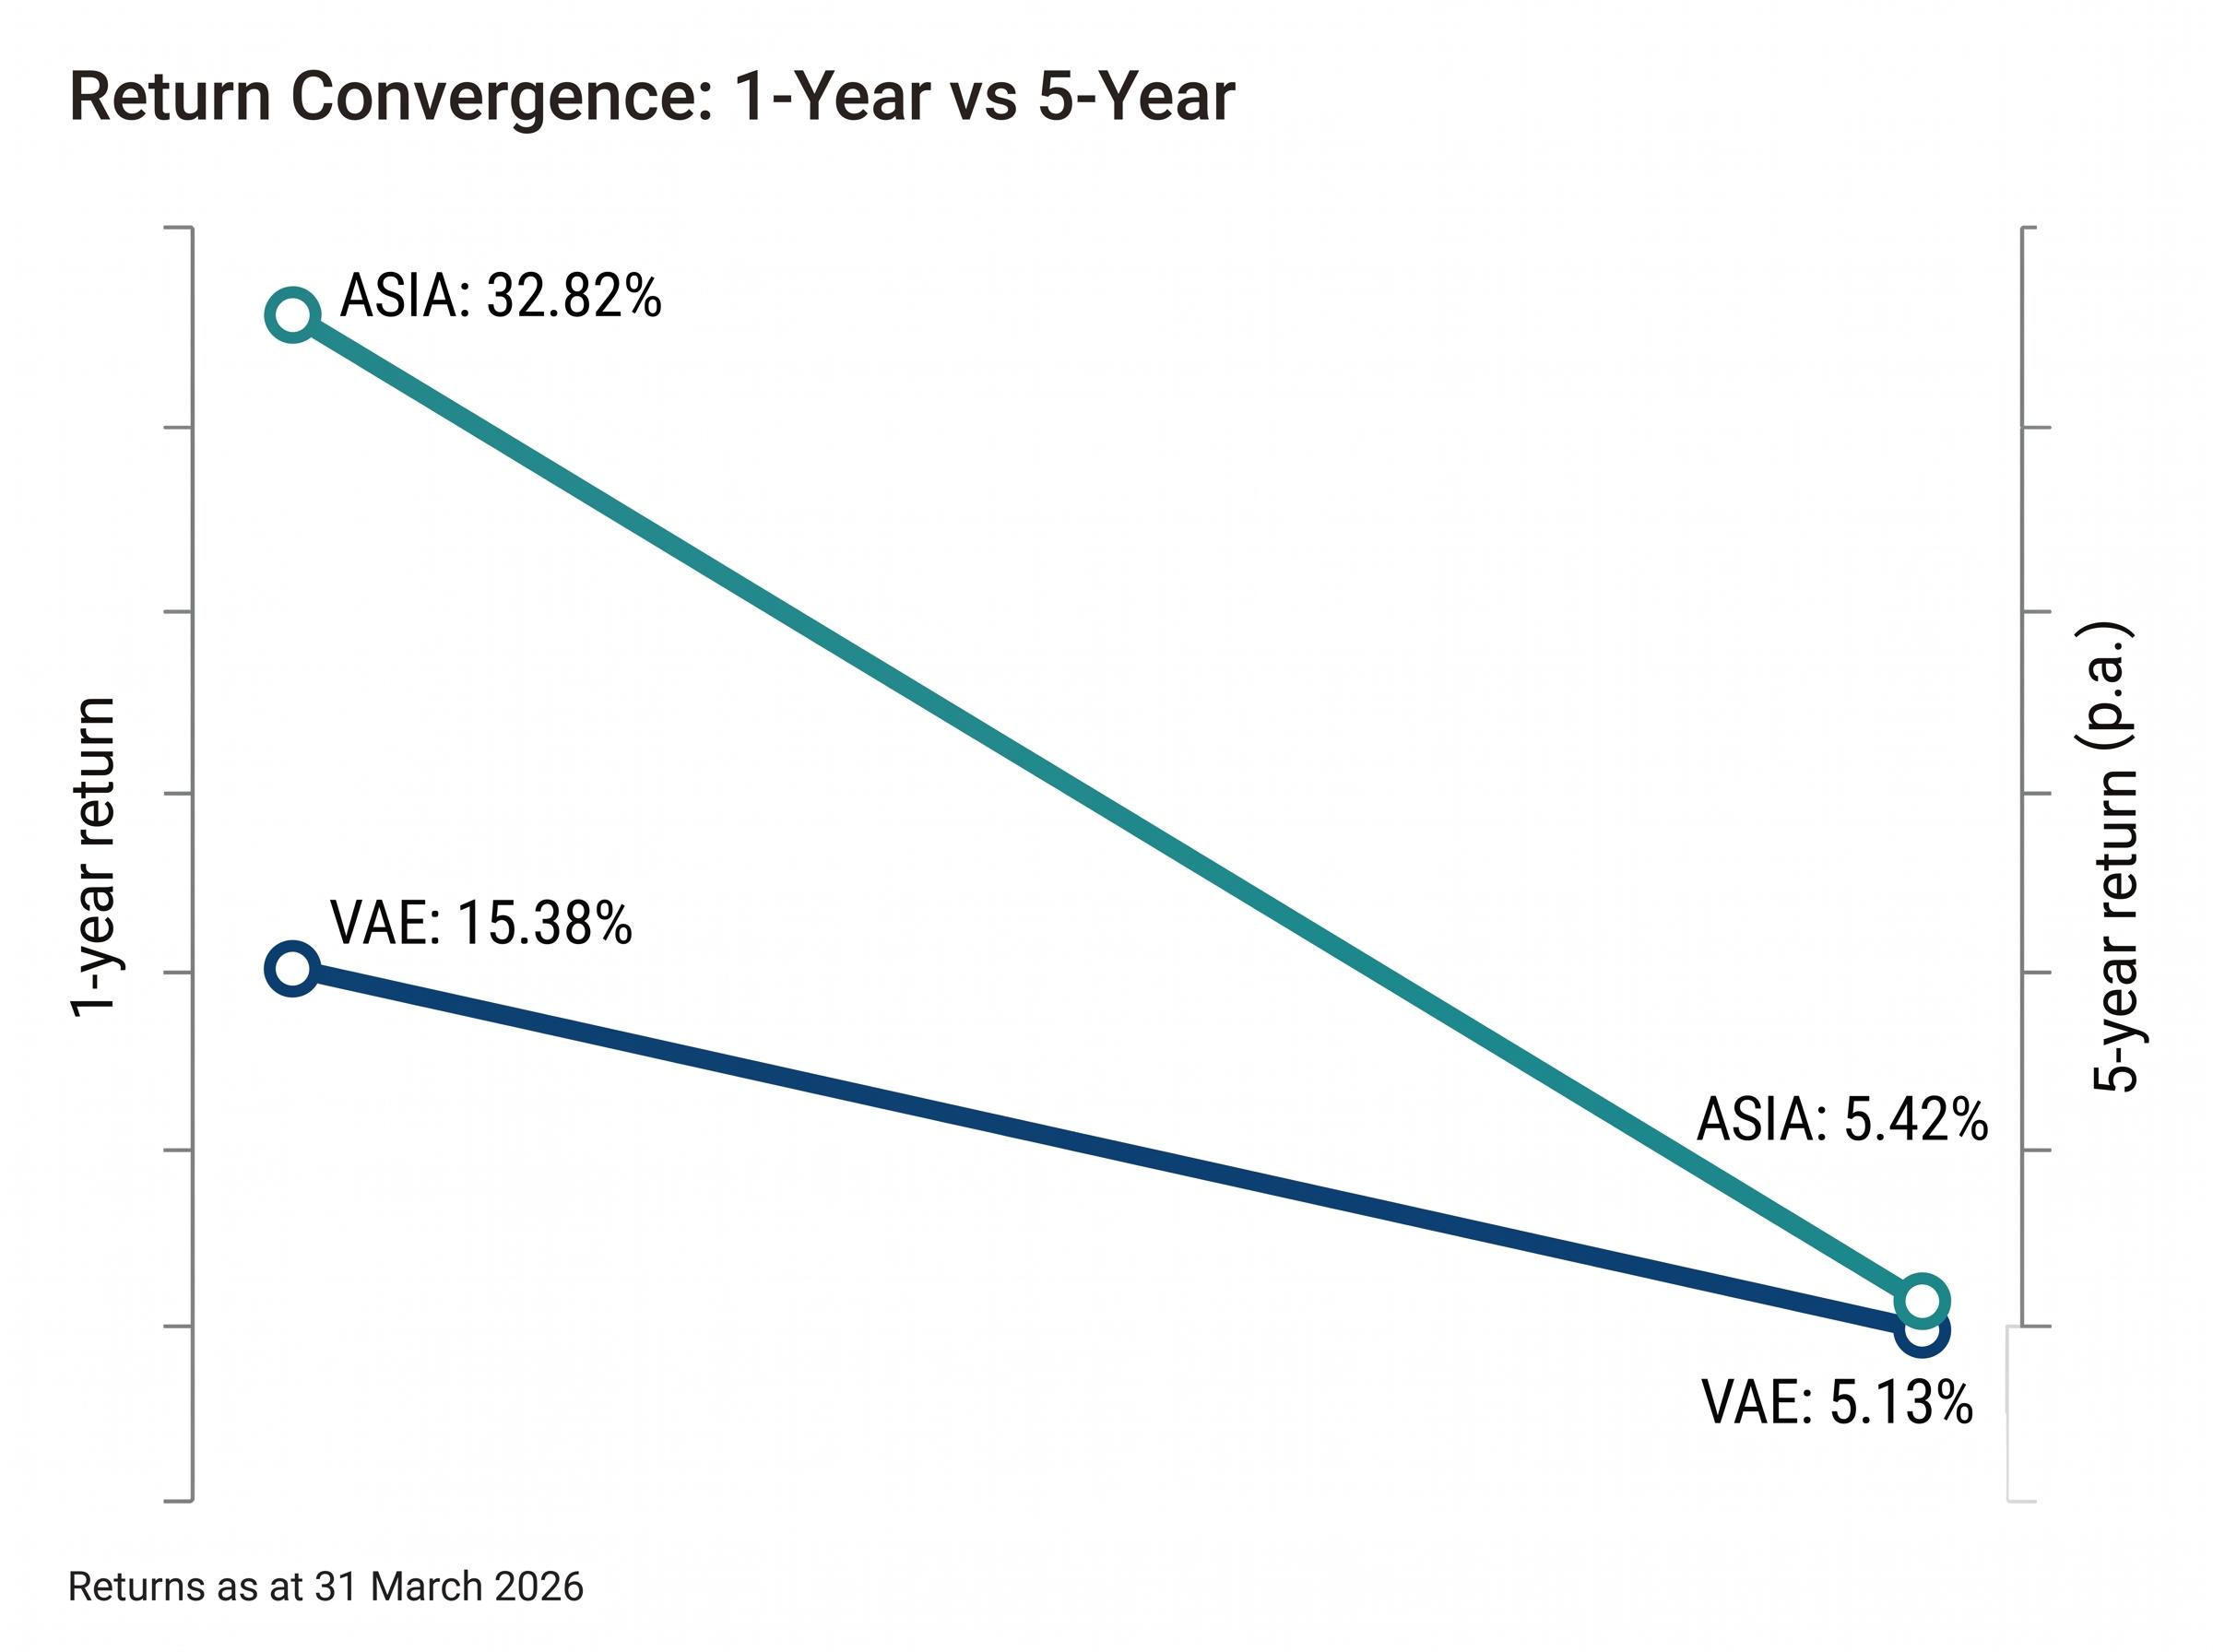
| VAE | 15.38% | 12.76% | 5.13% |
| IAA | 61.52% | 27.77% | N/A |
| ASIA | 32.82% | 24.08% | 5.42% |
VAE and ASIA returns as at 31 March 2026. IAA returns as at approximately May 2026.
ASIA’s strong one-year (32.82%) and three-year (24.08% p.a.) figures mask a five-year return of 5.42% per annum, nearly identical to VAE’s 5.13% p.a. over the same period. That convergence illustrates how sector-specific funds can mean-revert over full market cycles; the technology drawdown of 2022-2023 erased much of ASIA’s earlier outperformance.
Morningstar describes VAE as a “sensible choice” for diversified Asian ex-Japan exposure with low tracking error, a characterisation that frames its relatively modest one-year return as the expected trade-off for lower volatility and broader diversification rather than a sign of underperformance.
Raw return figures without context remain the most common source of poor ETF selection decisions. A fund that led over one year may be structurally ill-suited to an investor’s actual time horizon.
The data above supports a straightforward matching of each fund to a specific investor profile:
Investment horizon matters here. ASIA’s convergence with VAE over five years suggests that the technology premium may not persist across full cycles. Investors paying the higher fee need conviction that the current AI-driven semiconductor cycle has further to run.
Investors weighing whether ASIA’s semiconductor concentration is a structural advantage or a cycle-dependent liability will find our deep-dive into AI hardware bubble risks, which examines the specific conditions under which hyperscaler capex deceleration could trigger a sharp reversal in memory and processor valuations, including the inference cost dynamics and 2027 capex guidance signals to monitor.
Australian investors holding both IAA and VAE may carry more TSMC and broader Taiwan exposure than they realise. Before treating the two funds as independent diversifiers, it is worth reviewing the holdings overlap and considering whether combined Taiwan Strait risk aligns with overall portfolio risk tolerance.
For ASIA holders, the geopolitical risk profile is different but equally concentrated. Ongoing US tech export controls and Chinese counter-regulations targeting supply chains create a volatility variable that falls disproportionately on SK Hynix and Samsung, the fund’s two largest positions at a combined 36% weighting.
The choice between VAE, IAA, and ASIA is not a search for the single best Asian ETF. It is a question of which fund’s design matches a given investor’s objectives, time horizon, and capacity for concentration risk.
The macro tailwinds that drove recent Asian equity performance, AI semiconductor demand, the partial US-China trade normalisation, and China’s Global South export pivot, are not uniformly distributed across all three portfolios. IAA and ASIA captured more of the semiconductor and large-cap rebound; VAE spread the exposure more evenly and absorbed less of both the upside and the risk.
Performance figures used in this analysis carry specific reference dates. Investors considering an allocation to any of these funds should review current factsheets directly from Vanguard Australia, iShares Australia (BlackRock), and BetaShares for the most up-to-date holdings, performance, and fee data before making a decision.
ASIC’s regulatory guide for exchange traded products sets out the disclosure, licensing, and portfolio transparency obligations that ETP issuers must meet in Australia, establishing the compliance baseline that governs how VAE, IAA, and ASIA are structured and reported to investors.
This article is for informational purposes only and should not be considered financial advice. Investors should conduct their own research and consult with financial professionals before making investment decisions. Past performance does not guarantee future results.
The three main ASX-listed Asia ETFs are VAE (Vanguard Asia Ex-Japan ETF), IAA (iShares Asia 50 ETF), and ASIA (BetaShares Asia Technology Tigers ETF), each tracking a different index and offering a distinct risk and return profile.
IAA's 61.52% one-year return reflects its concentrated 50-stock structure with heavy exposure to South Korean and Taiwanese large-caps, which surged on AI semiconductor demand and partial US-China trade normalisation, conditions that a broader or sector-specific fund could not capture as efficiently.
IAA charges approximately 0.29% per annum, making it the cheapest of the three; VAE charges around 0.40%, and ASIA charges the highest fee at approximately 0.67% per annum.
ASIA's five-year annualised return of 5.42% is nearly identical to VAE's 5.13% over the same period, suggesting its sector-specific technology premium can erode across full market cycles, making it better suited to investors with higher risk tolerance and conviction in the ongoing AI semiconductor cycle.
Investors holding both IAA and VAE may carry more Taiwan Strait exposure than they realise due to TSMC's presence in both funds, while ASIA holders face concentrated risk from US tech export controls and Chinese counter-regulations that fall disproportionately on SK Hynix and Samsung, which together represent 36% of that portfolio.