KOSPI Drops 10% as Crowded AI Trade Unwinds Across Global Markets
8 hrs ago

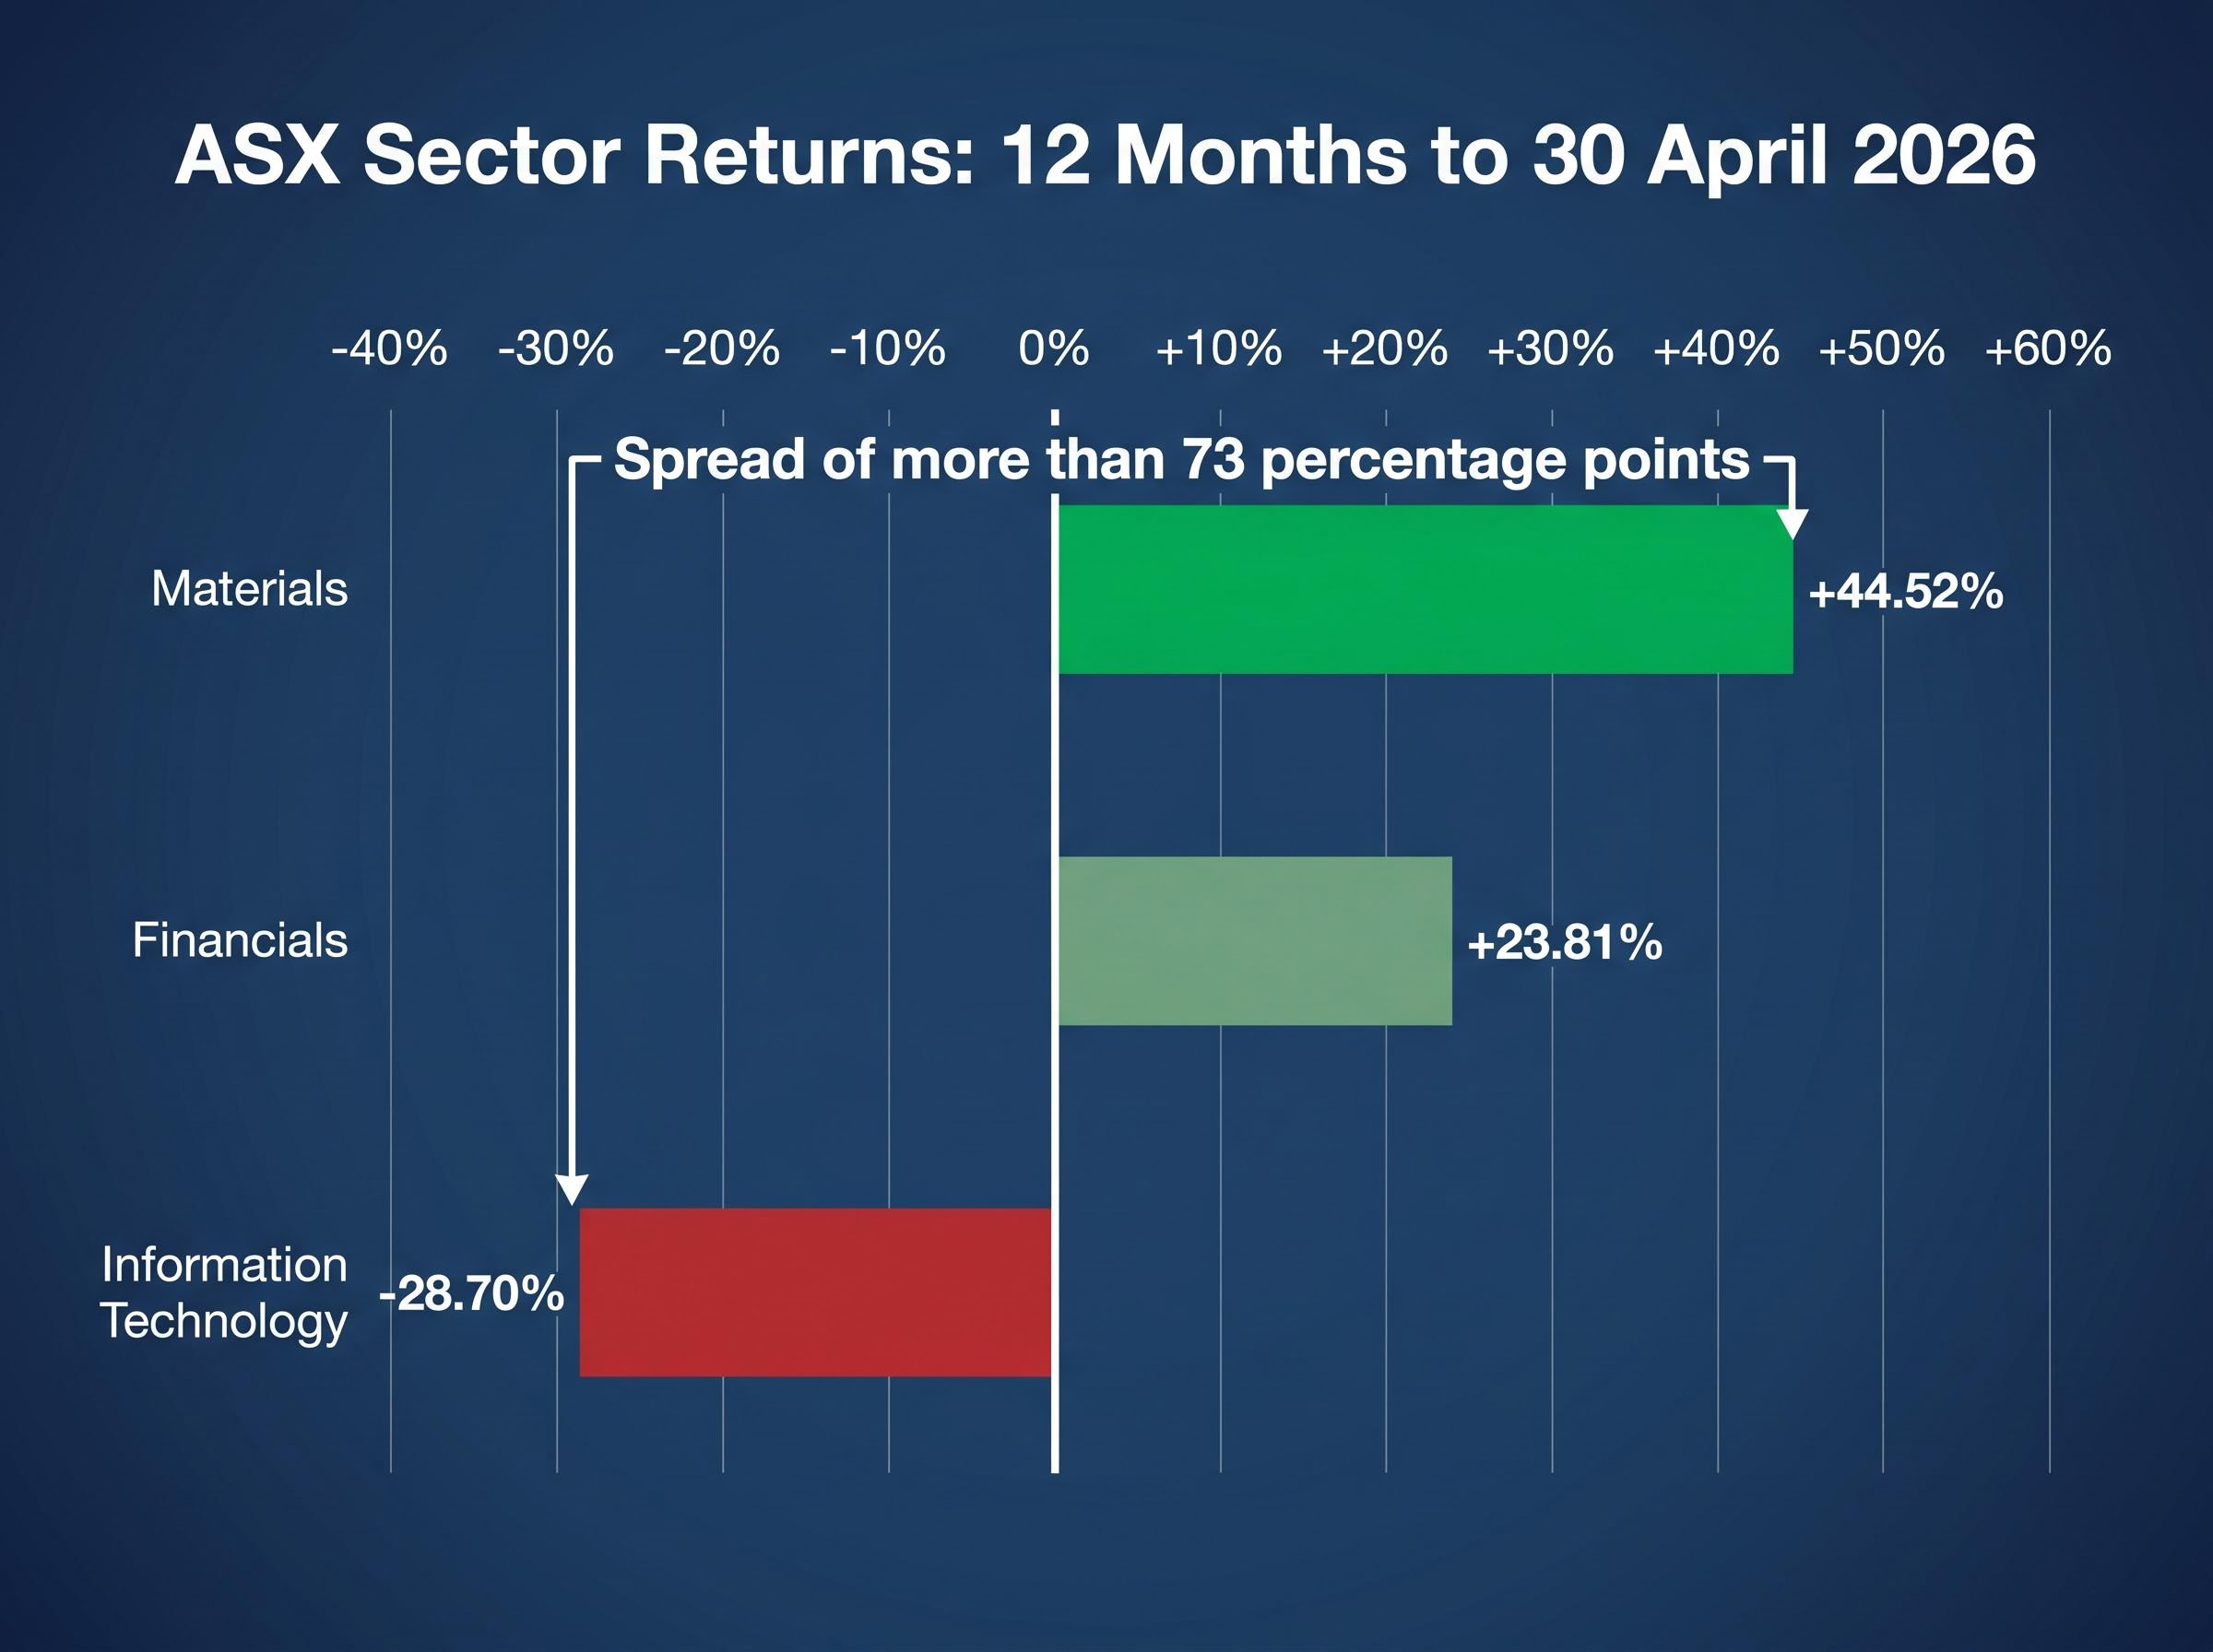
Australian financials returned +23.81% and materials +44.52% over the 12 months to 30 April 2026, while ASX technology stocks shed -28.70%. For investors holding income-oriented ETFs, that divergence translated into something tangible: the Vanguard Australian Shares High Yield ETF (VHY) delivered a total return north of 22%, combining capital appreciation with quarterly distributions that compounded across the year.
Market rotation away from growth and technology and toward dividend-paying financials and resources has been one of the defining features of the Australian equity market over the past year. Elevated interest rates, commodity demand, and stretched growth valuations all contributed. The conditions that drove this rotation did not appear overnight, and they have not yet fully unwound.
What follows uses VHY’s recent performance as a concrete anchor to explain what drove the income-over-growth rotation, what the underlying sector mechanics look like, and how long-term Australian investors should think about positioning high yield ETFs within a broader portfolio.
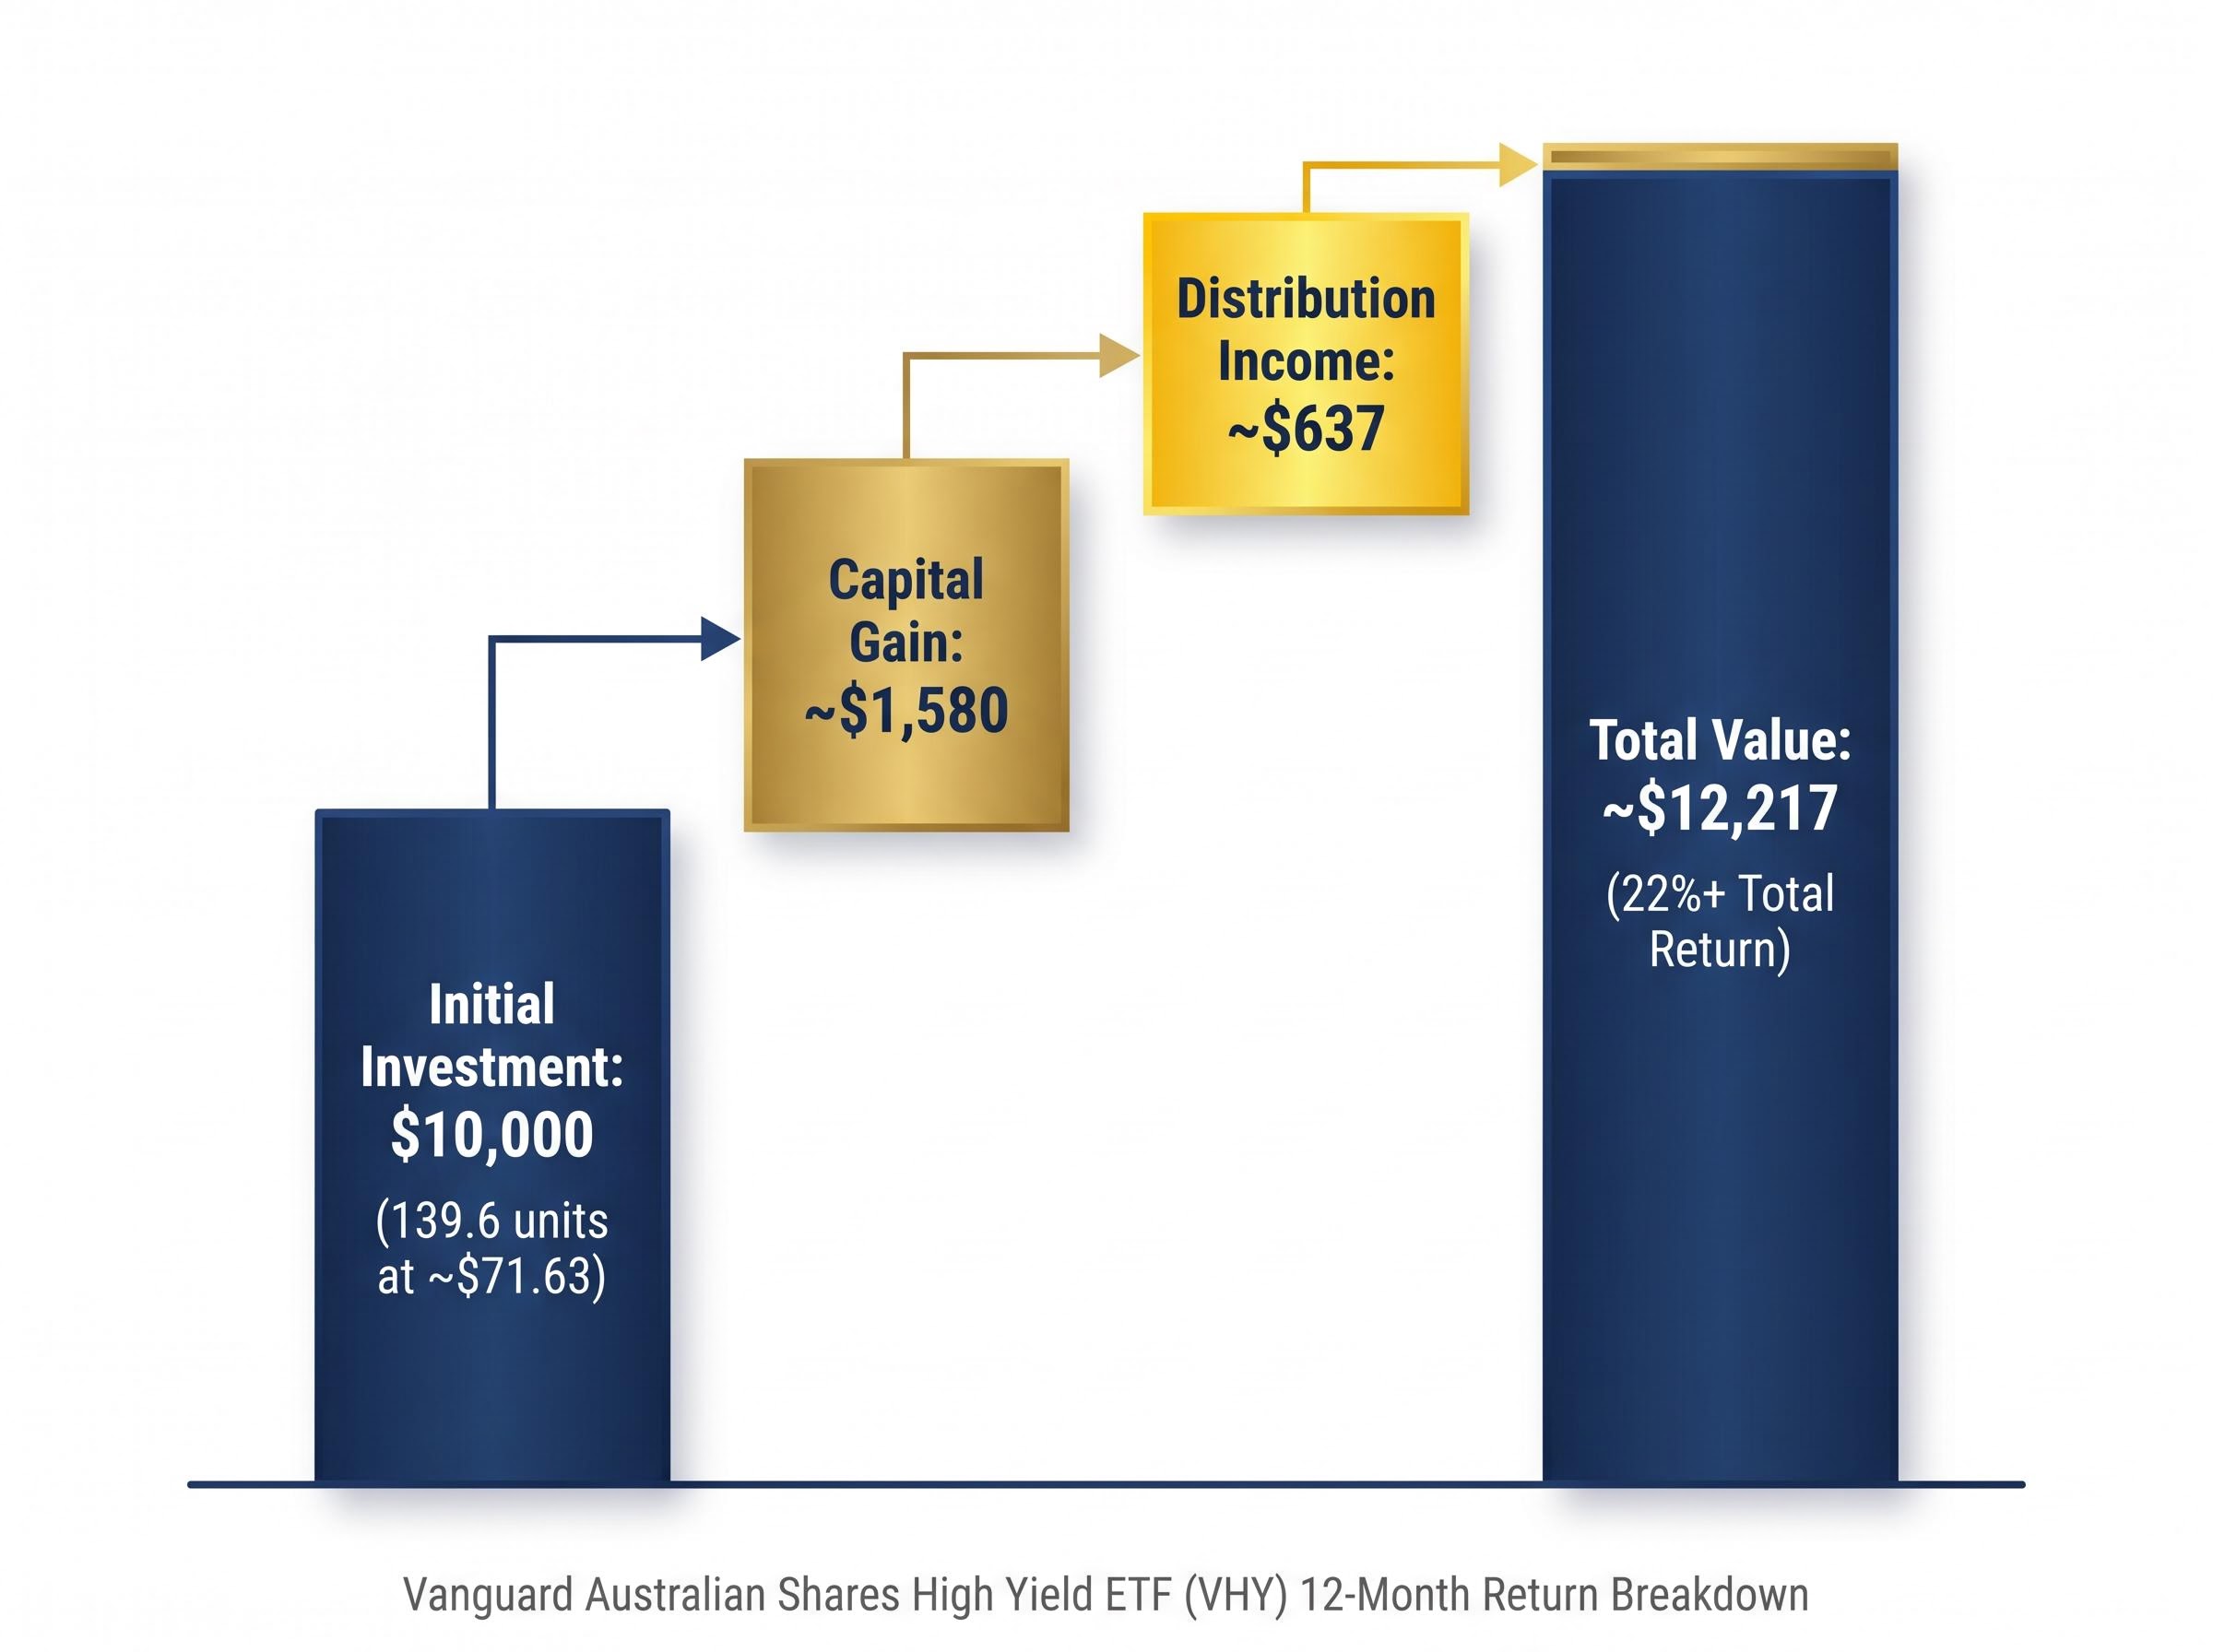
Start with $10,000 invested in VHY at approximately $71.63 per unit in late April 2025. That buys roughly 139.6 units.
Over the following 12 months, VHY paid four distributions per unit:
Cumulative income per unit: approximately $4.56. Across 139.6 units, that generated roughly $637 in distribution income.
Meanwhile, VHY’s unit price rose from approximately $71.63 to approximately $82.98, lifting the capital value of those 139.6 units to roughly $11,580.
Combined total: approximately $12,217, representing just over 22% in 12 months, from a $10,000 outlay.
The table below separates the two return components.
| Return Component | Calculation | Dollar Value |
|---|---|---|
| Capital Gain | 139.6 units × ($82.98 − $71.63) | ~$1,580 |
| Distribution Income | 139.6 units × $4.56 per unit | ~$637 |
| Total Return | Capital + Income | ~$12,217 (22%+) |
That 22% was not a single lucky move on price. It was built from two distinct mechanisms, capital appreciation and income, operating in parallel across four quarters. As of 28 April 2026, VHY’s NAV sits at $82.78, with a trailing yield of 5.49% on an annual distribution of approximately $4.55 per unit.
The total return mechanics at work in VHY’s result, where capital appreciation and reinvested income compound across multiple quarters, are the same mechanics that explain why CBA’s two-year price gain of 52% translated into an estimated 72% total return once fully franked dividends were factored in.
The divergence at the sector level tells the story clearly.
| Sector | VHY Allocation (%) | 12-Month ASX Return (%) |
|---|---|---|
| Financials | ~39% | +23.81% |
| Materials | ~22% | +44.52% |
| Energy | ~11% | N/A |
| Information Technology | ~0.1% | -28.70% |
According to data from Investing.com, materials stocks gained +44.52% over the 12 months to 30 April 2026. Financials added +23.81%. Technology lost -28.70%.
ASX IT stocks fell -28.70% over the same period in which materials surged +44.52%, a spread of more than 73 percentage points.
VHY holds approximately 39% in financials and 22% in materials, according to Vanguard Australia. Its technology allocation is approximately 0.1%. That near-zero technology weighting is not a tactical call by a fund manager. It is a deliberate consequence of VHY’s index construction: the fund tracks high-yielding ASX stocks, and technology companies rarely screen in because they tend to reinvest earnings rather than distribute them.
The result is a portfolio that was structurally positioned to capture the sectors that led and avoid the sector that lagged most sharply.
Three identifiable forces drove the rotation:
RBA research on interest rates and bank profitability confirms that rising rate environments expand net interest margins at the system level, providing the empirical foundation for why Australian bank earnings and dividend capacity strengthened as the rate cycle peaked.
Michael O’Neill at Investors Mutual Limited (IML) has characterised income stocks as particularly compelling for 2026, citing the combination of elevated dividend yields and shifting market conditions. VanEck has published commentary attributing value outperformance to inflationary pressures. JPMorgan Asset Management (Australia) sees value staging a meaningful comeback this year, pointing to increased volatility and stretched growth valuations.
JPMorgan Asset Management (Australia) attributes value’s comeback in 2026 to increased market volatility and stretched valuations in growth segments, framing the rotation as structural rather than temporary.
The consensus among these commentators is that the conditions favouring financials and resources remain broadly intact heading into late 2026.
Two of VHY’s largest holdings illustrate the point at the company level. Westpac Banking Corporation disclosed items impacting its half-year 2026 results on 14 April 2026, including transaction costs associated with the RAMS mortgage book sale. Westpac’s continued dividend activity, including a distribution announcement for WBCPM on 26 March 2026, reflects ongoing earnings momentum in the financial sector.
The Westpac dividend outlook through FY28 is a direct input into VHY’s projected income profile, given Westpac’s position as one of the fund’s largest financial sector holdings; analyst projections point to cumulative dividend growth of approximately 11% over three years, though UNITE programme cost overruns and mortgage margin compression represent credible risks to that trajectory.
BHP Group declared an interim dividend of US$0.73 per share on 13 April 2026, following an approximately 49% share price gain over the preceding 12 months. Analysts hold a “hold” rating on BHP, suggesting much of the price gain is now reflected in the valuation, yet the distribution continues.
Both companies are generating capital gains and dividend income simultaneously, a combination that has directly fed VHY’s total return profile.
High yield ETFs select their constituents through a specific process. They screen the broader market for stocks with above-average dividend yields. This yield filter systematically tilts the resulting portfolio toward mature, cash-generative sectors and away from reinvestment-heavy growth companies.
The defining features of this selection methodology include:
This stands in contrast to a broad-market ETF tracking the S&P/ASX 200, which holds technology and growth stocks at their market-capitalisation weight. A broad-market fund would have carried meaningful exposure to the ASX IT sector’s -28.70% decline. VHY’s construction excluded almost all of it.
VHY operates within a competitive field of ASX-listed income ETFs. The table below summarises the peer group.
ASX income ETF alternatives to VHY span a range of yield profiles and index methodologies, from the S&P/ASX Dividend Opportunities approach used by IHD to BetaShares’ HVST dividend harvesting overlay, each with different sector tilts and distribution frequencies that affect how the funds perform across the same rate and commodity cycles this article describes.
| ETF Ticker | Issuer | Key Characteristic |
|---|---|---|
| VHY | Vanguard Australia | Tracks high-yield ASX stocks; trailing yield 5.49% |
| IHD | iShares (BlackRock) | S&P/ASX Dividend Opportunities index |
| SYI | SPDR (State Street) | MSCI Australia Select High Dividend Yield index |
| HVST | BetaShares | Dividend harvesting strategy with active management overlay |
VHY’s trailing yield of 5.49%, based on an annual distribution of approximately $4.55 per unit, positions it as the benchmark against which peers are frequently assessed. Its most recent distribution of $0.811 per unit carried an ex-date of 31 March 2026 and a payment date of 19 April 2026. As of 28 April 2026, VHY’s NAV stood at $82.78 with a market price of $82.87.
The same mechanics that made income strategies outperform this year are the mechanics that will produce a different leader in a different environment. Three conditions underpin the current income cycle:
IML, VanEck, and JPMorgan Asset Management (Australia) all view these conditions as broadly intact heading into late 2026, but each has framed them as conditions, not certainties. Conditions change.
VHY’s own price history reinforces the point. Its 52-week low of $63.36 against a current NAV of $82.78 represents more than 30% of price range, a reminder that income-focused funds carry meaningful price volatility of their own.
No single style dominates indefinitely. The income rotation is a product of specific conditions, not a permanent market state.
The practical implication is straightforward. Income ETFs like VHY serve a yield and stability function. Growth or broad-market ETFs serve a capital appreciation function. Neither eliminates the need for the other.
The appropriate balance between income and growth exposure depends on investment horizon, tax position, and income needs. For Australian investors specifically, franking credits attached to domestic dividend stocks and the ETFs that hold them represent a meaningful additional return component. These credits do not appear in the headline yield figure but can materially improve after-tax income, particularly for investors in lower tax brackets or those holding within superannuation.
Parliamentary Budget Office guidance on franking credits outlines how dividend imputation prevents double taxation and delivers a tangible cash or offset benefit to shareholders, with the magnitude of that benefit varying depending on the investor’s marginal tax rate and whether the investment is held within superannuation.
Holding both styles means a portfolio always participates in whichever is leading, at the cost of never fully capturing either. That trade-off is the point. The ASX IT sector’s -28.70% return over the past year would have been painful for growth-concentrated portfolios, just as technology’s prior-cycle leadership would have been missed by income-only allocations.
VHY’s 22%-plus return over the 12 months to 30 April 2026 reflects a real structural rotation into financials and resources, supported by identifiable macro conditions: elevated rates, commodity demand, and growth valuation compression. The data is not ambiguous.
The lesson from this cycle, however, is not to rotate all capital into income ETFs. It is to ensure income exposure exists so a portfolio participates when income leads, and to maintain growth exposure so the portfolio participates when that cycle turns.
Does the current portfolio hold meaningful exposure to both income-generating and growth-oriented Australian equities? That is the question this year’s data makes worth answering.
For investors wanting to put the income-versus-growth balance into a concrete allocation structure, our dedicated guide to building a 3-layer ASX portfolio covers a cash-plus-income-plus-equities framework calibrated to the current high-rate environment, including how dollar-cost averaging and tax-loss harvesting can turn the volatility visible in VHY’s 52-week price range into a structural advantage.
This article is for informational purposes only and should not be considered financial advice. Investors should conduct their own research and consult with financial professionals before making investment decisions. Past performance does not guarantee future results. Financial projections are subject to market conditions and various risk factors.
High yield ETFs in Australia, such as VHY, screen the broader sharemarket for stocks with above-average dividend yields, resulting in a portfolio heavily weighted toward banks, miners, and utilities that pay regular dividends rather than reinvesting earnings into growth.
The Vanguard Australian Shares High Yield ETF (VHY) delivered a total return of just over 22% over the 12 months to 30 April 2026, combining approximately $1,580 in capital gains and $637 in distribution income on a $10,000 initial investment.
Elevated interest rates widened bank net interest margins, strong commodity demand boosted miner revenues and dividends, and stretched growth valuations compressed technology multiples, producing a spread of more than 73 percentage points between materials (+44.52%) and ASX IT stocks (-28.70%).
As of 28 April 2026, VHY carries a trailing yield of 5.49%, based on an annual distribution of approximately $4.55 per unit and a NAV of $82.78.
Financial commentators including IML, VanEck, and JPMorgan Asset Management (Australia) caution that the conditions favouring income stocks are not permanent; holding both income and growth ETFs ensures a portfolio participates in whichever style is leading at any given time.