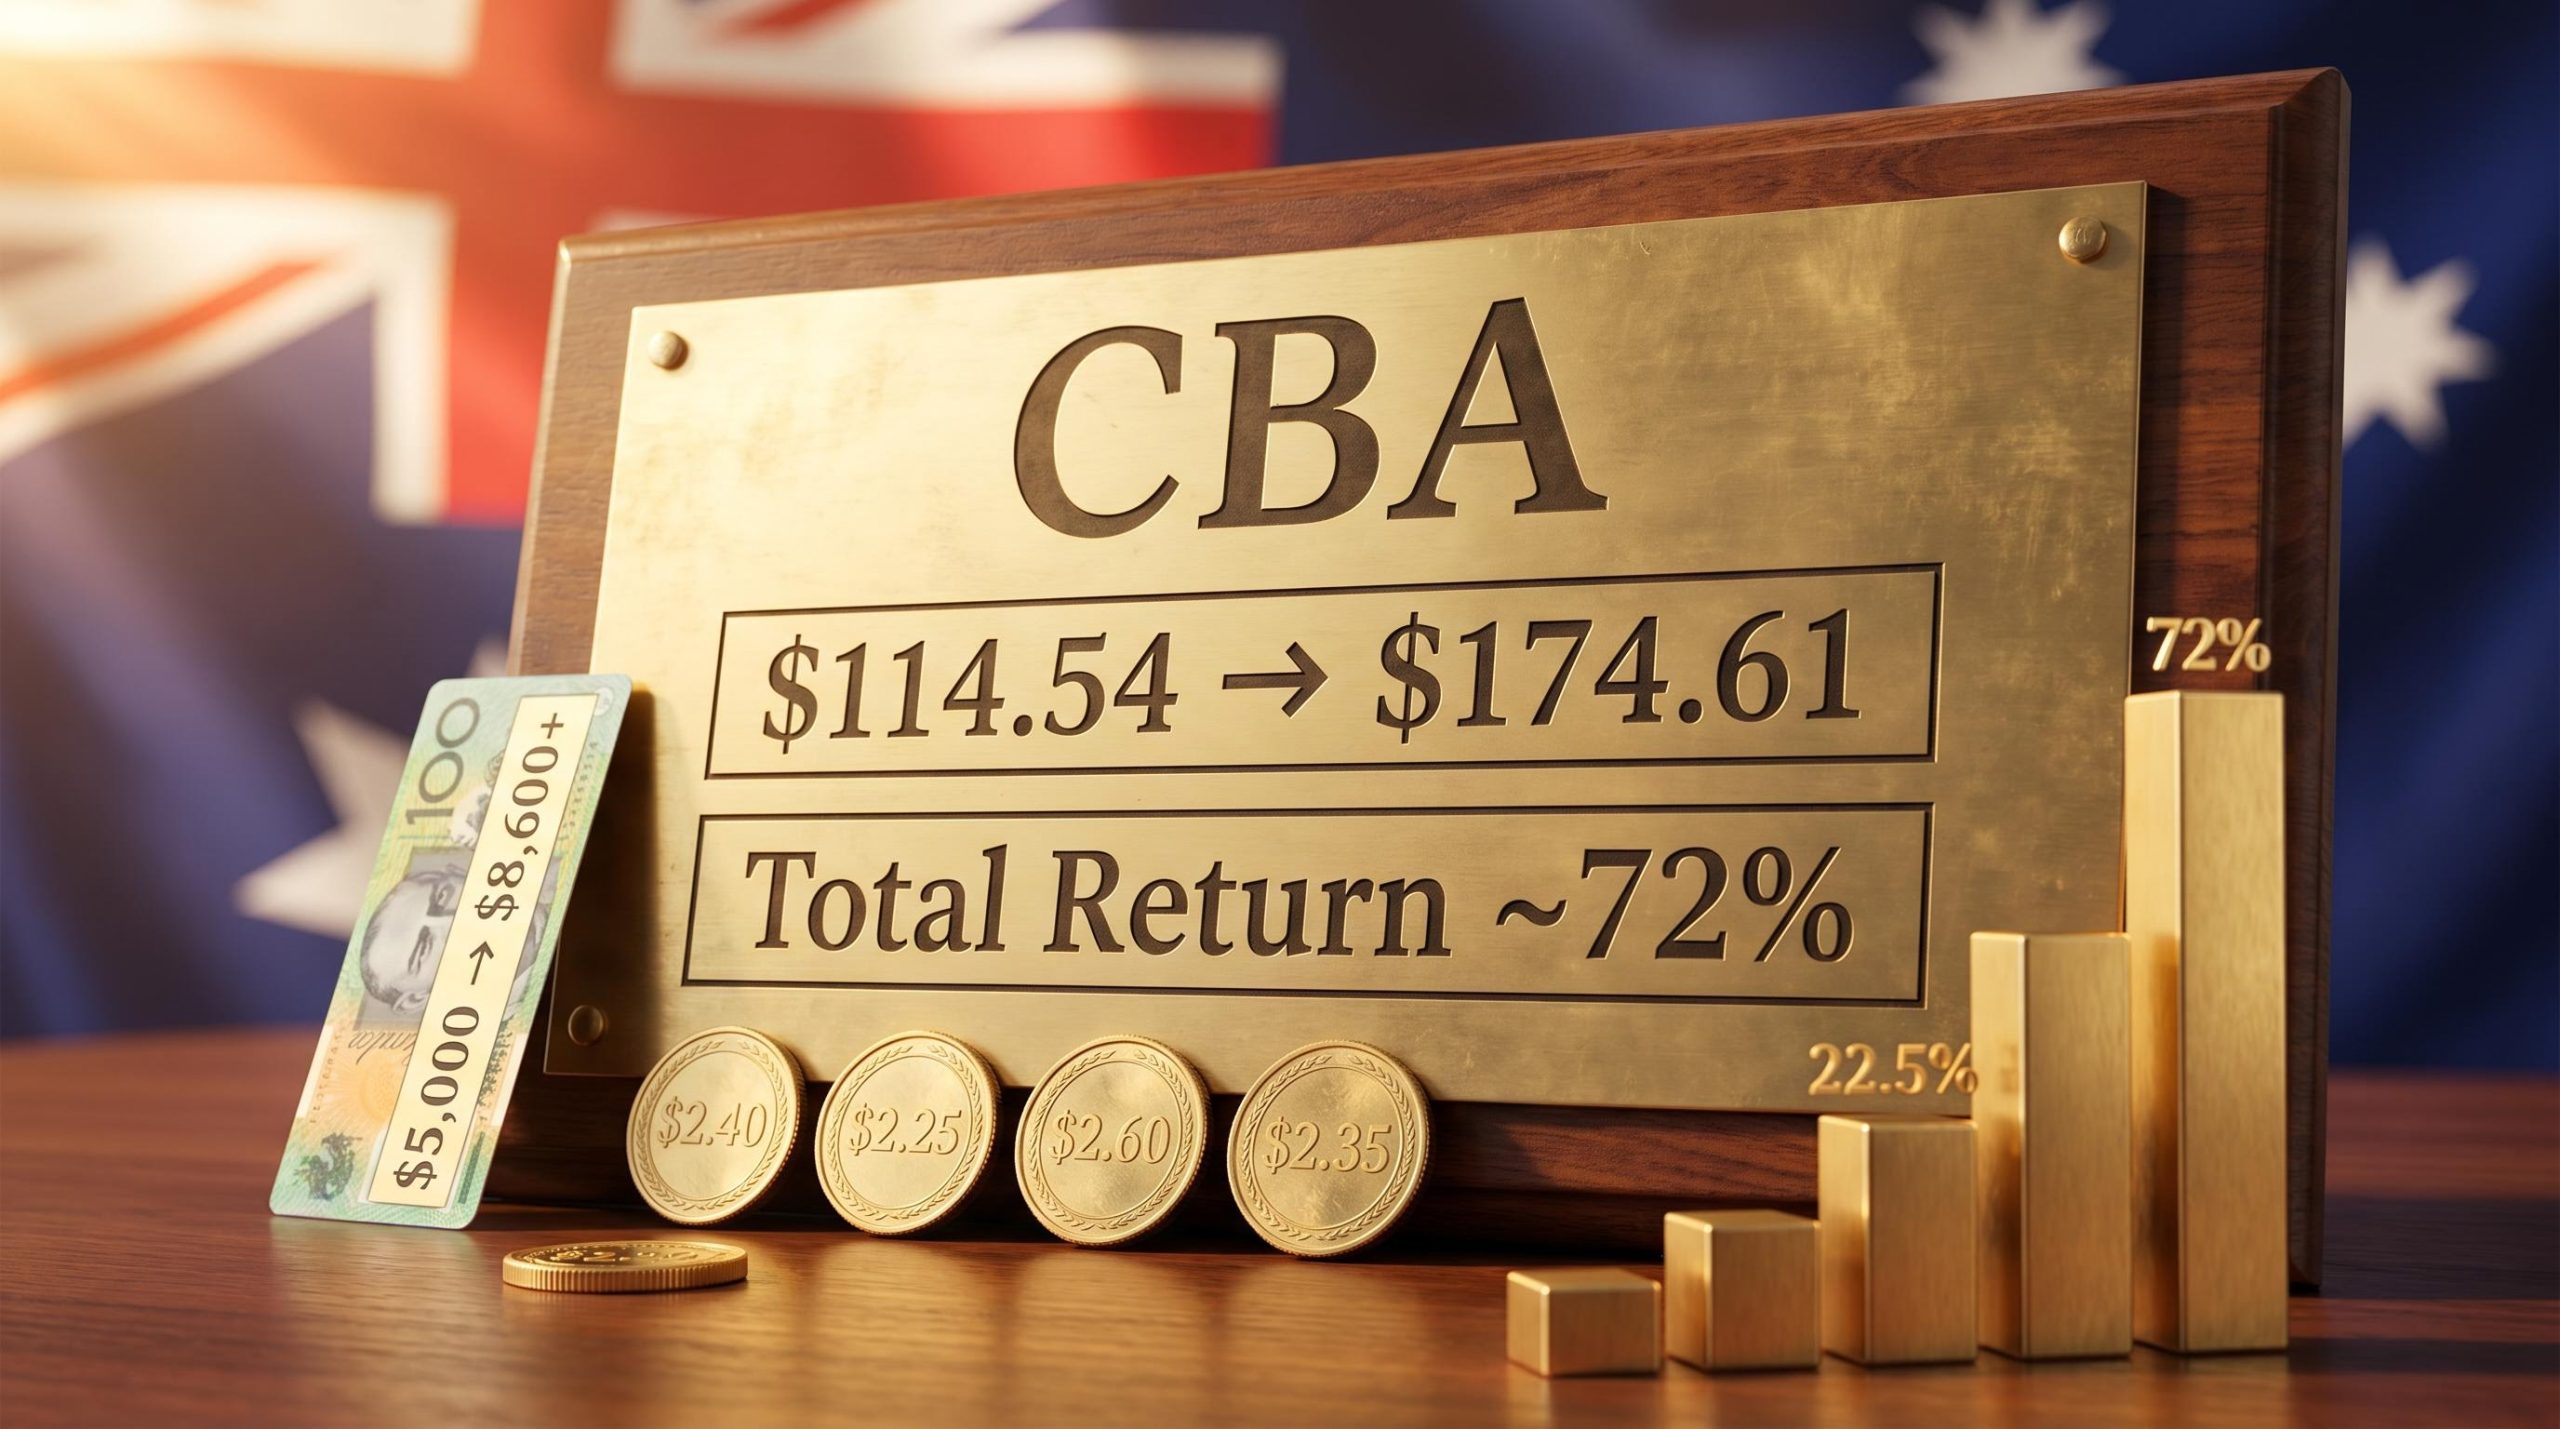
A $5,000 investment in Commonwealth Bank of Australia (CBA) shares two years ago is worth more than $8,600 today, yet roughly $600 of that gain never showed up on a price chart. From April 2024 to April 2026, the CBA share price rose approximately 52.5%, comfortably outpacing the S&P/ASX 20 Index’s 22.5% price return over the same window. But the price chart tells only part of the story. Four rounds of fully franked dividend payments added $9.60 per share in gross income, and when reinvested, those distributions pushed the estimated total return closer to 72%. For many Australian investors, particularly those holding through superannuation, the after-tax value of those franking credits lifted returns further still. What follows unpacks how dividends and franking credits transformed CBA’s already strong price performance into a materially better total return outcome, what the mechanics of that process actually look like in practice, and what the experience teaches about using blue-chip income stocks as wealth-building instruments rather than merely defensive ones.
How far CBA shares actually travelled in two years
On 30 April 2024, CBA shares traded at approximately $114.54. By 29 April 2026, they had reached $174.61, a capital gain of roughly 52.5%. That figure alone would be a strong two-year result for any large-cap bank stock. Against the S&P/ASX 20 Index (XTL), which returned approximately 22.5% on a price basis over the same period, CBA delivered more than double the benchmark’s gain.
CBA’s 2026 year-to-date performance of approximately 8.4% total return has continued to outpace a negative ASX 200, even as the stock’s premium multiple of 25-28 times forward earnings widened the gap between market price and the consensus analyst target of around $129.85.
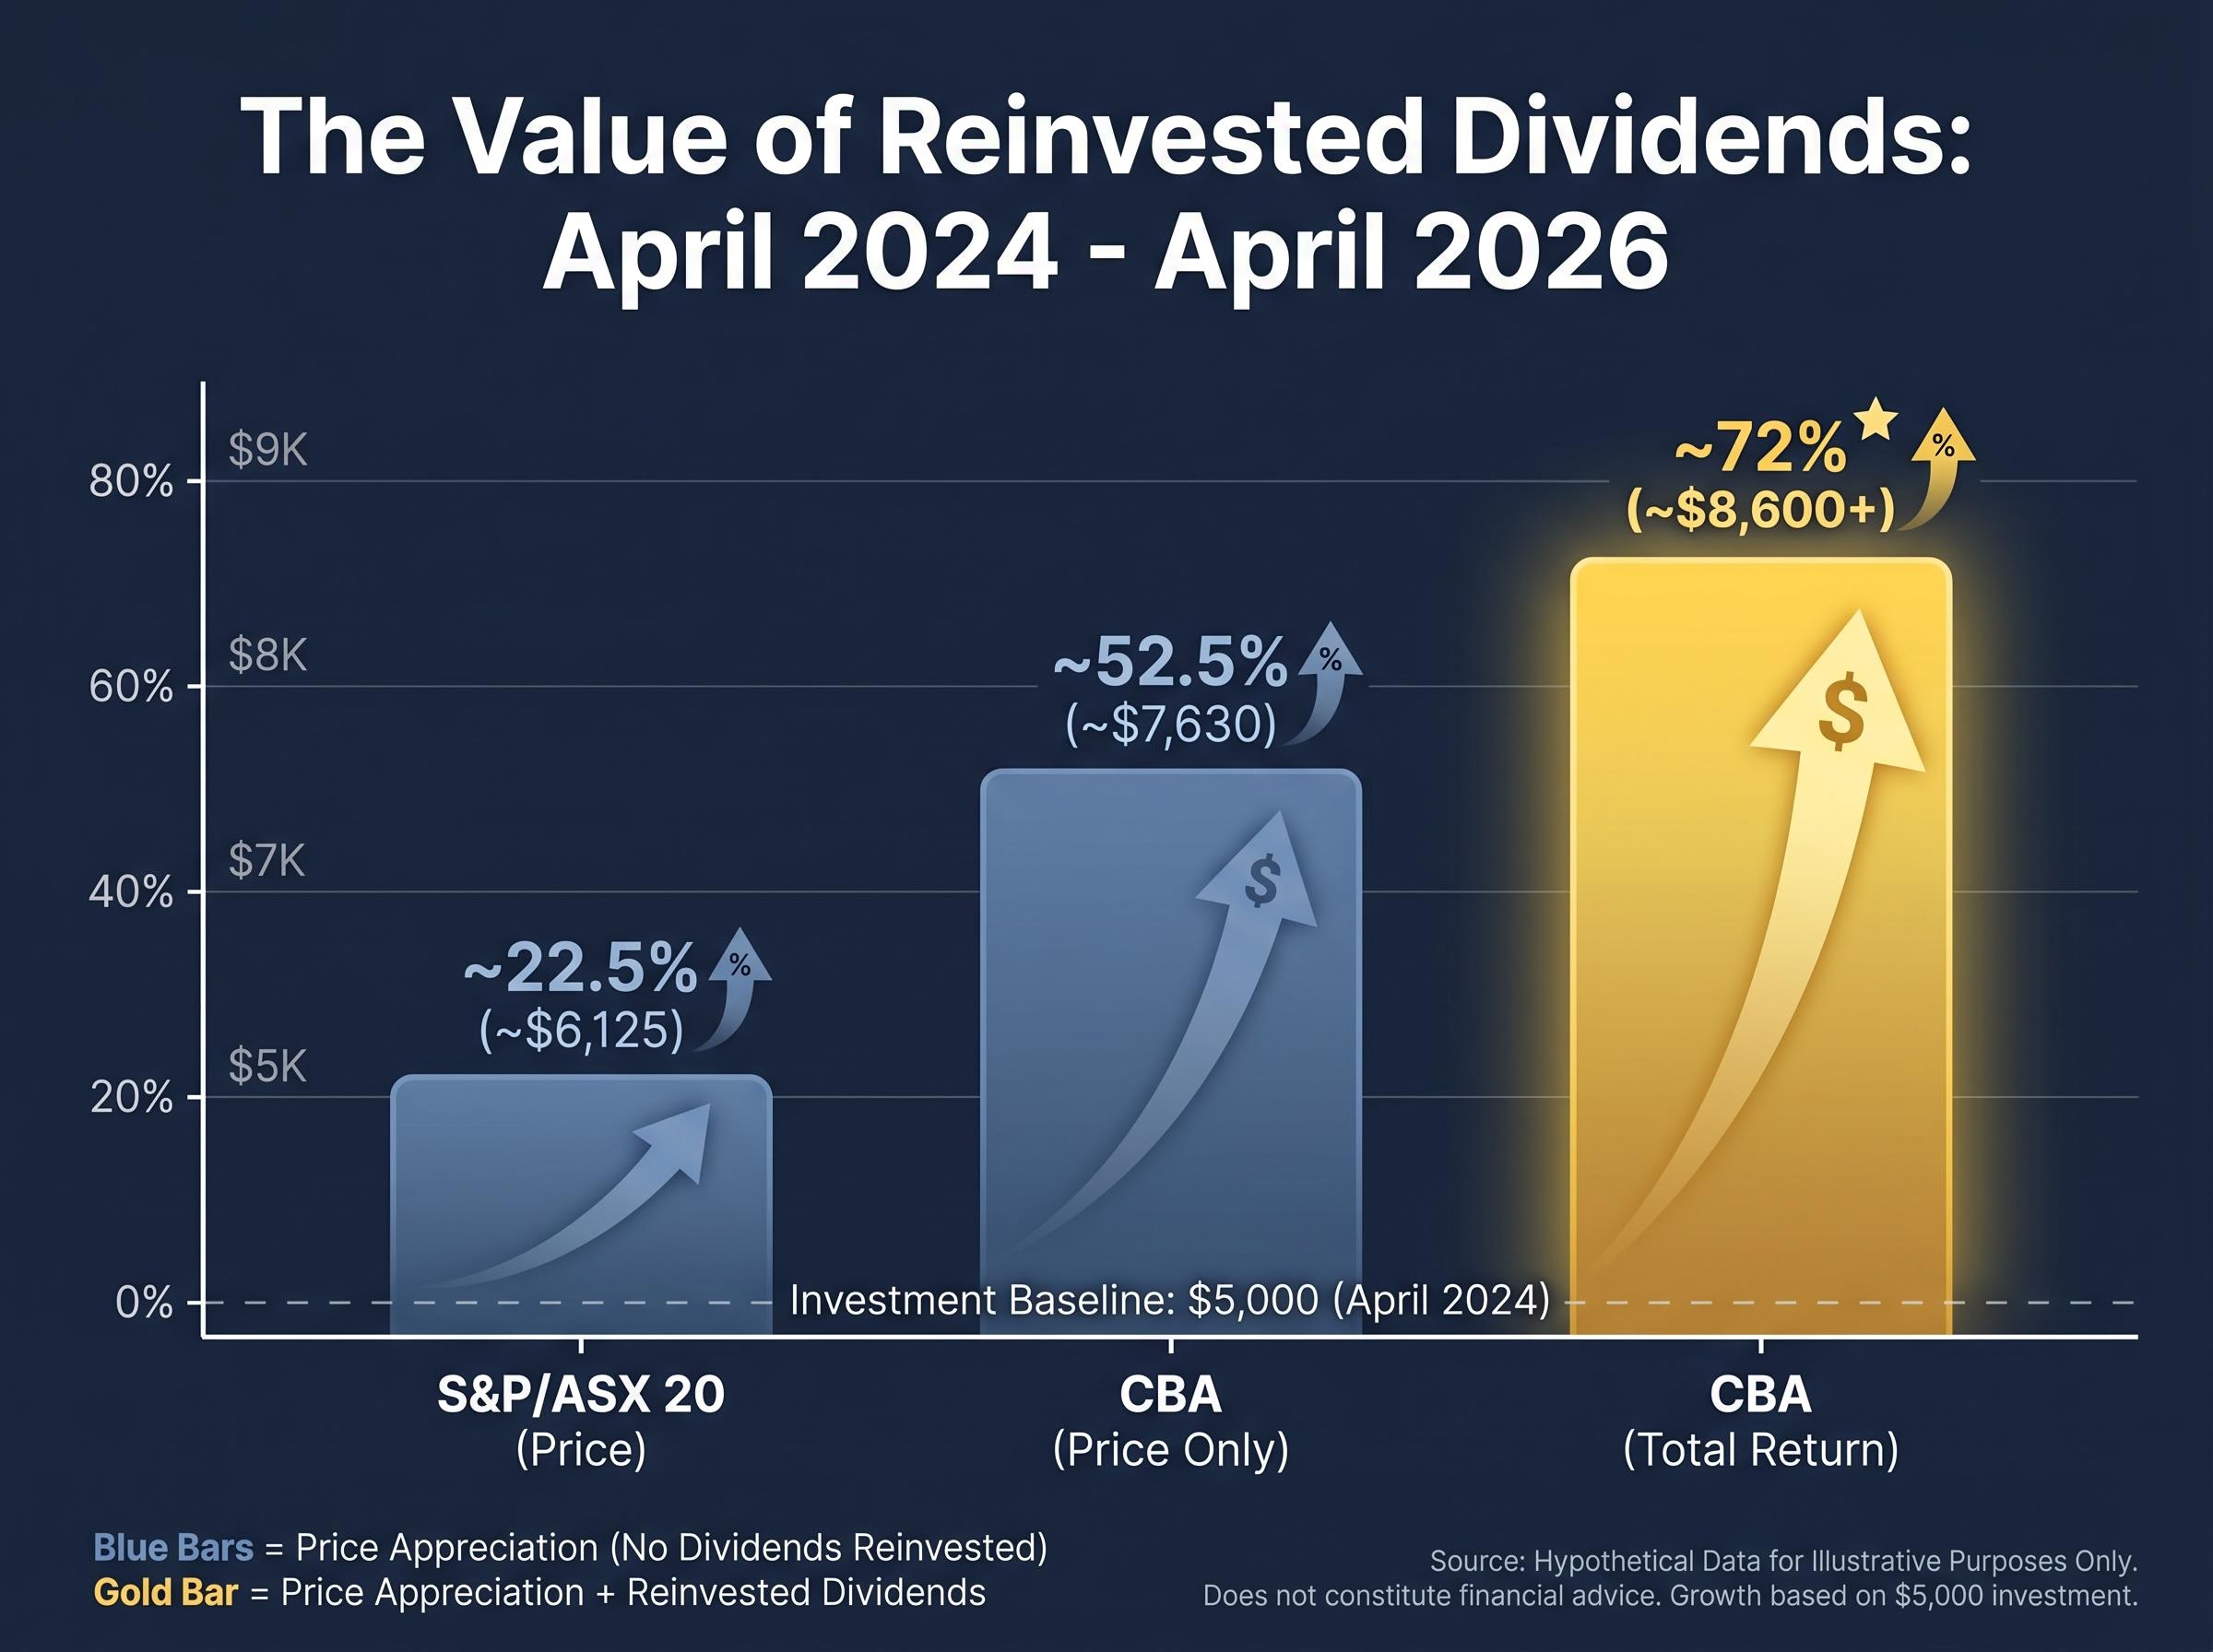
CBA’s 52.5% price return over two years more than doubled the S&P/ASX 20’s 22.5% return, yet even that figure understates the full result.
A hypothetical $5,000 investment at the April 2024 price would have acquired approximately 43.7 shares. On price alone, those shares would be worth roughly $7,630 by late April 2026. That is the number most investors see when they check their portfolio.
It is not the final answer.
| Metric | CBA (price only) | CBA (total return est.) | S&P/ASX 20 (price) |
|---|---|---|---|
| Two-year return | ~52.5% | ~72% | ~22.5% |
| $5,000 invested becomes | ~$7,630 | ~$8,600+ | ~$6,125 |
When big ASX news breaks, our subscribers know first
The dividend stream that most investors undercount
Between April 2024 and April 2026, CBA paid four fully franked dividends. Each arrived on schedule, each was larger than the market broadly expected at the start of the period, and together they deposited $9.60 per share in gross income into shareholders’ accounts.
The sequence matters because it shows the income was not a single event but a recurring, growing cash flow.
| Dividend | Per share | Ex-dividend | Paid | ~43.7 shares |
|---|---|---|---|---|
| FY2024 Final | $2.40 | August 2024 | September 2024 | ~$105 |
| FY2025 Interim | $2.25 | February 2025 | March 2025 | ~$98 |
| FY2025 Final | $2.60 | August 2025 | September 2025 | ~$114 |
| FY2026 Interim | $2.35 | February 2026 | March 2026 | ~$103 |
| Total | $9.60 | ~$419 |
The FY2025 full-year payout of $4.85 per share represented a record at the time, and the H1 FY2026 interim of $2.35 lifted a further 4% above the prior-year interim. On the 43.7-share position, total gross dividend income came to approximately $419.
What reinvesting those dividends actually did to the position
Each dividend payment, if reinvested at the prevailing share price, purchased additional fractional shares. Those additional shares then earned dividends of their own. This compounding mechanism, quiet and incremental, pushed the estimated total return from approximately 52.5% on price alone to approximately 72% with dividends reinvested.
On a $5,000 starting position, the difference between tracking price only and tracking total return is roughly $970-$1,000 in additional value by April 2026. That is the gap between $7,630 and the $8,600-plus outcome.
What “fully franked” means and why it matters more than most investors realise
Every dividend CBA paid across this period carried a full franking credit. To understand why that matters, start with the problem franking solves: without it, corporate profits would be taxed twice, once at the company level (30% for CBA) and again as income in the shareholder’s hands.
Australia’s dividend imputation system prevents this. The franking credit represents the investor’s share of the tax CBA has already paid. That credit attaches to the dividend and can be used to reduce personal tax, or in some cases, generate a cash refund.
The benefit differs sharply depending on who holds the shares:
- Accumulation-phase superannuation (taxed at 15%): The 30% franking credit exceeds the fund’s 15% tax rate on dividend income. The excess credits reduce tax on other fund income or produce a refund, boosting after-tax returns materially.
- Pension-phase superannuation (taxed at 0%): No tax is payable, so the full 30% franking credit is refunded in cash. This lifts the effective after-tax value of the dividend substantially.
- Higher-bracket retail investors (above 30%): Franking credits offset personal tax liability on the dividend, reducing the net tax payable compared to an unfranked alternative.
The franking credit yield for SMSF holders in pension phase is particularly compelling: because the fund pays zero tax, the full 30% corporate tax credit attaches as a refundable cash offset, lifting the effective gross yield on CBA’s nominal 2.8% trailing payout to approximately 4.0% for that cohort.
For pension-phase superannuation investors, fully franked dividends can deliver an effective after-tax yield of approximately 1.4x the face value of the dividend received.
For the millions of Australians whose CBA shares sit inside a super fund, this is not a theoretical tax concept. It is a real cash enhancement that changes how fully franked income should be valued relative to unfranked alternatives.
ASFA’s analysis of dividend imputation confirms that pension-phase super fund members receive a full cash refund of the 30% franking credit from the ATO when their tax liability falls to zero, making the effective after-tax value of a fully franked dividend materially higher than its face amount.
Building the full return picture: from 52% price gain to 72% total return
The total return on CBA over this two-year window has three components, and stacking them explicitly is worth the exercise.
- Capital gain: The share price moved from approximately $114.54 to $174.61, delivering roughly 52.5% in price appreciation.
- Dividend income: Four fully franked payments totalling $9.60 per share contributed approximately $419 gross on a 43.7-share position.
- Reinvestment compounding: Each dividend reinvested at the prevailing price bought additional shares, which earned subsequent dividends. This compounding layer pushed the estimated total return to approximately 72%.
On the $5,000 example, the price-only outcome was roughly $7,630. The total return outcome, with dividends reinvested, exceeded $8,600. The gap of approximately $970-$1,000 arrived without requiring any additional capital commitment. It required only that the investor treated income distributions as capital to redeploy rather than cash to spend.
For superannuation investors, the real return is higher still once franking credit refunds are factored in. The 72% figure is, for the best-placed holders, a conservative floor.
Why yield compression does not mean the dividend story is over
CBA’s trailing dividend yield has compressed from the 3-4% range earlier in the period to approximately 2.8% at the current share price. This compression reflects the share price rising faster than the dividend, not a deterioration in the income stream.
In absolute terms, the dividend has grown. The FY2025 full-year payout was a record $4.85 per share, and the H1 FY2026 interim of $2.35 came in 4% above the prior-year interim. The H1 FY2026 payout ratio of approximately 72% of cash profit sits within the 70-80% range analysts consider sustainable, suggesting the income stream is not under pressure despite the elevated share price.
What analyst caution and CBA’s valuation tell long-term investors
CBA’s performance over the past two years has been exceptional. The analyst community’s view of the stock at current prices is considerably less enthusiastic.
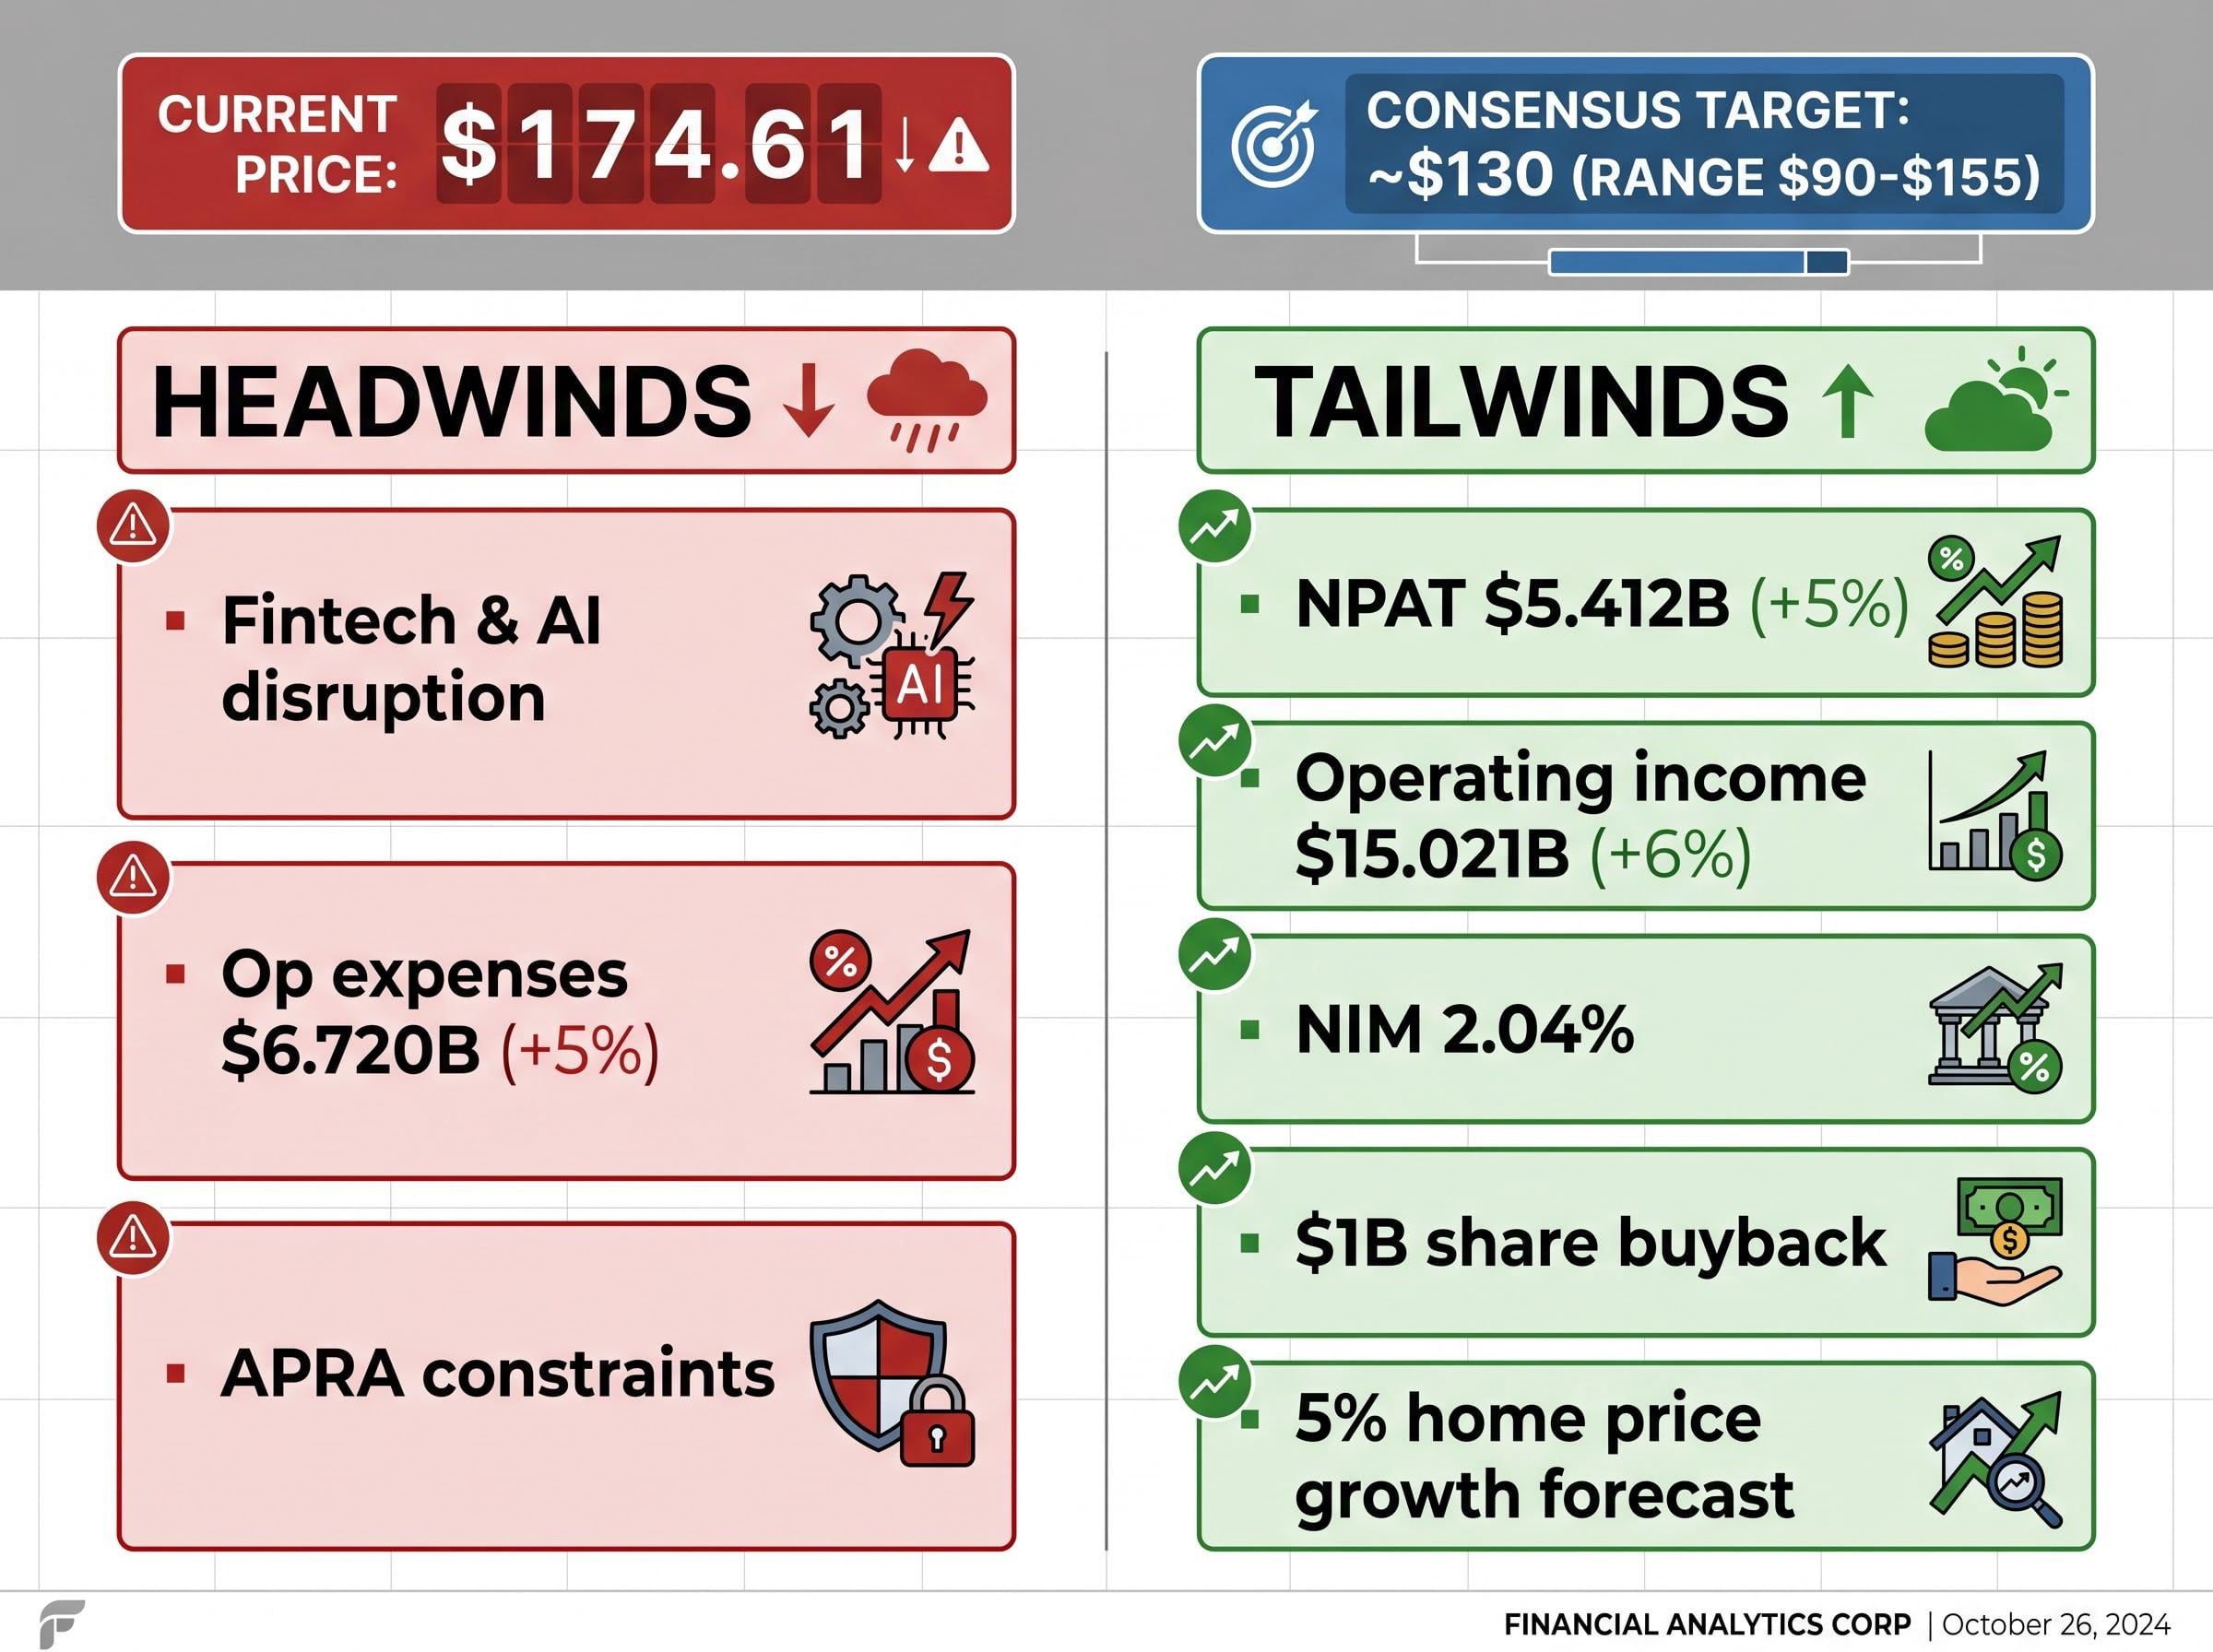
The 12-month consensus price target of approximately $130 sits well below CBA’s current price of approximately $174.61, with a range of $90-$155 across major brokers.
Many institutional analysts hold sell or underweight ratings on the stock. The gap between what the market is willing to pay and what analysts believe the earnings justify is one of the widest among ASX large caps.
CBA’s valuation premium over peers is the sharpest it has been in a decade: at roughly 27.7 times trailing earnings, the stock commands a premium of more than 55% over Westpac and approximately 60% over ANZ and NAB, a gap that broker models argue requires sustained earnings outperformance that low single-digit EPS growth projections do not currently support.
Understanding what this caution is actually flagging matters. There are two distinct risks at play:
Headwinds:
- Fintech competition in digital lending and payments
- AI-driven disruption across lending and risk assessment
- Underlying operating expenses up 5% year-on-year to $6.720 billion in H1 FY2026
- APRA capital requirements constraining deployment options
Tailwinds:
- H1 FY2026 statutory NPAT of $5.412 billion, up 5% year-on-year
- Operating income (cash basis) of $15.021 billion, up 6%
- Net interest margin of 2.04%
- Ongoing $1 billion share buyback extension
- CBA’s own forecast of approximately 5% home price growth
- Expected rate cuts supporting credit demand
The analyst caution is primarily a valuation call, not a business quality call. CBA’s earnings and dividend stream remain resilient. The concern is that the stock may be priced for perfection, leaving limited margin of safety if conditions soften.
The broader lesson CBA’s two-year run teaches about wealth-building
CBA’s estimated total return of approximately 72% against the S&P/ASX 20’s 22.5% price return challenges a common assumption: that meaningful market returns require speculative risk.
CBA achieved this as an established, fully valued bank. It did not discover a new product, enter a new market, or announce a transformative acquisition. It earned strong returns on equity, paid growing dividends with full franking credits, and held a dominant position in Australia’s largest consumer finance market. The income contribution of approximately $9.60 per share gross arrived without requiring any additional investor action beyond holding.
Several principles transfer beyond CBA specifically:
- Dividend reinvestment compounds share count progressively; the earlier an investor begins reinvesting, the more pronounced the compounding effect over multi-year holding periods.
- Fully franked dividends are worth materially more than their face value to superannuation investors, and this difference should factor into stock selection.
- Structural demand from ETFs and superannuation funds creates a durable bid for stocks like CBA that growth-oriented investors often overlook.
- Quality businesses with pricing power and reliable income streams can outperform the index over multi-year periods without requiring speculative positioning.
Investors wanting to place this two-year run in a longer historical frame will find our full explainer on CBA’s five-year total return paradox, which examines how the stock delivered more than 190% including dividends from mid-2020 while simultaneously accumulating a wall of sell ratings, and what that divergence means for position sizing decisions today.
S&P Global research on Australian dividend returns found that dividends and their reinvestment have accounted for more than half of the total return delivered by the S&P/ASX 300 since 2000, a finding that places CBA’s two-year income contribution firmly within the documented long-run pattern for Australian equities.
CBA’s run makes the case for income investing, but context still matters
CBA at approximately $174.61 presents different risk-return characteristics than CBA at $114.54 two years ago. The trailing yield has compressed to approximately 2.8%, and the analyst consensus target of approximately $130 serves as a reminder that the market is pricing in expectations the analyst community considers stretched.
Past performance does not predict future returns. Investors entering now should size expectations to the current yield and valuation, not the returns available to those who entered at a lower base.
The structural lessons, that dividend reinvestment and franking credits are return enhancers available on any quality fully franked stock, are durable investing principles. They are not a CBA-specific outcome.
CBA’s H1 FY2026 results show an earnings base capable of sustaining its dividend, with a payout ratio of approximately 72% of cash profit sitting comfortably within the 70-80% sustainable range. The income stream is intact. The question for prospective holders is whether the current price adequately compensates for the risks analysts have identified, or whether the structural advantages that generated the past two years of outperformance remain mispriced by a cautious consensus.
This article is for informational purposes only and should not be considered financial advice. Investors should conduct their own research and consult with financial professionals before making investment decisions. Past performance does not guarantee future results.