
How the US Government Became Intel’s Investor and Deal Broker
1 hr ago
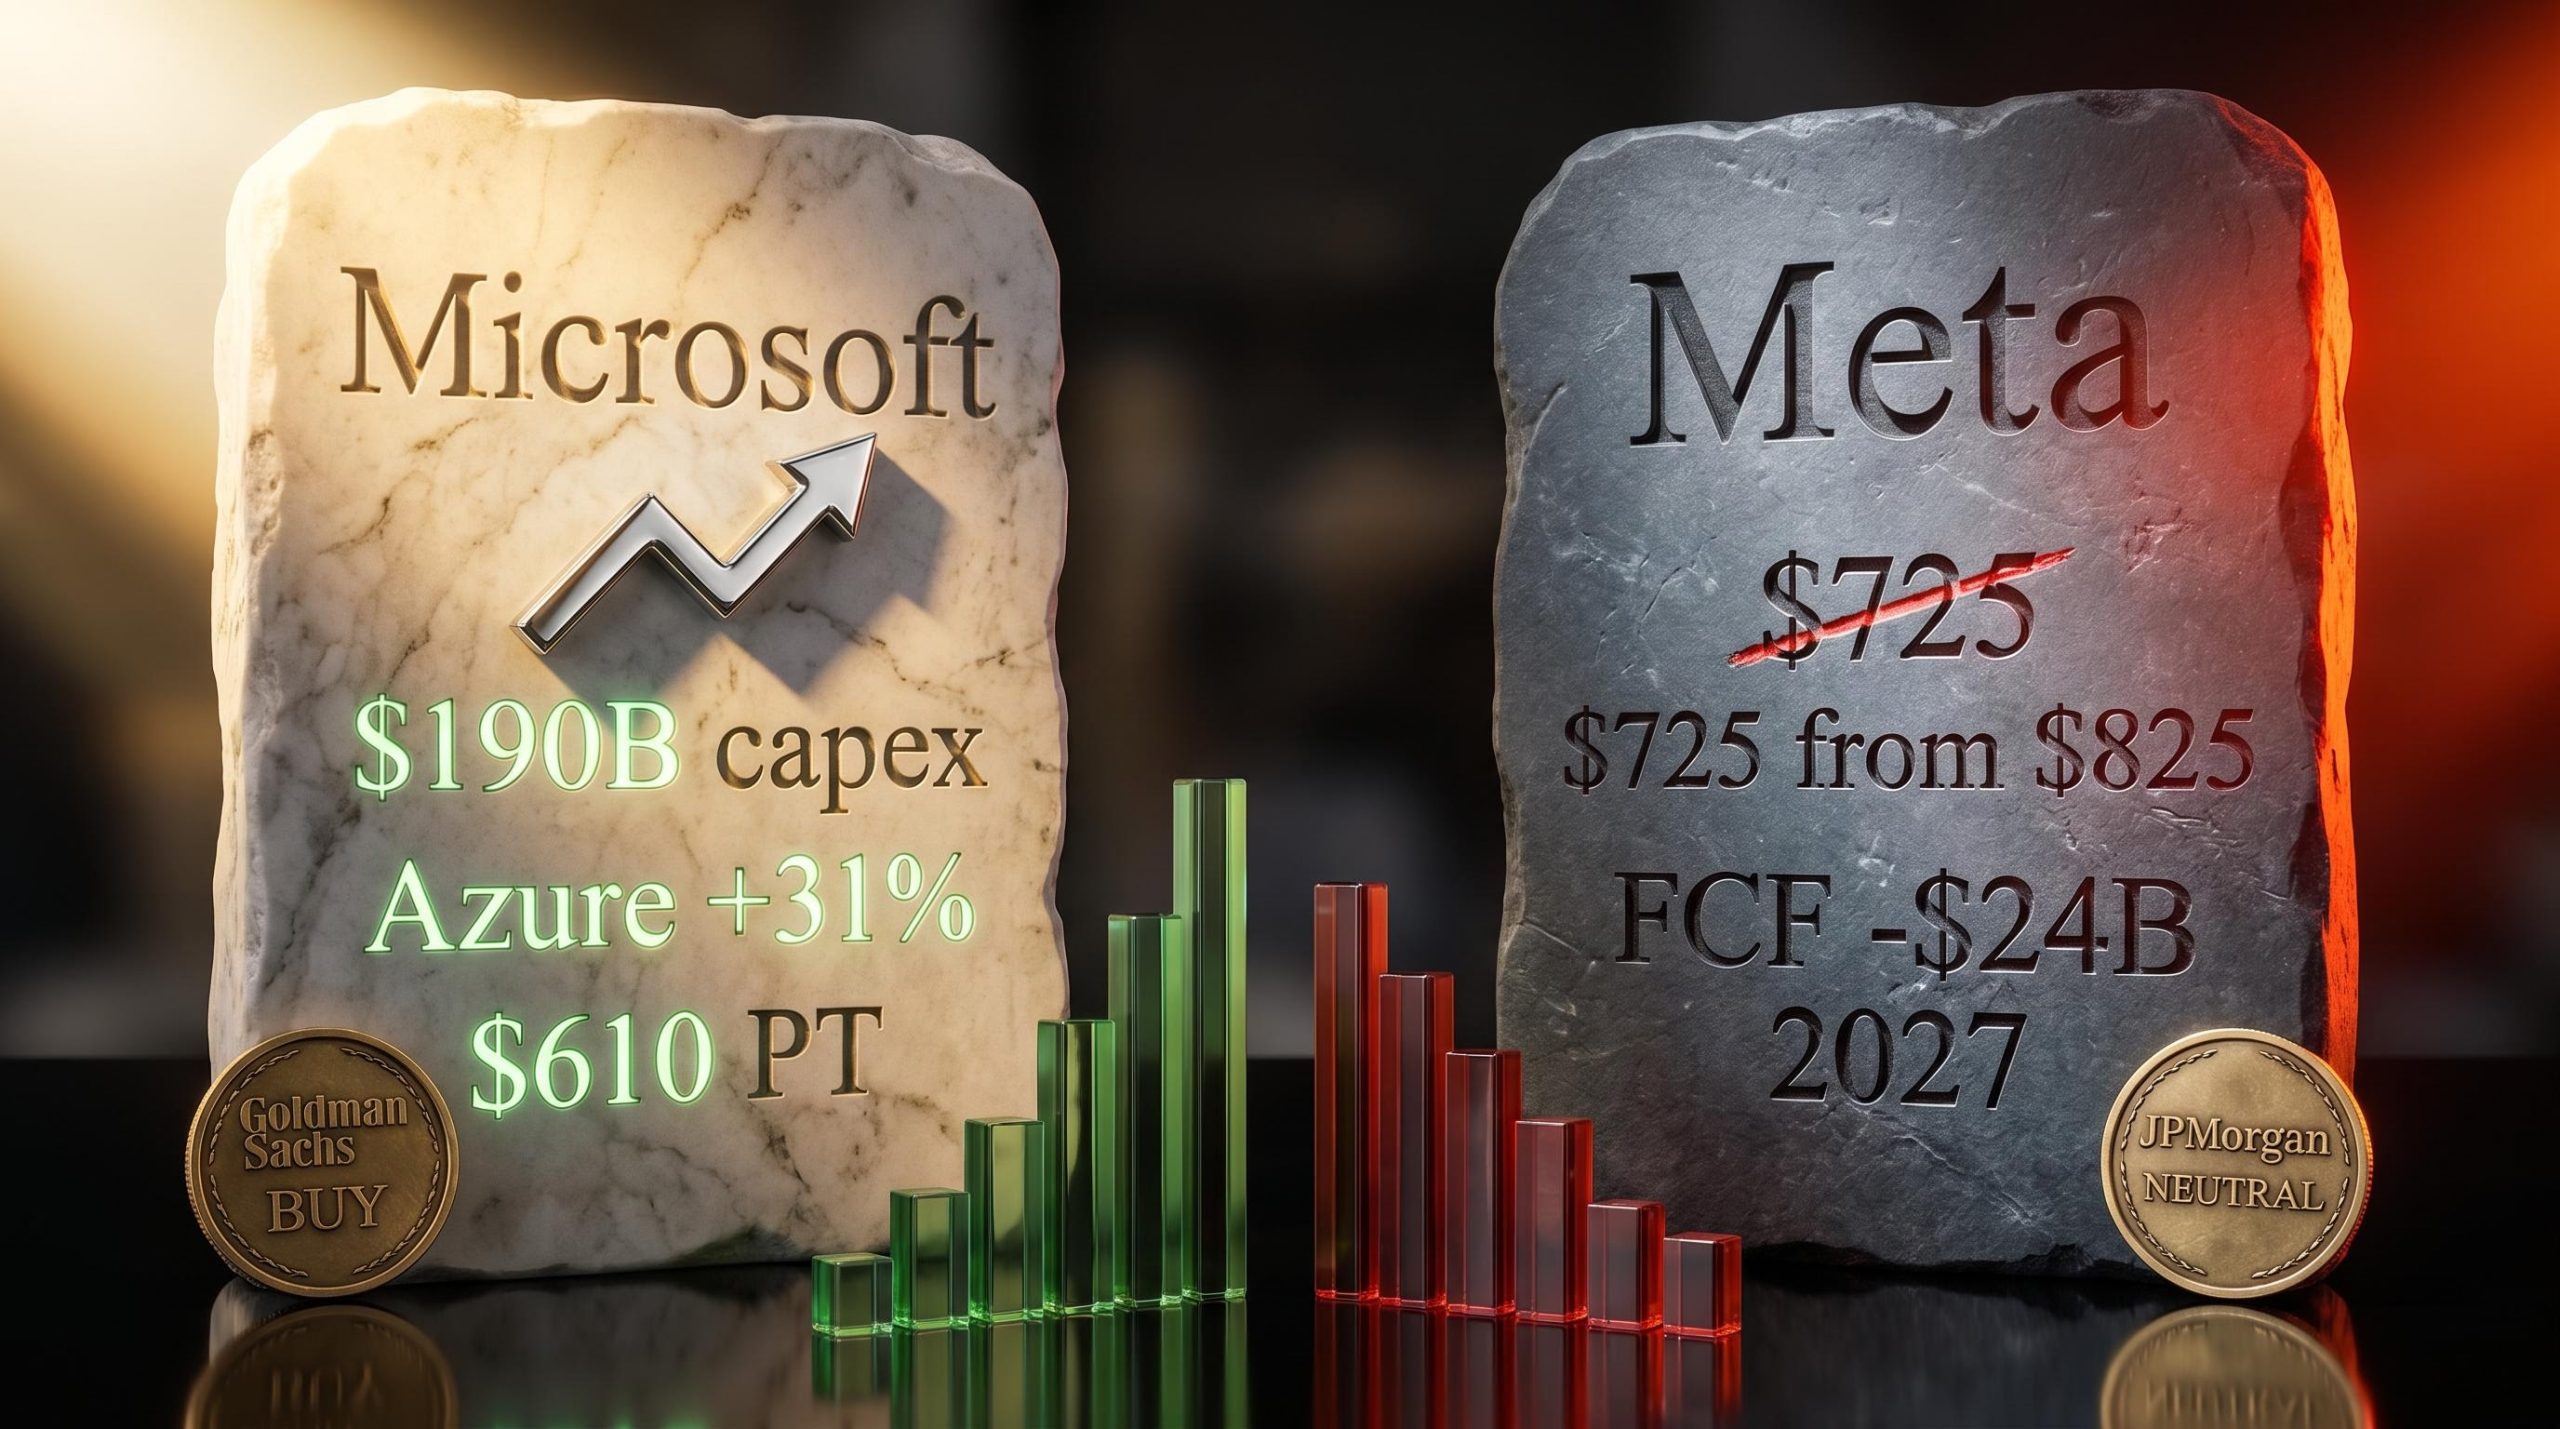
Microsoft guided for approximately $190 billion in capital expenditure for calendar year 2026, roughly 45% above what Wall Street had been modelling. Goldman Sachs called it an inflection point. JPMorgan looked at Meta’s comparable spending trajectory and downgraded the stock.
The same macro force, massive AI infrastructure investment, is producing sharply different analyst verdicts depending on which company is writing the cheques. As of early May 2026, hyperscaler capex has become the single most contested line item in large-cap tech analysis. Q1 2025 earnings results pulled the consensus accretion timeline forward for some names while leaving others in a holding pattern. What separates a credible AI spending story from a concerning one in analysts’ current frameworks comes down to a handful of specific, trackable metrics. This analysis uses Microsoft and Meta as live contrasting cases and identifies the variables retail investors should monitor when evaluating whether a company’s AI investment thesis is on track.
Two companies are spending aggressively on AI infrastructure. One received a reiterated Buy rating. The other was downgraded.
Goldman Sachs maintained its Buy on Microsoft with a $610 price target after Q1 2025 results. Analyst Gabriela Borges characterised the quarter as a potential inflection point for the Azure AI thesis.
Goldman Sachs analyst Gabriela Borges described Microsoft’s Q1 2025 quarter as a potential “inflection point” for the Azure AI revenue trajectory, maintaining a Buy rating with a $610 price target.
JPMorgan moved in the opposite direction on Meta, cutting its price target from $825 to $725 and shifting to Neutral from Overweight. Analyst Doug Anmuth projected negative free cash flow of approximately $4 billion in 2026 and negative $24 billion in 2027 under his model.
The divergence is not about spending level alone. Microsoft’s $190 billion 2026 capex projection (versus the Street’s prior $82 billion estimate) drew confidence. Meta’s 2026 capex guidance of $125 billion to $145 billion, raised by $10 billion, drew scrutiny. The difference lies in what the spending is anchored to.
The AI infrastructure investment cycle has compressed the analytical window that banks typically apply to large capex programmes: Wall Street is now demanding concrete monetisation evidence within a 12-month horizon rather than the multi-year grace period traditionally extended to platform build-outs, a shift that directly explains why the same revenue growth rate is read differently depending on the transparency of the spending rationale.
| Metric | Microsoft | Meta |
|---|---|---|
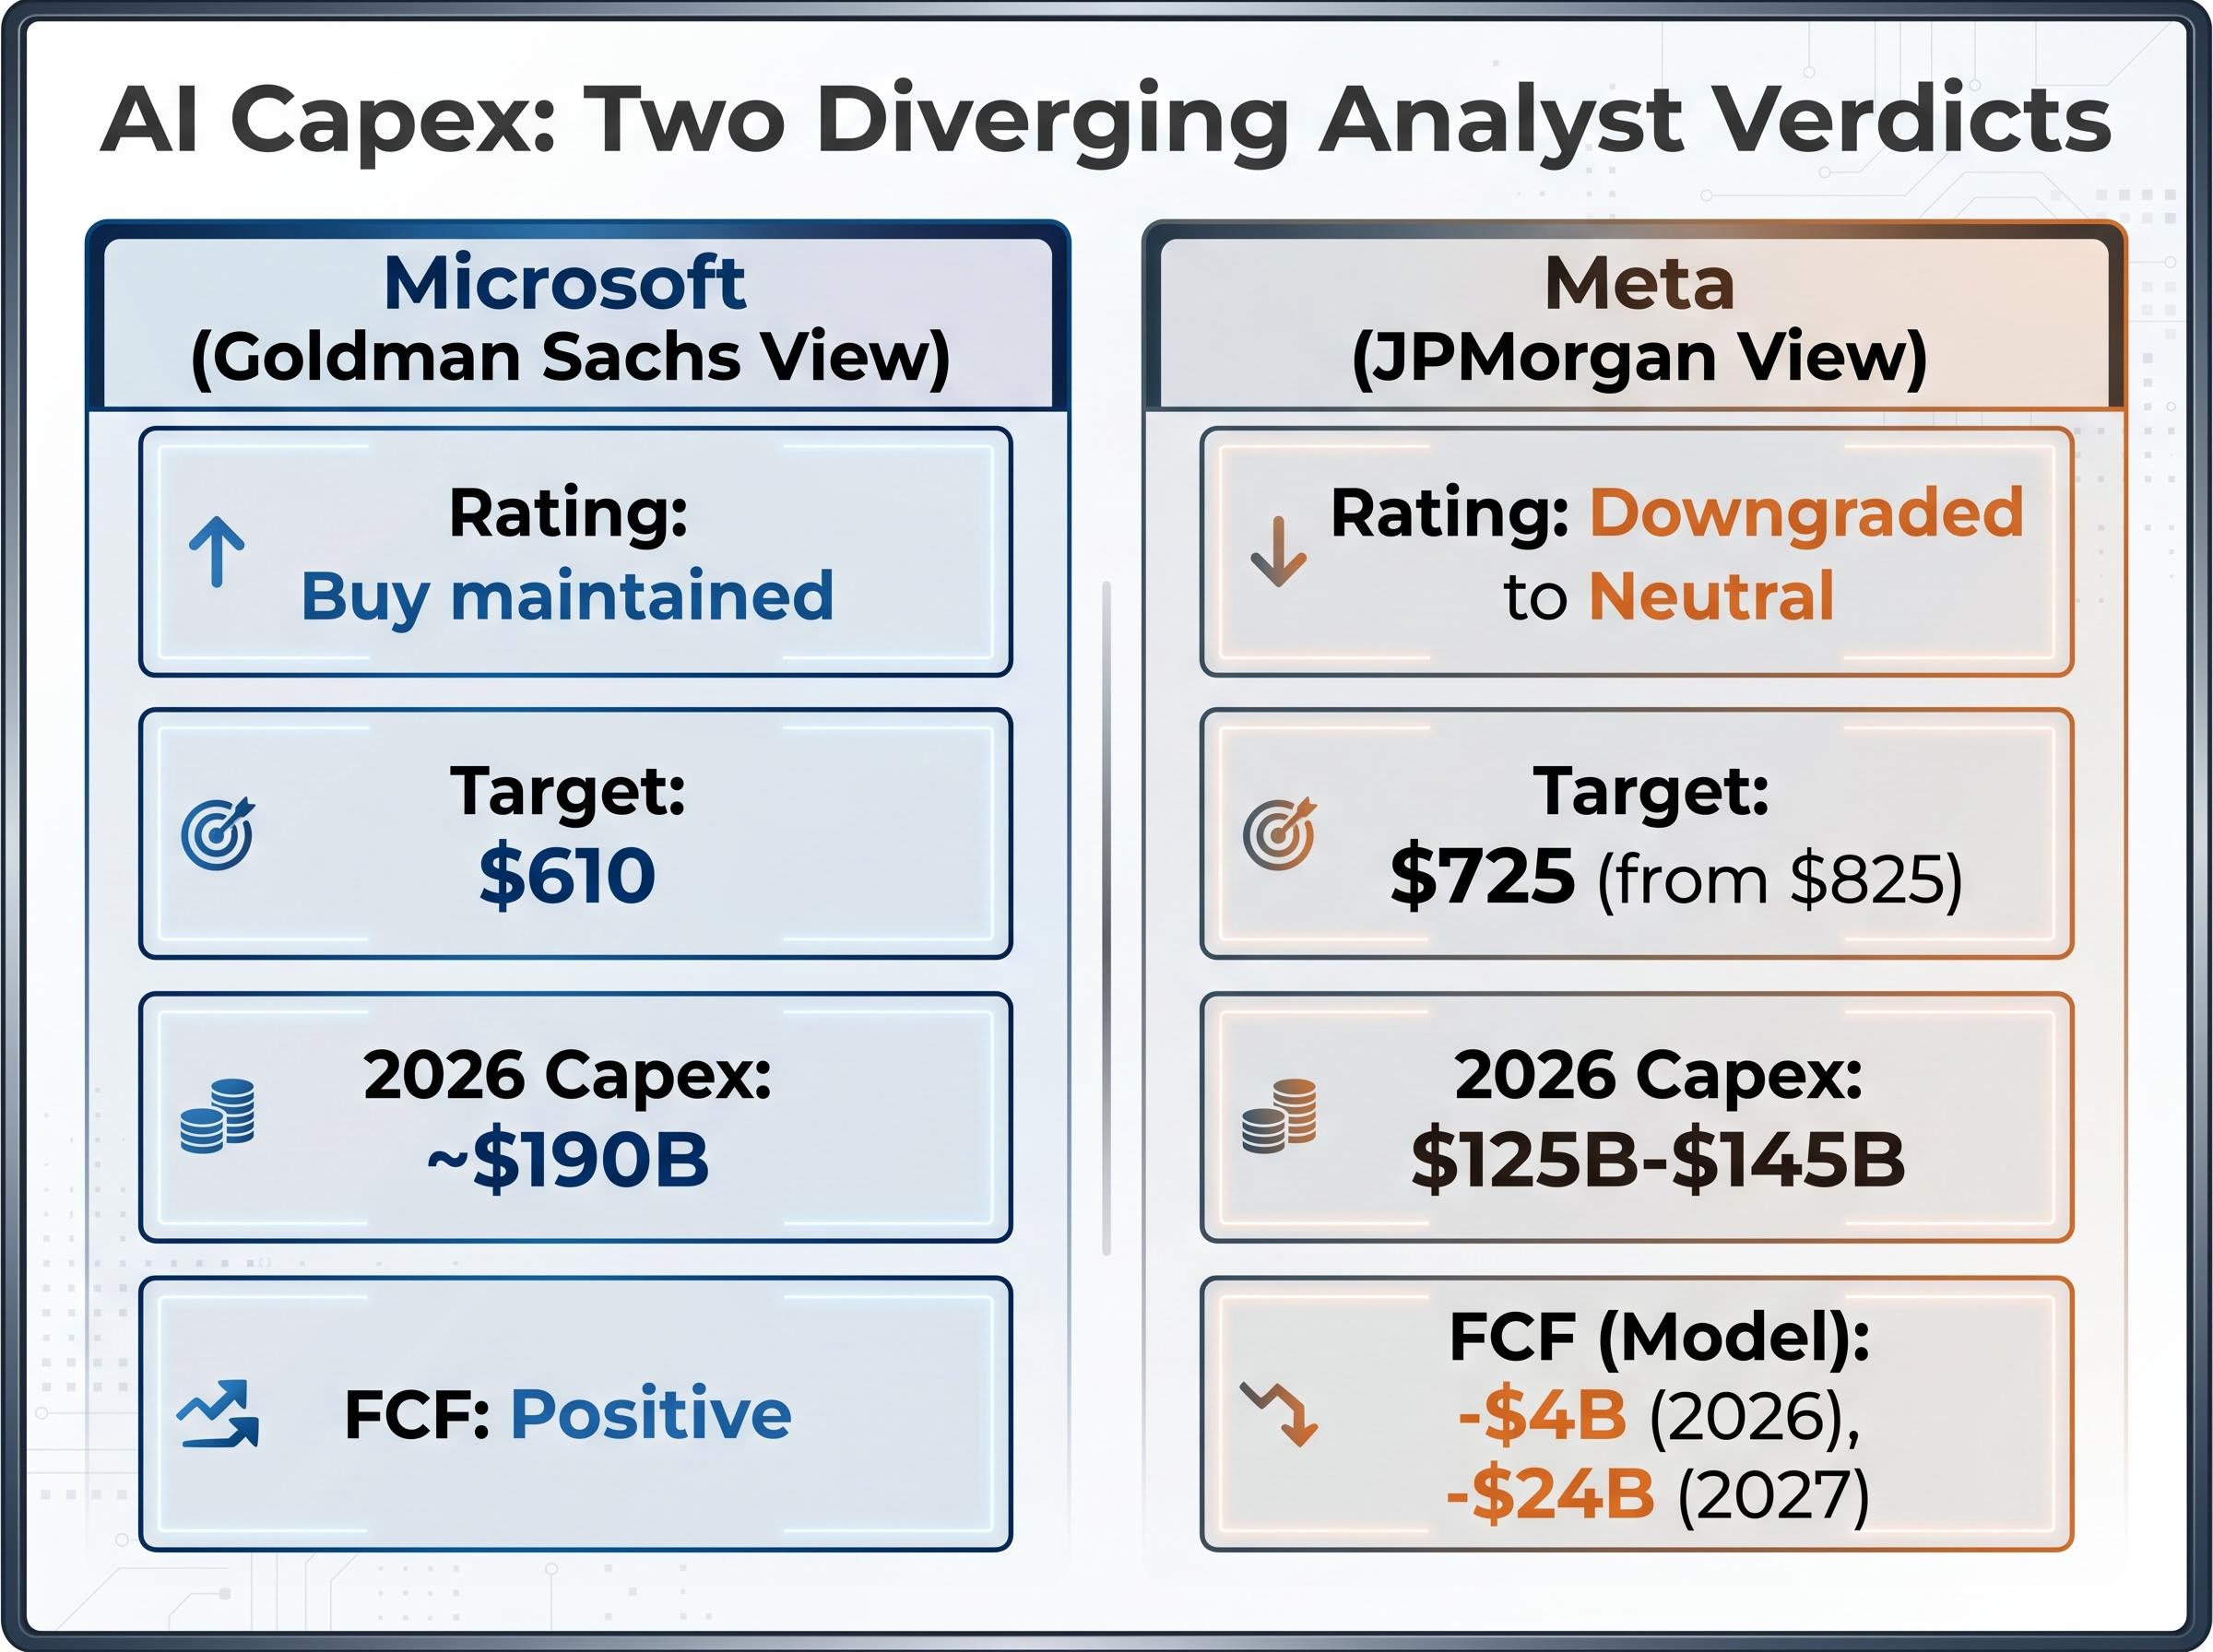
| Rating change | Buy maintained (Goldman Sachs) | Downgraded to Neutral (JPMorgan) |
| Price target | $610 | $725 (from $825) |
| 2026 capex projection | ~$190B | $125B-$145B |
| FCF outlook | Positive; accretion visible | -$4B (2026), -$24B (2027) per JPMorgan model |
For investors holding either name, understanding why two major firms reached opposite conclusions from similar inputs is the first step to building an independent analytical framework. This divergence reflects a genuine methodological split, not routine disagreement over margin assumptions.
The bull case for Microsoft is not optimism. It is a chain of observable metrics connecting capex to revenue to operational efficiency.
Microsoft’s FY25 Q3 results came in ahead of expectations across every major line item:
Goldman noted that management guided for first-half fiscal 2027 acceleration in Azure, a signal that the revenue runway extends beyond the current quarter’s beat.
The operational efficiency disclosures carried disproportionate weight with analysts. Microsoft reported GPU efficiency improvements of approximately 67% for transcription tasks and up to 260% for image generation.
This type of internal efficiency disclosure is relatively rare among hyperscalers. Analysts treated it as a credibility signal: the infrastructure spending is producing measurable operational leverage, not simply expanding hardware footprint and headcount. For Goldman, the combination of revenue beats and efficiency gains validated the capex trajectory more convincingly than revenue growth alone could have done.
Meta’s revenue growth is not the problem. Q1 2025 revenue grew approximately 33% year over year; a figure most companies would celebrate. The difficulty lies in connecting the infrastructure spending to a monetisation pathway with the specificity investors require.
JPMorgan’s concern centres on opacity, not magnitude. The firm’s model projects 2027 capex of approximately $202 billion, a 42% increase over 2026 levels. Under those assumptions, the FCF trajectory turns sharply negative: $4 billion negative in 2026 and $24 billion negative in 2027.
A qualification matters here. Meta’s actual FY2025 free cash flow came in positive at approximately $43 billion. The most severe bear-case projections have not yet materialised. Whether they do depends on whether capex acceleration outpaces the revenue contribution from AI-driven advertising improvements.
Meta’s post-earnings selloff illustrates the mechanism precisely: a 33% revenue growth quarter and a 41% operating margin were not enough to offset a capex guidance revision that repriced the present value of future free cash flows, sending the stock down roughly 9% in extended trading despite the underlying business performing ahead of expectations.
JPMorgan characterised Meta’s monetisation pathway as more difficult to articulate to investors than enterprise-integrated peers like Google and Amazon, where cloud contract structures provide more visible revenue attribution.
JPMorgan cited several specific risk factors:
Bernstein offered a counter-argument worth weighing. The firm noted that Meta’s ownership of the Llama model provides efficiency gains and operating expense savings that partially offset headline capex figures. The investment is not purely hardware; model ownership creates structural advantages that do not appear on the capex line.
Understanding the bear case in full, including where it may overstate the risk, gives investors a more complete picture than either the downgrade or the rebuttal alone.
The Microsoft and Meta case studies reflect a broader analytical architecture that the major banks have formalised into explicit evaluation frameworks. Investors who internalise these criteria will be better equipped to evaluate new earnings reports and guidance updates independently, rather than waiting for analyst actions.
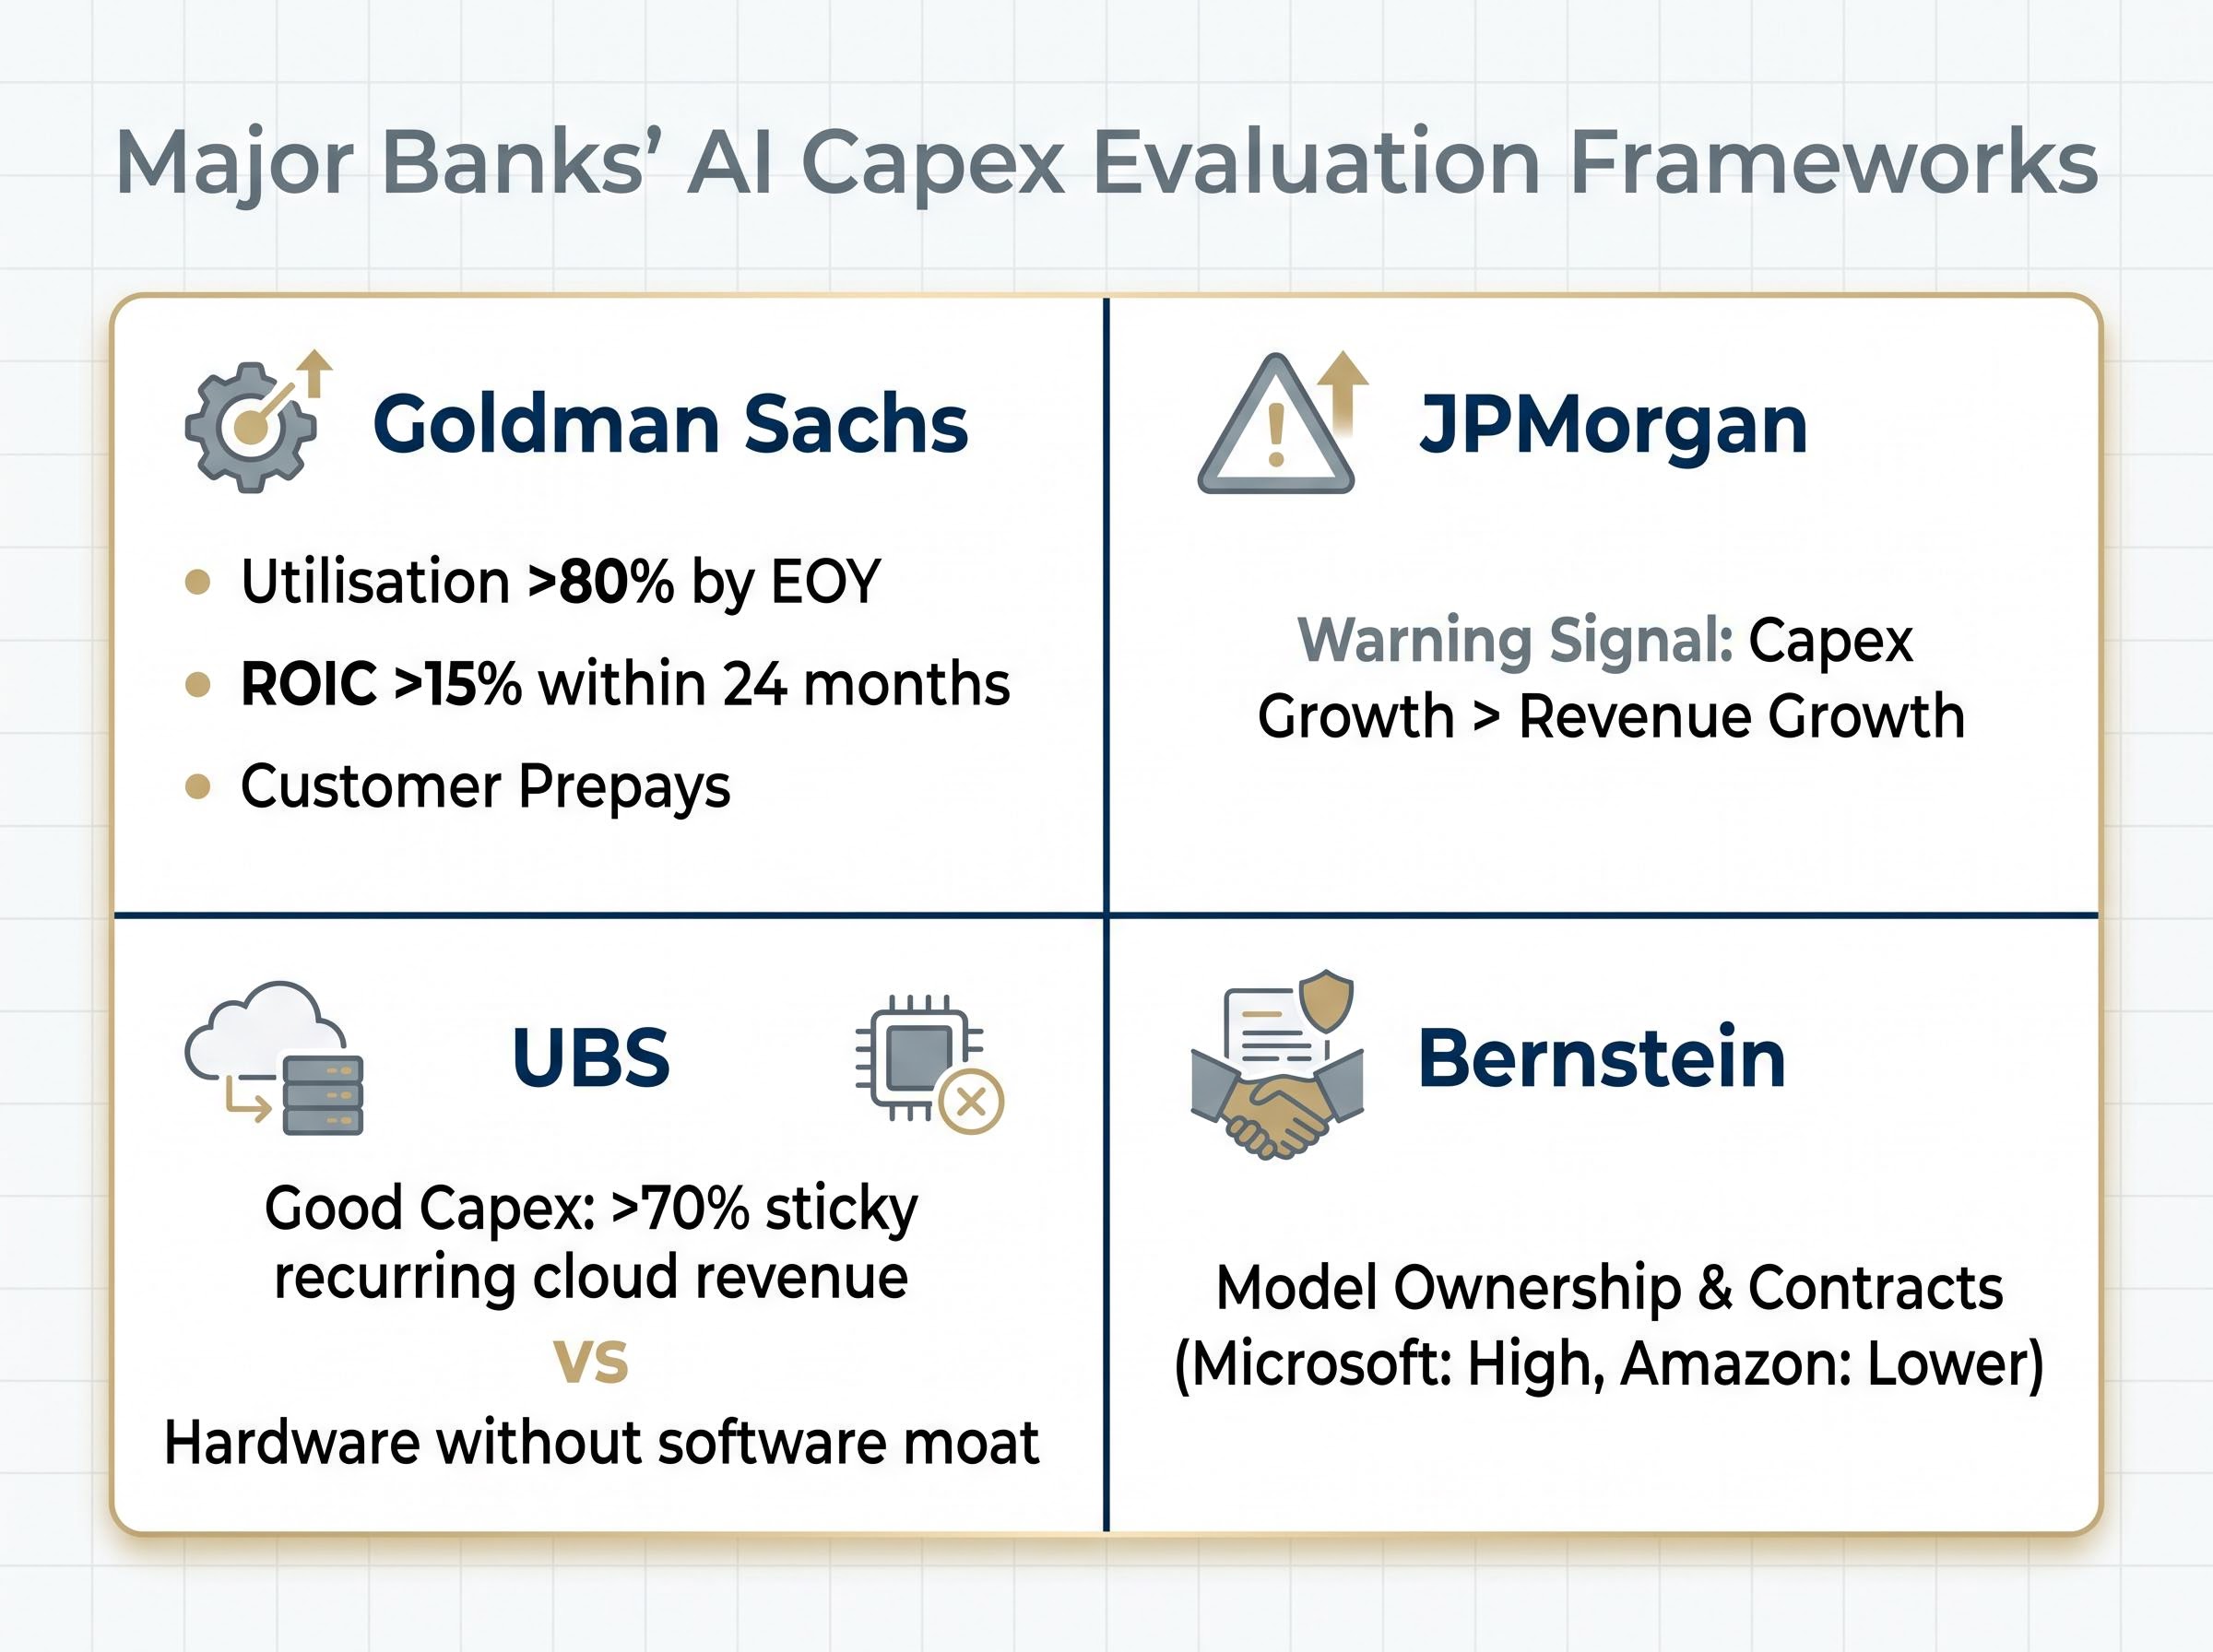
Goldman Sachs applies three primary credibility tests: utilisation above 80% by the end of the deployment year, return on invested capital above 15% achievable within 24 months, and demand-led spending with customer prepays covering a meaningful share of capex.
JPMorgan watches a simpler warning signal: capex growth materially exceeding revenue growth rate. When infrastructure investment grows faster than the revenue it is meant to generate, the burden of proof shifts to management.
Operating cash flow absorption tells a parallel story to the FCF trajectory: hyperscaler infrastructure expenditures are projected to expand from 50% of operating cash flow in 2024 to 90% by 2027, a compression that creates the structural pressure behind JPMorgan’s capex-versus-revenue-growth warning signal even for companies whose absolute revenue numbers remain strong.
UBS distinguishes between “good capex” tied to sticky recurring cloud revenue (above 70% of the revenue base) and hardware investment without a demonstrated software moat to monetise the infrastructure.
Gartner IT spending forecasts published in April 2026 identified data center systems as the single fastest-growing category in global technology budgets, with AI-related investment projected to approach half of total IT spend by 2027, a trajectory that directly shapes the utilisation and ROI assumptions built into analyst frameworks for the hyperscaler group.
Bernstein weights model ownership (open versus proprietary) and multi-year customer contract structures, with Microsoft scoring highly and Amazon scoring lower on the model ownership dimension.
Across all major frameworks, one variable recurs: the utilisation rate. Installations running below 70-80% utilisation push return on investment breakeven materially further out, regardless of revenue growth at the platform level. Fixed infrastructure costs continue accruing while the revenue ramp is delayed.
This is why utilisation disclosures in earnings calls carry disproportionate analytical weight. A single data point on GPU utilisation can shift the ROI timeline by quarters.
| Parameter | Bull case | Bear case |
|---|---|---|
| Utilisation by EOY deployment | >80% | <70% |
| Capex/revenue ratio | Declining post-2026 | Sustained or rising |
| FCF breakeven timeline | <18 months post-deployment | 3+ years |
| Revenue attribution from AI | >20% of incremental revenue | <10%, hard to isolate |
| Customer contract structure | Prepay/committed | Consumption-based, reversible |
Before Q1 2025 earnings, the consensus view held that meaningful EPS accretion from AI infrastructure was not expected until 2027 for most hyperscalers. That anchor has since shifted, but not uniformly.
Aggregate 2025 hyperscaler capex was estimated in the $427 billion to $725 billion range across analyst frameworks, depending on which companies are included and how infrastructure-adjacent spend is categorised.
Financial Times hyperscaler capex reporting covering the 2026 spending cycle placed the aggregate figure for Google, Amazon, Meta, and Microsoft at $725 billion, the upper bound of the range that analyst frameworks have been working with when calibrating accretion timelines across the group.
The timeline shift is directly relevant to positioning decisions. Investors anchored to the old 2027 consensus may be underweighting names where accretion is already appearing in results, or overweighting names where the timeline remains genuinely uncertain.
The analytical framework outlined above converts into five specific monitoring tasks for the next hyperscaler earnings cycle.
Retail investors rarely have access to broker research in real time, but they do have access to earnings transcripts and guidance. Knowing which numbers to track converts a passive news consumer into an active evaluator of the thesis.
The Microsoft and Meta divergence is not arbitrary. It reflects genuine analytical differentiation built on specific, identifiable criteria: utilisation rates, demand-led spending structures, and revenue attribution transparency.
Three framework variables do the most work in separating credible from concerning AI spend. Utilisation above 80% validates infrastructure deployment. Prepaid or committed customer contracts reduce monetisation uncertainty. And transparent revenue attribution, where a company can demonstrate which dollars came from AI workloads, provides the clearest path to re-rating.
The next two earnings cycles will be the most informative period yet for validating or disconfirming the 2026 accretion timeline. Rather than treating the analyst disagreement as a reason for indecision, investors may find it more useful as a map of exactly what to watch.
Investors wanting to stress-test the portfolio implications of this analytical uncertainty will find our deep-dive into AI capex concentration risk, which examines the record 13% semiconductor share of US equity market capitalisation, historical parallels to dot-com era concentration, and specific portfolio construction approaches for managing sector-specific correction exposure.
This article is for informational purposes only and should not be considered financial advice. Investors should conduct their own research and consult with financial professionals before making investment decisions. Past performance does not guarantee future results. Financial projections are subject to market conditions and various risk factors.
AI capex analysis is the process of evaluating whether a company's capital expenditure on artificial intelligence infrastructure is credibly linked to future revenue and free cash flow. It matters because the same level of spending can result in a Buy rating or a downgrade depending on whether analysts can see a clear monetisation pathway.
Goldman Sachs maintained a Buy on Microsoft because Azure revenue beats, GPU efficiency improvements, and demand-led spending provided a measurable link between capex and returns. JPMorgan downgraded Meta because its monetisation pathway was harder to articulate and its free cash flow was projected to turn sharply negative in 2026 and 2027 under elevated capex assumptions.
Major bank frameworks, including Goldman Sachs and UBS, treat utilisation above 80% by end of the deployment year as the bull-case threshold, while installations running below 70% are considered a warning signal that pushes return on investment breakeven materially further out.
Investors should monitor Azure constant currency growth rate, GPU utilisation and efficiency disclosures, Meta's quarterly free cash flow direction, Copilot seat growth acceleration, and the gap between capex growth rate and revenue growth rate, as these are the specific metrics analysts use to validate or challenge the AI investment thesis.
Yes, Goldman Sachs and Morgan Stanley pulled their primary accretion scenario forward to H2 2026 for Microsoft and Alphabet after Q1 2025 earnings, forecasting 5-7% EPS uplift as Azure and Google Cloud Platform AI margins approached 25%, compared to the prior consensus which placed meaningful accretion no earlier than 2027.


