UAE Leaves OPEC, Cutting the Cartel’s Global Share to 26%
6 hrs ago

Westpac’s FY25 full-year dividend of $1.53 per share translates to a trailing yield of 3.98% at the current share price of $38.43, a materially better entry point than the highs above $41 that WBC.AX touched in 2025. For income investors, the question is not whether the yield looks acceptable today, but whether the dividend trajectory through FY27 and FY28 justifies a long-term position.
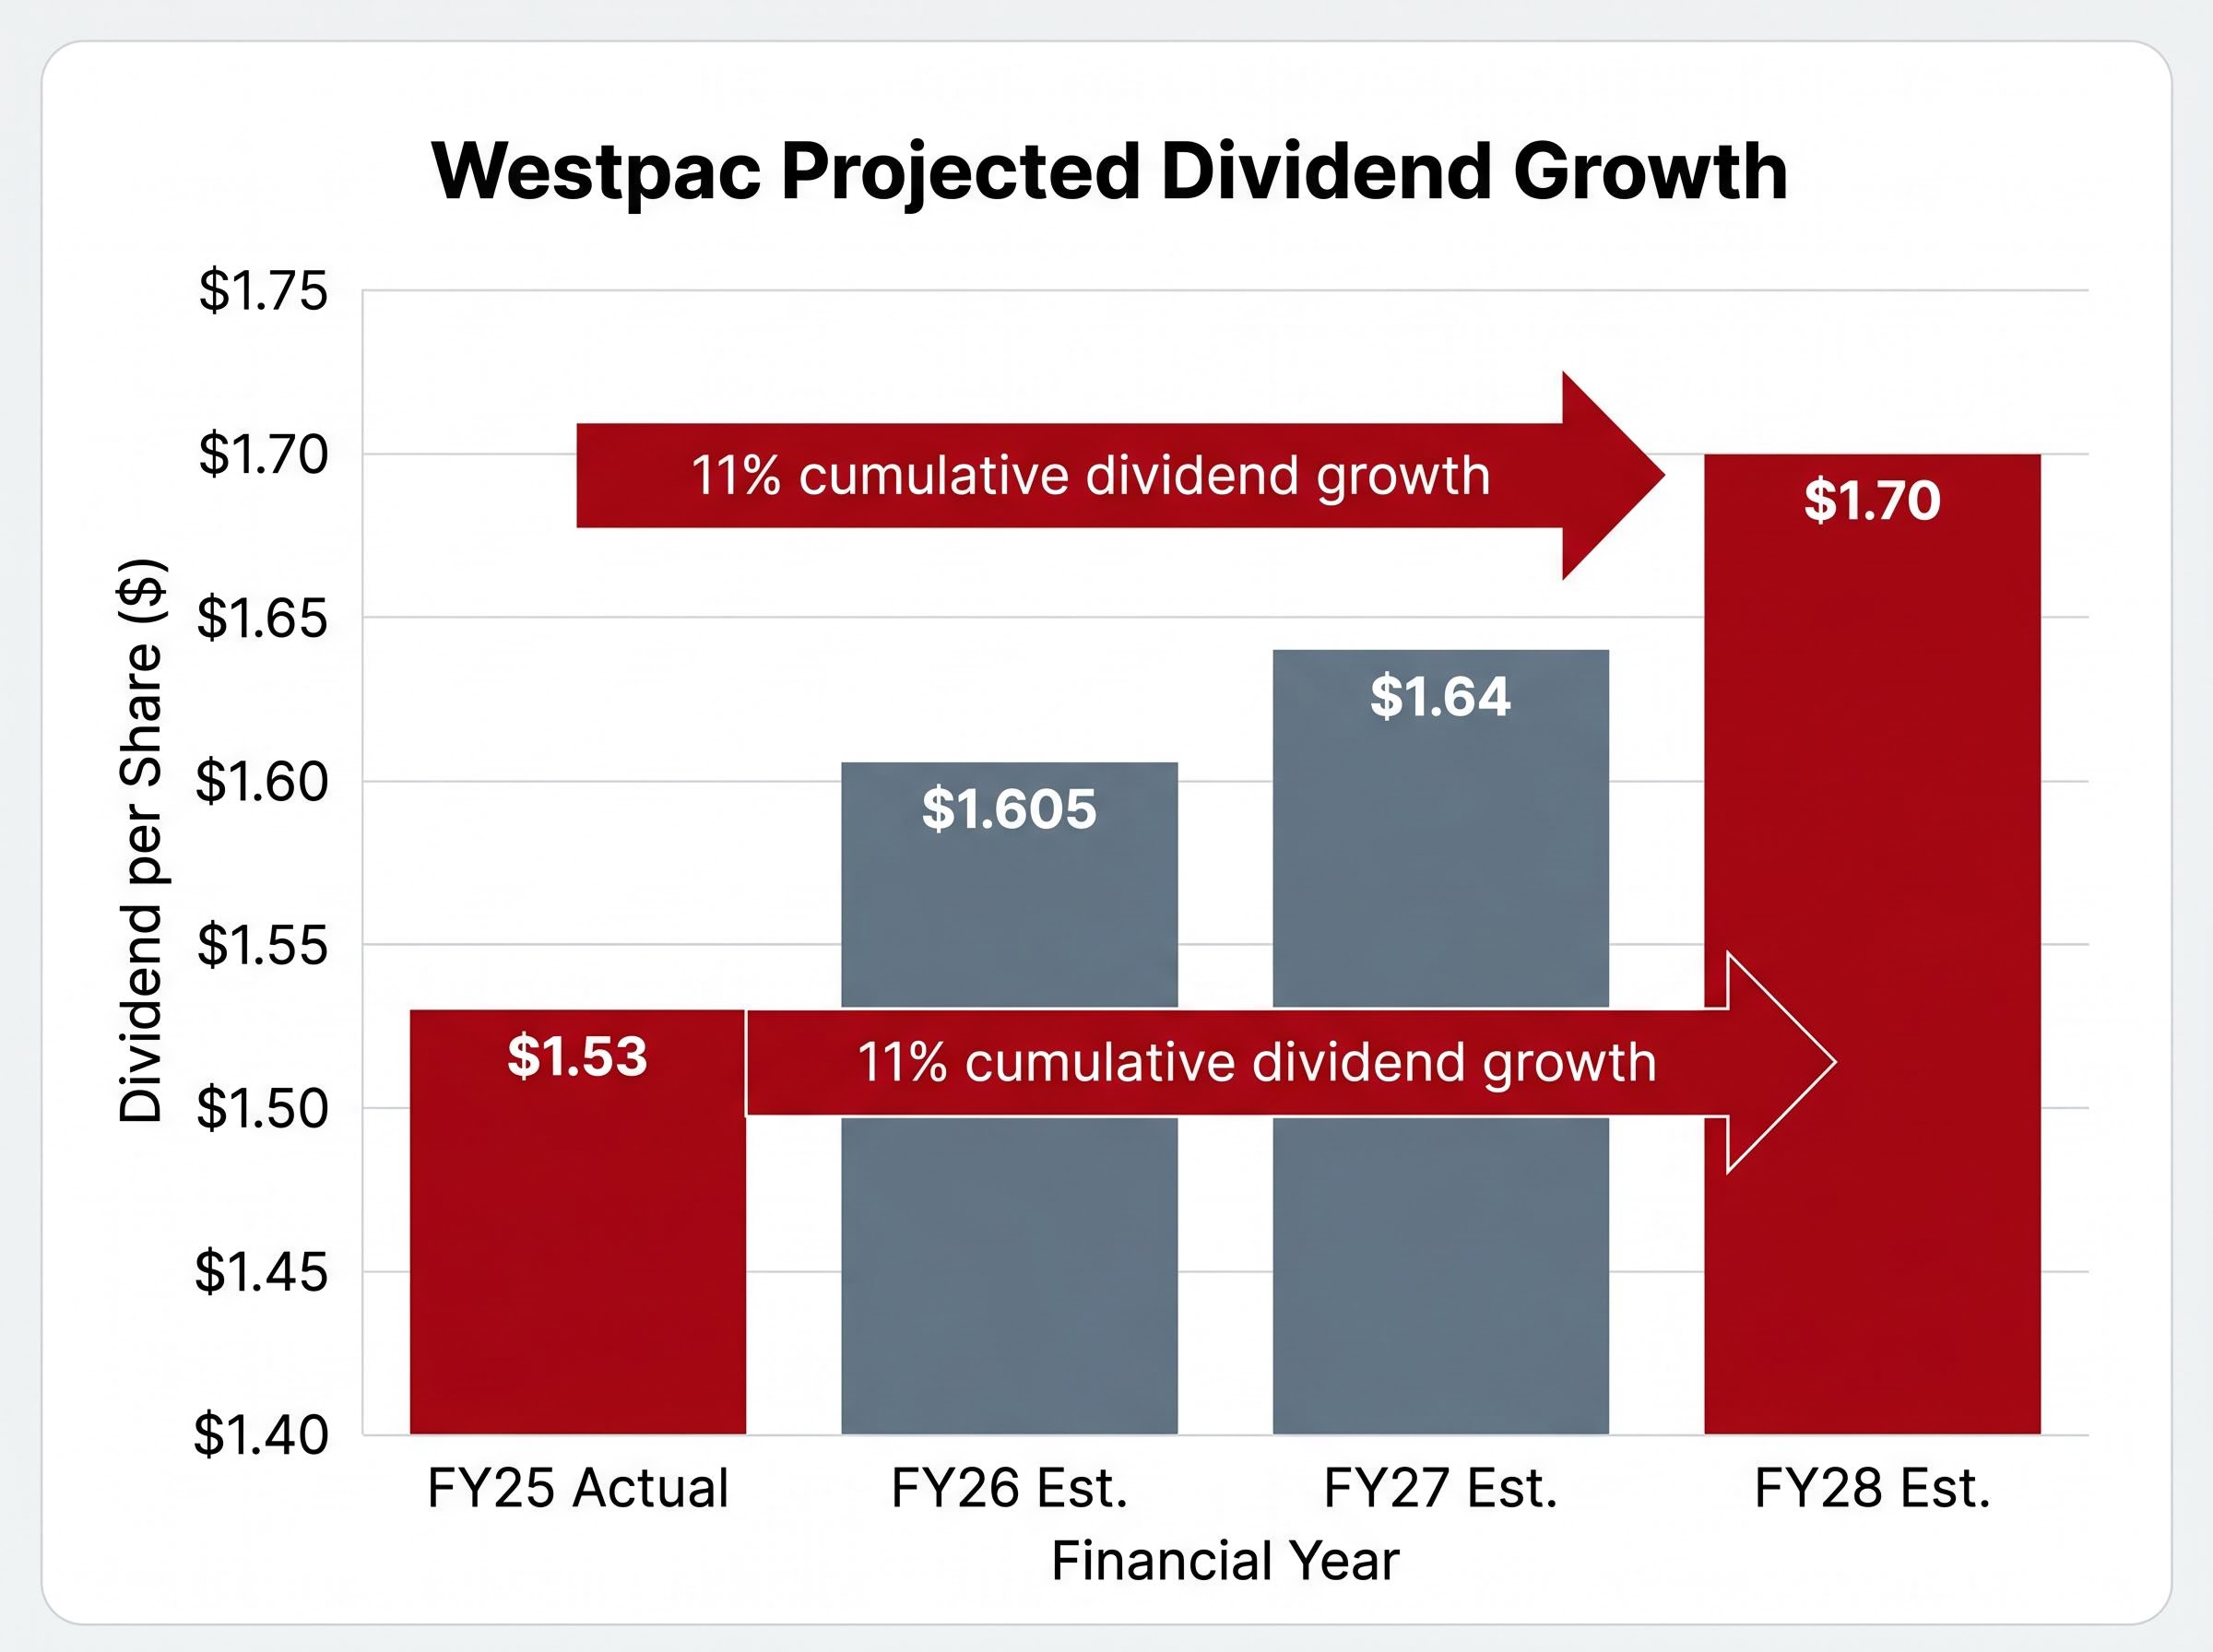
Analyst projections point to $1.605 per share in FY26, $1.64 in FY27, and $1.70 in FY28. These numbers sit inside a fast-moving environment: RBA rate decisions expected through mid-2026, an ongoing technology transformation programme with rising costs, and one of the most competitive mortgage markets in the bank’s recent history. The FY26 half-year results due on 5 May 2026 will provide the first formal read on whether Westpac’s current trajectory supports or complicates those forecasts.
What follows works through each layer of that question systematically, giving income-focused investors a structured framework for evaluating Westpac’s dividend reliability through to FY28, including what to watch, what could go wrong, and how franking credits change the effective return calculation.
The income picture starts with confirmed numbers. Westpac closed at $38.43 on 30 April 2026, and its FY25 full-year dividend of $1.53 per share produces a trailing yield of 3.98%. The bank pays dividends semi-annually (interim plus final), and the FY26 interim dividend is expected at approximately $0.82, pending confirmation at the half-year results announcement on 5 May 2026.
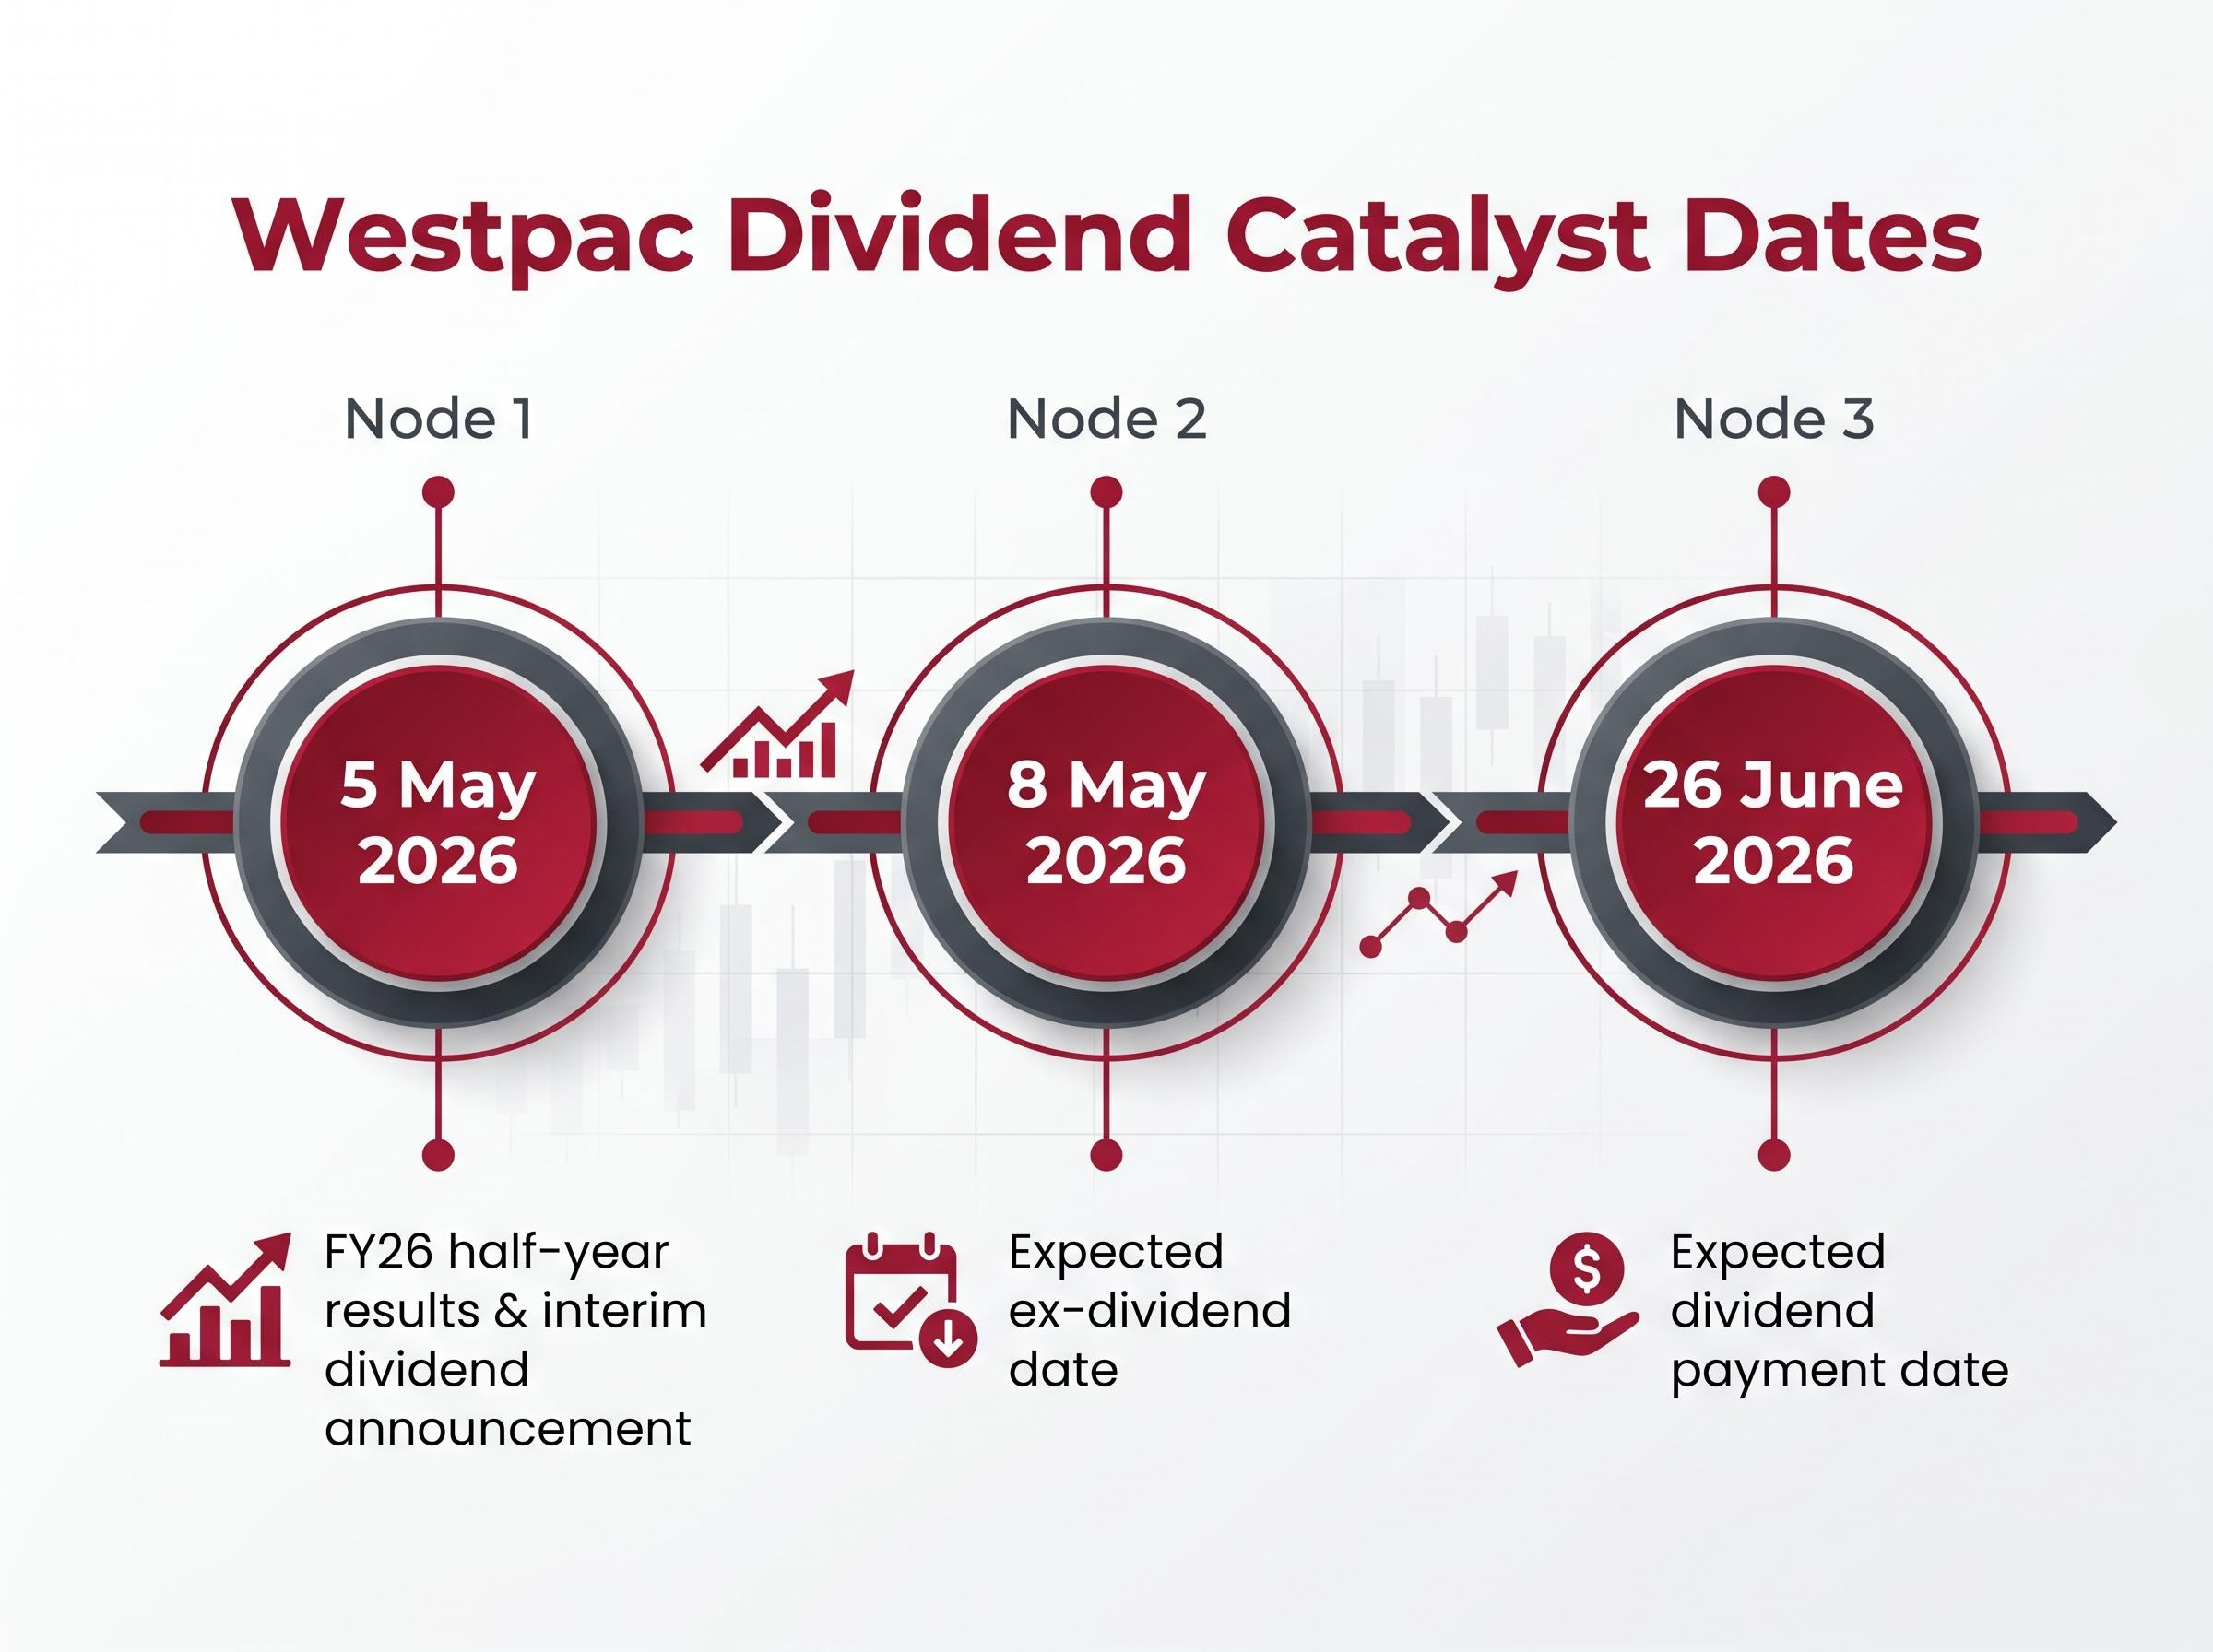
Three dates matter in the near term:
That 3.98% headline yield, however, materially understates the return for a large segment of the Australian investor base. Westpac dividends are fully franked, meaning the 30% corporate tax already paid by the bank flows to eligible shareholders as a franking credit.
For eligible Australian investors, Westpac’s fully franked dividends translate to a grossed-up yield in the range of 4.1% to 6%, depending on individual tax circumstances.
For self-managed super fund (SMSF) trustees in pension phase, the effective return sits at the upper end of that range. The 5 May announcement is the single most important near-term catalyst for confirming whether FY26 is tracking to plan.
The FY26 consensus from late 2025 clusters in the $1.55-$1.58 per share range, based on estimates compiled by CommSec and DivvyDiary. CMC Invest’s projection sits higher at $1.605, a figure that should be weighed with the understanding that it exceeds the broader consensus.
Looking further out, CMC Invest projects $1.64 for FY27 and $1.70 for FY28. At the current share price of $38.43, these translate into a rising forward yield profile.
| Financial Year | Projected Dividend (per share) | Forward Yield at $38.43 | Grossed-Up Yield (est.) |
|---|---|---|---|
| FY25 (actual) | $1.53 | 3.98% | ~5.7% |
| FY26 (CMC Invest) | $1.605 | ~4.18% | ~5.97% |
| FY27 (CMC Invest) | $1.64 | ~4.27% | ~6.1% |
| FY28 (CMC Invest) | $1.70 | ~4.43% | ~5.7% |
The trajectory from $1.53 to a projected $1.70 represents approximately 11% cumulative dividend growth across three years. That is modest but consistent, and meaningful when layered on top of franking credit returns. Supporting the near-term picture, Westpac’s Q1 FY26 quarterly profit came in at $1.9 billion, reflecting 5%-6% growth compared to the second-half FY25 average.
Westpac’s Q1 FY26 operating performance, including $22 billion in lending growth and $12 billion in deposit inflows during the quarter, provides the most recent evidence that core franchise momentum has continued into the current financial year, even as the share price has given up its gains since the start of 2026.
There is a material distinction between the FY26 consensus range (compiled from multiple broker estimates) and the FY27-FY28 figures, which rely on a single source. No independently verified FY27 or FY28 forecasts from institutional brokers such as Morgan Stanley, UBS, Macquarie, or Citi were publicly available at the time of writing.
The 5 May 2026 half-year results will be the first opportunity to calibrate whether FY26 is tracking toward the lower consensus or the higher CMC projection. Investors seeking institutional views should consult post-May 5 research publications.
The mechanism is straightforward: when the RBA raises rates, the spread between what Westpac pays for deposits and what it charges on loans tends to widen. That spread, the net interest margin (NIM), is the primary engine of bank profitability, and profitability determines how much the board can sustainably pay in dividends.
As of 30 April 2026, the RBA cash rate sits at 4.10% following a 25 basis point hike in March. The expected path forward involves three further increases:
Australia’s inflation trajectory sits at the centre of the rate outlook: headline CPI reached 4.6% in March 2026, nearly double the top of the RBA’s 2-3% target band, with trimmed mean inflation at 3.3% suggesting the acceleration is partly driven by volatile energy prices rather than a uniform deterioration in underlying conditions.
Rate cuts are not anticipated before 2027.
On paper, this is a tailwind for bank margins. In practice, Westpac’s FY25 result complicates the picture. Net profit fell to $6.99 billion, with fierce mortgage price competition cited as a contributing factor. The bank is lending at tighter margins to defend market share, which limits how much of the rate benefit reaches the bottom line.
While higher rates expand the spread between Westpac’s deposit costs and lending returns, the competitive mortgage market limits how much of that expansion flows through to profit and dividends.
For the FY27-FY28 dividend projections to hold, Westpac needs the rate tailwind to outweigh competitive margin compression. That balance is the single most important variable in the earnings outlook.
Most Australian investors understand that franking credits are beneficial. Fewer can quantify exactly how they change the return on a specific holding. The mechanics are worth working through with real numbers.
When Westpac pays a fully franked dividend, the 30% corporate tax the bank has already paid on those earnings is attached as a credit. Eligible shareholders can use that credit to offset their own tax liability on the dividend income. For the FY25 dividend of $1.53 per share, the grossed-up value is calculated as $1.53 / (1 – 0.30) = approximately $2.19 per share.
At a share price of $38.43, that grossed-up figure produces a yield of approximately 5.7%, well above the 3.98% cash yield. The benefit, however, is not uniform.
The same $1.53 dividend translates to different effective yields depending on the holder’s tax position:
For SMSF trustees and retirees building passive income portfolios, the franking credit component shifts Westpac’s headline yield from competitive into genuinely compelling territory, a distinction that raw yield comparisons to term deposits or international equities would miss.
Individual circumstances vary, and readers should seek personal tax advice.
The forecast numbers assume a baseline that holds. Three specific mechanisms could break it.
| Risk Factor | Trigger Condition | Dividend Metric to Watch |
|---|---|---|
| UNITE cost overruns | Programme costs exceed revised $285M estimate | Payout ratio, free capital generation |
| Mortgage margin compression | NIM declines despite rising cash rate | NIM disclosure in half-year results |
| Credit quality deterioration | Cash rate holds above 4.5% into 2027 | Arrears rate, impairment charges |
None of these risks individually makes the dividend forecast implausible. Collectively, they define the conditions under which the $1.64 and $1.70 projections would need to be revised downward, and monitoring them gives investors the earliest possible signal that the thesis is changing.
Broker consensus price targets clustering 8-11% below the current share price represent the most direct challenge to total return assumptions for income investors: a move toward the Morgans price target of A$34.04 would erase multiple years of dividend income, meaning the yield analysis in isolation understates the full risk of holding at current levels.
Zooming out from the near-term risks, Westpac’s historical payout behaviour offers a useful anchor. The bank has maintained a consistent semi-annual dividend cadence for over a decade, with one notable exception: the 2020 cut, driven by the COVID-19 pandemic and regulatory pressure from APRA, not by structural balance sheet weakness.
APRA’s capital adequacy standard for ADIs sets the capital conservation buffer requirements that directly constrain how much of a bank’s earnings can be distributed as dividends, meaning Westpac’s payout decisions operate within a regulatory ceiling that can tighten if capital ratios come under pressure.
Westpac’s 2020 dividend cut was regulator-influenced and pandemic-driven, not a signal of structural earnings weakness. In every other year across the past decade, the bank maintained or grew its payout.
Three structural indicators support the forward reliability of that track record:
The share price decline from the 2025 highs above $41 to the current $38.43 has also improved the entry proposition for new buyers. On the same $1.53 dividend, the trailing yield moved from approximately 3.73% at $41 to 3.98% at $38.43. No change in dividend policy was required; the price did the work.
A single dividend cut in over ten years, driven by an unprecedented global event, is the kind of track record income investors in ASX financials evaluate favourably. It does not eliminate risk, but it contextualises the reliability of the forward projections.
The multi-year picture is straightforward. From the confirmed FY25 base of $1.53, through the FY26 consensus range and the higher CMC projections, to a projected $1.70 in FY28, the trajectory implies approximately 11% cumulative dividend growth across three years. That pace is modest, gradual, and consistent with Westpac’s historical growth rate.
At the current price, the FY28 grossed-up yield reaches approximately 5.7% for eligible Australian investors, a figure that would compare favourably to most fixed-income alternatives if it materialises.
Whether it materialises depends on specific events in the next six months. Investors monitoring this thesis should watch three catalysts:
Westpac is a structurally sound dividend payer for Australian income investors. The $1.64-$1.70 trajectory, however, assumes competitive pressures do not intensify further and that the UNITE programme delivers its intended efficiency benefits within budget. Income investors do not need certainty to make a position decision; they need a clear picture of what they are buying, what could change it, and when they will know.
For investors comparing yield across the Big Four before allocating fresh capital, our dedicated guide to CBA’s dividend case examines CBA’s fully franked yield, its two-decade uninterrupted payment record, and how the effective gross yield for SMSFs in pension phase compares directly to Westpac’s current income proposition at equivalent entry prices.
This article is for informational purposes only and should not be considered financial advice. Investors should conduct their own research and consult with financial professionals before making investment decisions. Past performance does not guarantee future results. Financial projections are subject to market conditions and various risk factors.
CMC Invest projects Westpac dividends of $1.605 per share in FY26, $1.64 in FY27, and $1.70 in FY28, though the FY26 consensus from CommSec and DivvyDiary clusters in a lower $1.55-$1.58 range. The FY27 and FY28 figures rely on a single source, so investors should treat them as indicative rather than confirmed consensus estimates.
At the current share price of $38.43 and the FY25 dividend of $1.53 per share, eligible Australian investors receive a grossed-up yield in the range of approximately 4.1% to 6%, depending on their individual tax position. SMSF trustees in pension phase receive the full franking credit as a cash refund, placing them at the upper end of that range.
Westpac is scheduled to release its FY26 half-year results on 5 May 2026, at which point the interim dividend amount will be confirmed. The expected ex-dividend date is 8 May 2026, with the dividend payment date expected on 26 June 2026.
Three key risks could pressure the dividend trajectory: cost overruns in the UNITE technology programme (already revised up to $285 million), continued net interest margin compression from competitive mortgage pricing, and potential credit quality deterioration if RBA rate hikes exceed expectations and remain elevated into 2027.
Westpac has maintained a consistent semi-annual dividend cadence for over a decade, with one exception in 2020 when the payout was cut due to the COVID-19 pandemic and APRA regulatory pressure, not structural balance sheet weakness. In every other year across the past decade, the bank maintained or grew its dividend.